Leap Ahead with a Regression Breakout on Crude OilThe Leap Trading Competition: Your Chance to Shine
TradingView’s “The Leap” Trading Competition presents a unique opportunity for traders to put their futures trading skills to the test. This competition allows participants to trade select CME Group futures contracts, including Crude Oil (CL) and Micro Crude Oil (MCL), giving traders access to one of the most actively traded commodities in the world.
Register and compete in "The Leap" here: TradingView Competition Registration .
This article breaks down a structured trade idea using linear regression breakouts, Fibonacci retracements, and UnFilled Orders (UFOs) to identify a long setup in Crude Oil Futures. Hopefully, this structured approach aligns with the competition’s requirements and gives traders a strong trade plan to consider. Best of luck to all participants.
Spotting the Opportunity: A Regression Breakout in CL Futures
Trend reversals often present strong trading opportunities. One way to detect these shifts is by analyzing linear regression channels—a statistical tool that identifies the general price trend over a set period.
In this case, a 4-hour CL chart shows that price has violated the upper boundary of a downward-sloping regression channel, suggesting the potential start of an uptrend. When such a breakout aligns with key Fibonacci retracement levels and existing UnFilled Orders (UFOs), traders may gain a potential extra edge in executing a structured trade plan.
The Trade Setup: Combining Fibonacci and a Regression Channel
This trade plan incorporates multiple factors to define an entry, stop loss, and target:
o Entry Zone:
An entry or pullback to the 50%-61.8% Fibonacci retracement area, between 74.60 and 73.14, provides a reasonable long entry.
o Stop Loss:
Placed below 73.14 to ensure a minimum 3:1 reward-to-risk ratio.
o Profit-Taking Strategy:
First target at 76.05 (38.2% Fibonacci level)
Second target at 77.86 (23.6% Fibonacci level)
Final target at 78.71, aligning with a key UFO resistance level
This approach locks in profits along the way while allowing traders to capitalize on an extended move toward the final resistance zone.
Contract Specifications and Margin Considerations
Understanding contract specifications and margin requirements is essential when trading futures. Below are the key details for CL and MCL:
o Crude Oil Futures (CL) Contract Details
Full contract specs: CL Contract Specifications – CME Group
Tick size: 0.01 per barrel ($10 per tick)
Margin requirements vary based on market conditions and broker requirements. Currently set around $5,800.
o Micro WTI Crude Oil Futures (MCL) Contract Details
Full contract specs: MCL Contract Specifications – CME Group
Tick size: 0.01 per barrel ($1 per tick)
Lower margin requirements for more flexible risk control. Currently set around $580.
Choosing between CL and MCL depends on risk tolerance and account size. MCL provides more flexibility for smaller accounts, while CL offers higher liquidity and contract value.
Execution and Market Conditions
To maximize trade efficiency, conservative traders could wait for a proper price action into the entry zone and confirm the setup using momentum indicators and/or volume trends.
Key Considerations Before Entering
Ensure price reaches the 50%-61.8% Fibonacci retracement zone before executing the trade
Look for confirmation signals such as increased volume, candlestick formations, or additional support zones
Be patient—forcing a trade without confirmation increases risk exposure
Final Thoughts
This Crude Oil Futures trade setup integrates multiple confluences—a regression breakout, Fibonacci retracements, and UFO resistance—to create a structured trade plan with defined risk management.
For traders participating in The Leap Trading Competition, this approach emphasizes disciplined execution, dynamic risk management, and a structured scaling-out strategy, all essential components for long-term success.
When charting futures, the data provided could be delayed. Traders working with the ticker symbols discussed in this idea may prefer to use CME Group real-time data plan on TradingView: www.tradingview.com - This consideration is particularly important for shorter-term traders, whereas it may be less critical for those focused on longer-term trading strategies.
General Disclaimer:
The trade ideas presented herein are solely for illustrative purposes forming a part of a case study intended to demonstrate key principles in risk management within the context of the specific market scenarios discussed. These ideas are not to be interpreted as investment recommendations or financial advice. They do not endorse or promote any specific trading strategies, financial products, or services. The information provided is based on data believed to be reliable; however, its accuracy or completeness cannot be guaranteed. Trading in financial markets involves risks, including the potential loss of principal. Each individual should conduct their own research and consult with professional financial advisors before making any investment decisions. The author or publisher of this content bears no responsibility for any actions taken based on the information provided or for any resultant financial or other losses.
WTI

BRIEFING Week #5 : Still Patient...Here's your weekly update ! Brought to you each weekend with years of track-record history..
Don't forget to hit the like/follow button if you feel like this post deserves it ;)
That's the best way to support me and help pushing this content to other users.
Kindly,
Phil

WTI - Weekly forecast, Technical Analysis & Trading IdeasMidterm forecast:
While the price is above the support 64.000, resumption of uptrend is expected.
We make sure when the resistance at 80.100 breaks.
If the support at 64.000 is broken, the short-term forecast -resumption of uptrend- will be invalid.
Technical analysis:
A trough is formed in daily chart at 66.510 on 11/18/2024, so more gains to resistance(s) 75.446, 77.920 and maximum to Major Resistance (80.100) is expected.
Take Profits:
75.446
77.920
80.100
83.961
87.000
93.882
100.802
109.192
126.350
__________________________________________________________________
❤️ If you find this helpful and want more FREE forecasts in TradingView,
. . . . . Please show your support back,
. . . . . . . . Hit the 👍 BOOST button,
. . . . . . . . . . . Drop some feedback below in the comment!
🙏 Your Support is appreciated!
Let us know how you see this opportunity and forecast.
Have a successful week,
ForecastCity Support Team

USOIL Trading IdeaBased on Simple Technical Analysis ( Trendline + Support & Resistance )
Risk Disclaimer:
Please be advised that I am not telling anyone how to spend or invest their money. Take all of my analysis as my own opinion, as entertainment, and at your own risk. I assume no responsibility or liability for any errors or omissions in the content of this page, and they are for educational purposes only. Any action you take on the information in this analysis is strictly at your own risk. There is a very high degree of risk involved in trading. Past results are not indicative of future returns. Good luck :-)

WTI CRUDE OIL: Bullish dirgence on 4H RSI points to $85.00WTI Crude Oil is neutral on its 1D technical outlook (RSI = 46.798, MACD = 0.400, ADX = 43.927) as it hit the 1D MA50 and so far it is holding it. The correction of the past 2 weeks has been significant but the 4H RSI is posting a bullish divergence on HL and we might be technically having a bottom like February 27th. We anticipate an identical +18% rise (TP = 85.00).
## If you like our free content follow our profile to get more daily ideas. ##
## Comments and likes are greatly appreciated. ##

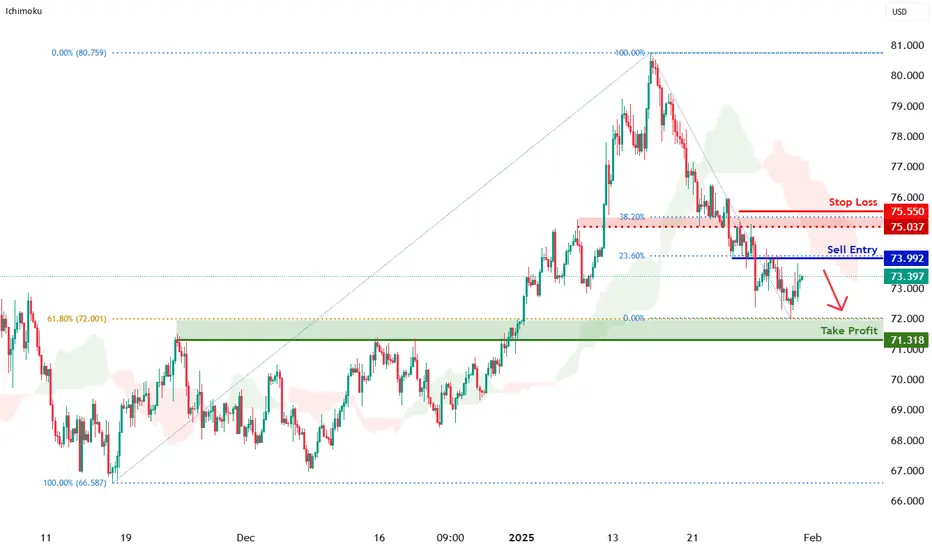
WTI Oil H4 | Bearish downtrend to extend further?WTI oil (USOIL) is rising towards an overlap resistance and could potentially reverse off this level to drop lower.
Sell entry is at 73.99 which is an overlap resistance that aligns with the 23.6% Fibonacci retracement.
Stop loss is at 75.55 which is a level that sits above the 38.2% Fibonacci retracement and an overlap resistance.
Take profit is at 71.31 which is a pullback support that aligns close to the 61.8% Fibonacci retracement.
High Risk Investment Warning
Trading Forex/CFDs on margin carries a high level of risk and may not be suitable for all investors. Leverage can work against you.
Stratos Markets Limited (www.fxcm.com):
CFDs are complex instruments and come with a high risk of losing money rapidly due to leverage. 63% of retail investor accounts lose money when trading CFDs with this provider. You should consider whether you understand how CFDs work and whether you can afford to take the high risk of losing your money.
Stratos Europe Ltd (www.fxcm.com):
CFDs are complex instruments and come with a high risk of losing money rapidly due to leverage. 63% of retail investor accounts lose money when trading CFDs with this provider. You should consider whether you understand how CFDs work and whether you can afford to take the high risk of losing your money.
Stratos Trading Pty. Limited (www.fxcm.com):
Trading FX/CFDs carries significant risks. FXCM AU (AFSL 309763), please read the Financial Services Guide, Product Disclosure Statement, Target Market Determination and Terms of Business at www.fxcm.com
Stratos Global LLC (www.fxcm.com):
Losses can exceed deposits.
Please be advised that the information presented on TradingView is provided to FXCM (‘Company’, ‘we’) by a third-party provider (‘TFA Global Pte Ltd’). Please be reminded that you are solely responsible for the trading decisions on your account. There is a very high degree of risk involved in trading. Any information and/or content is intended entirely for research, educational and informational purposes only and does not constitute investment or consultation advice or investment strategy. The information is not tailored to the investment needs of any specific person and therefore does not involve a consideration of any of the investment objectives, financial situation or needs of any viewer that may receive it. Kindly also note that past performance is not a reliable indicator of future results. Actual results may differ materially from those anticipated in forward-looking or past performance statements. We assume no liability as to the accuracy or completeness of any of the information and/or content provided herein and the Company cannot be held responsible for any omission, mistake nor for any loss or damage including without limitation to any loss of profit which may arise from reliance on any information supplied by TFA Global Pte Ltd.
The speaker(s) is neither an employee, agent nor representative of FXCM and is therefore acting independently. The opinions given are their own, constitute general market commentary, and do not constitute the opinion or advice of FXCM or any form of personal or investment advice. FXCM neither endorses nor guarantees offerings of third party speakers, nor is FXCM responsible for the content, veracity or opinions of third-party speakers, presenters or participants.
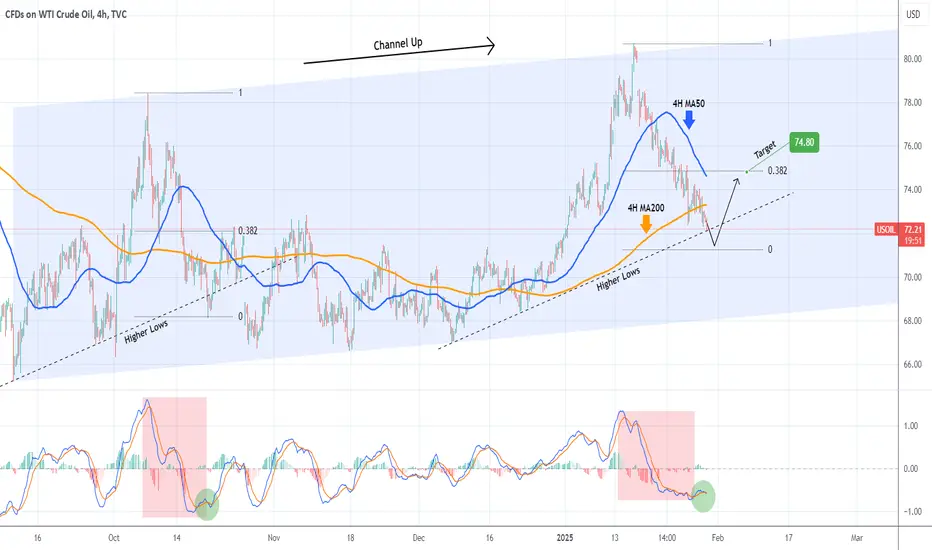
WTI OIL on a Bearish Leg but short-term rebound expected.WTI Oil (USOIL) has been trading within a Channel Up pattern that is unfolding its latest Bearish Leg. This Leg just hit the Higher Lows trend-line from the last bottom, which is so far no different than what took place during the previous Bearish Leg on October 18 2024.
The 4H MACD sequences among the two fractals are very similar so, as the October price action did, we expect a marginal breach of the Higher Lows followed by an instant rebound above the 4H MA50 (blue trend-line) and towards the 0.382 Fibonacci retracement level. As a result our short-term Target is $74.80.
-------------------------------------------------------------------------------
** Please LIKE 👍, FOLLOW ✅, SHARE 🙌 and COMMENT ✍ if you enjoy this idea! Also share your ideas and charts in the comments section below! This is best way to keep it relevant, support us, keep the content here free and allow the idea to reach as many people as possible. **
-------------------------------------------------------------------------------
💸💸💸💸💸💸
👇 👇 👇 👇 👇 👇
WTI: Will oil return to the upward trajectory?!WTI oil is located between EMA200 and EMA50 on the 4-hour timeframe and is moving in its ascending channel. In case of a downward correction towards the demand zone, the next opportunity to buy oil with a suitable reward for risk will be provided to us. A valid breakdown of the drawn downtrend line and preservation of the channel will pave the way for oil to reach the drawn ranges.
Under the pressure of imminent sanctions planned by the Trump administration and the debts Iran now owes to China, the country has begun offloading crude oil that had been stored in Chinese warehouses for years. This oil, shipped to China between 2018 and 2019 but not officially declared in Chinese customs records, was kept in isolated, pre-designated storage facilities. With storage costs reaching hundreds of millions of dollars, Iran is now obligated to cover these expenses. So far, 5.4 million barrels of oil have been removed from a Chinese port, transported by a total of four tankers.
According to a Bloomberg report, OPEC+ is likely to maintain its current supply policy in its meeting next week. This decision contradicts the request of U.S. President Donald Trump, who has urged oil producers to increase output to lower prices and exert more economic pressure on Russia to end the war in Ukraine. Under the current plan, oil supply restrictions will remain in place for this quarter and will gradually ease starting in April.
Donald Trump plans to sign an executive order to initiate the development of a “next-generation” missile defense system in the United States. This system, modeled after Israel’s Iron Dome, is designed to protect the U.S. from ballistic missile attacks, hypersonic missiles, advanced cruise missiles, and other modern aerial threats.
According to the released information, the executive order aims to establish an advanced space-based missile defense system capable of detecting and neutralizing missiles launched toward the U.S. Conceptually, this resembles Israel’s Iron Dome, which has been used for years to intercept and destroy rockets fired from Gaza. The U.S.government has already invested billions of dollars in developing Israel’s Iron Dome, and the American military possesses its own missile defense systems.
The order describes missile attacks as a “catastrophic threat,” but no details have been provided regarding the project’s costs or timeline. Developing a comprehensive missile defense system for a country as geographically vast as the U.S. is a highly complex and costly endeavor. Additionally, the emergence of next-generation missile threats, such as hypersonic missiles that travel at extremely high speeds, presents significant technical challenges. This indicates that the project will require substantial investment and time for completion.

Trump's pressure on OPEC prompted the drop in USOIL prices.
President Trump's steadfast dedication to lowering oil prices is driving the decline in WTI prices. During the WEF in Davos, Switzerland, he made it clear that he would demand Saudi Arabia and OPEC to reduce the price of crude oil. He boldly stated that lower oil prices could potentially lead to an end to the war in Ukraine. According to CSIS, Trump's call for reduced oil prices is a positive move for consumers and businesses but it is the one that the US oil industry will regard with caution.
Failing to rise above EMA21, USOIL shows consolidation near 73.40. The price remains within the descending channel, and both EMAs have widened apart, indicating a potential continuation of the bearish momentum. If USOIL fails to breach EMA21, the price may fall further to the support at 71.50, where the channel’s lower bound coincides. Conversely, if USOIL breaches above EMA21 and the channel’s upper bound, the price could gain upward momentum to 74.50

CRUDE OIL Will Go UP! Buy!
Hello,Traders!
CRUDE OIL made a massive
10% bearish correction but
Then it hit a horizontal support
Of 72.89$ and a bullish rebound
Is already happening so we
Are bullish biased and we will
Be expecting a further move up
Buy!
Comment and subscribe to help us grow!
Check out other forecasts below too!

USOIL Maintains a Persistent Bearish BiasThe WTI barrel has experienced a loss of over 8% since mid-January, mainly because the peace agreement between Israel and Palestine has come into effect without issues, and Trump’s ongoing comments about increased production in the United States have contributed to the bearish sentiment. Both factors have led the market to expect growing supply and weak demand prospects, which has inevitably sustained bearish pressure on crude oil prices.
Lack of Clear Trend:
Recent movements have caused the barrel to accumulate a prolonged bearish correction, casting doubt on the bullish trendline established since December 2024. Now, the price faces a key support zone, which could serve as a decision point for a potential sustained bearish trend.
ADX:
The ADX line has consistently oscillated above the neutral level of 20. However, recent movements show a current downward slope, indicating a lack of clear trend in the market. If the ADX line continues to decline, the current bearish movement may struggle to break through the existing support zone.
MACD:
Both MACD lines are consistently declining, and the histogram remains below the neutral line at 0. This indicates that bearish pressure continues to dominate in the short term. However, recent histogram readings have not reached progressively lower levels, suggesting indecision in the current bearish movement, which could allow for short-term upward corrections.
Key Levels:
$72: The current support level on the chart. Oscillations below this level could further increase bearish pressure and pave the way for a more defined downward trend.
$78: The last high reached by the barrel of crude oil. Bullish oscillations that revisit this level could revive the short-term upward trend that was forming since December.
By Julian Pineda, CFA - Market Analyst

WTI - Daily TradingRange ZoneBLACKBULL:WTI is oscillating between two key trend lines, and after hunting liquidity under the last bullish leg, another upward move is possible. This setup presents buy opportunities on lower time frames, and I’ll update this idea accordingly.
Additionally, oil remains within a broader trading range, reacting precisely to the mid-zone, which has previously acted as dynamic support. This level could push prices higher in the short term.
📈 Watch for potential bullish setups and follow for timely updates!

BRIEFING Week #4 : Complex Week AheadHere's your weekly update ! Brought to you each weekend with years of track-record history..
Don't forget to hit the like/follow button if you feel like this post deserves it ;)
That's the best way to support me and help pushing this content to other users.
Kindly,
Phil

USOIL - Bearish Head and Shoulders Hello Traders !
The USOIL failed to break the resistance level (80.148 - 79.652).
The price formed a head and shoulders pattern.
Currently, The neckline is broken !
So, I expect a bearish move📉
________________
TARGET: 74.450🎯

Does WTI Oil have enough energy to travel back up?After an unsuccessful breakout in mid-January, MARKETSCOM:OIL made its move back down. That said, it's currently finding support near the 200-day EMA. On one hand, it may seem that this is the place for a potential rebound, however, the bulls should not get their hopes up, because there some indication for a possible drift further south. Take a look at the video idea.
TVC:USOIL
RISK DISCLAIMER
74.2% of retail investor accounts lose money when trading CFDs with this provider. You should consider whether you understand how CFDs work and whether you can afford to take the high risk of losing your money. Past performance is not necessarily indicative of future results. The value of investments may fall as well as rise and the investor may not get back the amount initially invested. This content is not intended for nor applicable to residents of the UK. Cryptocurrency CFDs and spread bets are restricted in the UK for all retail clients.

Behind the Curtain: Economic Forces Fueling Crude Oil Futures1. Introduction
Crude Oil Futures (CL), traded on the CME, are a cornerstone of global energy markets. Representing a vital benchmark for the energy sector, these futures reflect shifts in supply, demand, and macroeconomic sentiment. As both a speculative and hedging instrument, CL Futures are closely tied to economic forces shaping the global economy.
In this article, we leverage machine learning insights from a Random Forest Regressor to uncover the top economic indicators influencing Crude Oil Futures across daily, weekly, and monthly timeframes. By identifying these drivers, traders can gain a data-driven perspective to navigate the dynamic crude oil market effectively.
2. Understanding Crude Oil Futures
o Contract Specifications:
Standard Contract: Represents 1,000 barrels of crude oil.
Tick Size: Each tick is 0.01 per barrel, equating to $10 per tick per contract.
Trading Hours: Nearly 24 hours, ensuring global access and liquidity.
o Micro Crude Oil Contracts (MCL):
Contract Size: Represents 100 barrels of crude oil, 1/10th the size of the standard CL contract.
Tick Size: Each tick is 0.01 per barrel, equating to $1 per tick per contract.
Purpose: Offers smaller-scale traders’ access to the crude oil market with lower capital requirements, making it ideal for those looking to hedge or test strategies.
o Margins:
Standard CL Contract Margin: Approximately $6,000 per contract (subject to market volatility).
Micro MCL Contract Margin: Approximately $600 per contract.
The combination of high liquidity, leverage, and the flexibility offered by Micro Crude Oil contracts makes CL Futures a versatile choice for a broad range of participants, from institutional investors to retail traders exploring smaller-scale strategies.
3. Daily Timeframe: Key Economic Indicators
Machine learning insights reveal that the following daily indicators play a crucial role in shaping Crude Oil Futures' movements:
U.S. Trade Balance: Measures the difference between exports and imports. A narrowing trade deficit signals improved economic health and potential upward pressure on oil demand, while a widening deficit may indicate weakened economic sentiment, weighing on crude prices.
Unemployment Rate: Reflects labor market conditions and overall economic health. A declining unemployment rate often correlates with increased energy consumption due to stronger economic activity, boosting crude oil prices.
Building Permits: Tracks new residential construction permits issued. Rising permits reflect economic confidence and can signal increased energy demand for construction activity, providing upward momentum for crude prices.
4. Weekly Timeframe: Key Economic Indicators
Weekly indicators provide medium-term insights into crude oil market dynamics. The top drivers include:
Corporate Bond Spread (BAA - 10Y): Reflects the difference between corporate bond yields and Treasury yields. Widening spreads signal economic uncertainty, potentially reducing crude oil demand. Narrowing spreads suggest stability, supporting higher crude prices.
U.S. Trade Balance (again): At the weekly level, trade balance trends highlight the interplay between global trade and crude oil demand, influencing market sentiment over several days.
Housing Price Index: Indicates trends in real estate values, reflecting consumer confidence and economic stability. Rising housing prices often signal strong economic conditions, indirectly bolstering crude oil demand.
5. Monthly Timeframe: Key Economic Indicators
Monthly indicators provide a long-term perspective on Crude Oil Futures trends, highlighting macroeconomic forces at play. The top monthly drivers are:
Natural Gas Prices: As a competing energy source, fluctuations in natural gas prices can impact crude oil demand. Rising natural gas prices often lead to increased crude consumption, while declining prices may pressure oil demand downward.
U.S. Trade Balance (again): Over a monthly timeframe, the trade balance reflects sustained shifts in international trade dynamics. Persistent trade deficits may signal weaker global economic activity, affecting crude oil prices negatively, whereas trade surpluses may support demand.
Net Exports: A critical measure of a country’s export-import balance, net exports reveal global demand for domestic products, including crude oil. Surpluses suggest robust international demand, often leading to upward pressure on oil prices, while deficits indicate weaker sentiment.
6. Applications for Different Trading Styles
Economic indicators provide actionable insights tailored to specific trading styles:
Day Traders: Focus on daily indicators such as U.S. Trade Balance, Unemployment Rate, and Building Permits to anticipate intraday volatility. For example, an unexpected improvement in building permits might signal stronger economic activity, potentially boosting crude oil prices intraday.
Swing Traders: Weekly indicators like Corporate Bond Spread (BAA - 10Y) and Housing Price Index offer insights into intermediate trends. For instance, narrowing bond spreads often reflect economic stability, aligning with medium-term bullish positions in Crude Oil Futures.
Position Traders: Monthly indicators such as Natural Gas Prices and Net Exports are essential for capturing long-term macroeconomic shifts. Sustained increases in natural gas prices, for example, might support prolonged bullish sentiment in crude oil markets.
7. Risk Management Strategies
Risk management is crucial when trading Crude Oil Futures due to the inherent volatility of energy markets. Key strategies include:
Hedging Volatility: Utilize correlated assets, such as natural gas or refined product futures, to hedge against price swings.
Monitoring Leverage: Adjust position sizes based on volatility and margin requirements to minimize risk exposure during periods of heightened uncertainty.
Timeframe Diversification: Incorporate insights from daily, weekly, and monthly indicators to create a balanced trading approach. For example, while daily indicators may signal short-term volatility, monthly metrics provide stability for longer-term trades.
8. Conclusion
Crude Oil Futures are deeply influenced by economic indicators across varying timeframes. From the U.S. Trade Balance and Building Permits driving daily fluctuations to Natural Gas Prices and Net Exports shaping long-term trends, understanding these relationships is critical for navigating the energy market.
By leveraging data-driven insights from machine learning models, traders can align their strategies with market dynamics and improve decision-making. Whether you're a day trader, swing trader, or position trader, these economic forces offer a framework for more informed and strategic trading.
Stay tuned for the next installment in the "Behind the Curtain" series, where we unveil the economic forces shaping another critical futures market.
When charting futures, the data provided could be delayed. Traders working with the ticker symbols discussed in this idea may prefer to use CME Group real-time data plan on TradingView: www.tradingview.com - This consideration is particularly important for shorter-term traders, whereas it may be less critical for those focused on longer-term trading strategies.
General Disclaimer:
The trade ideas presented herein are solely for illustrative purposes forming a part of a case study intended to demonstrate key principles in risk management within the context of the specific market scenarios discussed. These ideas are not to be interpreted as investment recommendations or financial advice. They do not endorse or promote any specific trading strategies, financial products, or services. The information provided is based on data believed to be reliable; however, its accuracy or completeness cannot be guaranteed. Trading in financial markets involves risks, including the potential loss of principal. Each individual should conduct their own research and consult with professional financial advisors before making any investment decisions. The author or publisher of this content bears no responsibility for any actions taken based on the information provided or for any resultant financial or other losses.

USOIL BULL Triangle The oil chart is showcasing a large triangle pattern within a smaller triangle, and the breakout of the smaller triangle to the upside strongly suggests that the larger triangle will also be broken. This breakout signals the potential to target significantly higher levels.
Additionally, the bottom has been tested approximately four times, with the last test clearing out all liquidity. Now, the chart appears to be gearing up for a major upward move after a prolonged accumulation phase.
As for my perspective, I’m betting on oil’s rise rather than its decline, even though the current triangle formation is typically a bearish (descending) triangle.
The second entry opportunity will present itself after the larger triangle is broken and confirmed through a retest.
Note: I don't care about the count if it right or not don't comment on that please

WTI OIL Channel Up emerging, aiming at $90.WTI Oil (USOIL) recently broke above its 15-month Lower Highs trend-line that has been keeping it under a bearish trend and is now naturally pulling back. This technical pull-back is so far within the tolerance levels of a bullish trend.
The pattern that making use of this trend is a Channel Up, newly emerged and now about to test the 1D MA200 (orange trend-line) as a Support for the first time since August 14 2024. As long as it holds, we expect the new Bullish Leg to start and as with the Jan - Apr 2024 Channel Up, rise towards the 1.786 Fibonacci extension. Our Target is quite below it at $90.00.
-------------------------------------------------------------------------------
** Please LIKE 👍, FOLLOW ✅, SHARE 🙌 and COMMENT ✍ if you enjoy this idea! Also share your ideas and charts in the comments section below! This is best way to keep it relevant, support us, keep the content here free and allow the idea to reach as many people as possible. **
-------------------------------------------------------------------------------
💸💸💸💸💸💸
👇 👇 👇 👇 👇 👇

WTI CRUDE OIL: Buy opportunity on the bottom trendline.WTI Crude Oil remains bullish on its 1D technical outlook (RSI = 58.480, MACD = 1.830, ADX = 66.542) despite the 4 day selling streak, which pushed the price under the 4H MA50. The HL trendline is still intact though, so technically that is a sound buy opportunity, especially if the 1D RSI hits the 30.000 oversold level. We're bullish (TP = 86.00).
## If you like our free content follow our profile to get more daily ideas. ##
## Comments and likes are greatly appreciated. ##

WTI could see another push to $80Upward trend with a bullish wedge break. Support is at around $75 and target is at around $80. If we see prices well below $75 this trade is invalidated. But do not put your SL to close below the support.

WTI - The fate of oil with Trump's policies?!WTI oil is located between EMA200 and EMA50 in the 4-hour time frame and is moving in its upward channel. In case of a downward correction towards the demand zone, the next opportunity to buy oil with a suitable risk reward will be provided for us.
The China National Petroleum Corporation (CNPC) has stated that China’s crude oil production is expected to increase by 1% by 2025, reaching 215 million tons. Additionally, China’s crude oil imports are projected to grow by 1%, reaching 559 million tons.
The CEO of Aramco has noted that robust demand from China will continue to drive global oil demand growth. He predicts that oil demand will rise by 1.3 million barrels per day in 2025.
Donald Trump, the President of the United States, has directed his administration to revoke the “Executive Order on Electric Vehicles.” This move aims to roll back regulations on vehicle emissions and fuel efficiency standards, which he claims unfairly restrict consumer choice.
This directive, part of a broader executive order focused on energy, also calls on regulators to consider “eliminating unfair subsidies and other misguided government interventions that favor electric vehicles over other technologies and effectively mandate their purchase.”
On Monday, President Trump signed several energy-related executive orders, declaring a “National Energy Emergency” and launching measures heavily favoring fossil fuel development and production. These actions are seen as a blow to the energy policies of the previous administration under Joe Biden, which aimed to bolster the renewable energy sector. The new executive orders focus on boosting domestic energy production and lowering consumer costs.
In December, energy prices rose, contributing to overall inflation. Key drivers of the fuel price increases included:
• Colder-than-expected winter weather,
• Supply concerns driven by sanctions and geopolitical conflicts,
• Optimism about demand stimulation from China.
Pilot Company, owned by Berkshire Hathaway, has decided to cease its international oil and fuel trading operations. This decision comes after months of restructuring and the dismissal of many traders.
The President of the Petroleum Association of Japan has stated that despite Trump’s policies, uncertainty remains regarding increased oil and LNG production by U.S. energy developers. He also noted that there is little likelihood of an immediate increase in oil imports from the U.S., as Japan prefers to maintain a stable supply of crude oil from the Middle East, which is more compatible with Japanese refineries.

WTI Oil H4 | Rising into overlap resistanceWTI oil (USOIL) is rising towards an overlap resistance and could potentially reverse off this level to drop lower.
Sell entry is at 77.20 which is an overlap resistance that aligns with the 38.2% Fibonacci retracement level.
Stop loss is at 78.77 which is a level that sits above the 61.8% Fibonacci retracement and a pullback resistance.
Take profit is at 74.85 which is a pullback support.
High Risk Investment Warning
Trading Forex/CFDs on margin carries a high level of risk and may not be suitable for all investors. Leverage can work against you.
Stratos Markets Limited (www.fxcm.com):
CFDs are complex instruments and come with a high risk of losing money rapidly due to leverage. 64% of retail investor accounts lose money when trading CFDs with this provider. You should consider whether you understand how CFDs work and whether you can afford to take the high risk of losing your money.
Stratos Europe Ltd (www.fxcm.com):
CFDs are complex instruments and come with a high risk of losing money rapidly due to leverage. 66% of retail investor accounts lose money when trading CFDs with this provider. You should consider whether you understand how CFDs work and whether you can afford to take the high risk of losing your money.
Stratos Trading Pty. Limited (www.fxcm.com):
Trading FX/CFDs carries significant risks. FXCM AU (AFSL 309763), please read the Financial Services Guide, Product Disclosure Statement, Target Market Determination and Terms of Business at www.fxcm.com
Stratos Global LLC (www.fxcm.com):
Losses can exceed deposits.
Please be advised that the information presented on TradingView is provided to FXCM (‘Company’, ‘we’) by a third-party provider (‘TFA Global Pte Ltd’). Please be reminded that you are solely responsible for the trading decisions on your account. There is a very high degree of risk involved in trading. Any information and/or content is intended entirely for research, educational and informational purposes only and does not constitute investment or consultation advice or investment strategy. The information is not tailored to the investment needs of any specific person and therefore does not involve a consideration of any of the investment objectives, financial situation or needs of any viewer that may receive it. Kindly also note that past performance is not a reliable indicator of future results. Actual results may differ materially from those anticipated in forward-looking or past performance statements. We assume no liability as to the accuracy or completeness of any of the information and/or content provided herein and the Company cannot be held responsible for any omission, mistake nor for any loss or damage including without limitation to any loss of profit which may arise from reliance on any information supplied by TFA Global Pte Ltd.
The speaker(s) is neither an employee, agent nor representative of FXCM and is therefore acting independently. The opinions given are their own, constitute general market commentary, and do not constitute the opinion or advice of FXCM or any form of personal or investment advice. FXCM neither endorses nor guarantees offerings of third-party speakers, nor is FXCM responsible for the content, veracity or opinions of third-party speakers, presenters or participants.

Hellena | Oil (4H): LONG to area of 82.000 (Wave "5"). Colleagues, all trading instruments are behaving extremely unpredictably right now due to the situation with Trump's inauguration among other things.
I see this as an opportunity to redraw the waves.
Apparently now the price is developing wave “4” and will finish it soon. I expect the price to reach the area of 82.000, renewing the high of wave “3”.
Manage your capital correctly and competently! Only enter trades based on reliable patterns!
