CRUDE OIL IN H4 DOUBLE TOP, WILL PRICE REVERT TO ITS MEAN?With a weakening crude oil price and double top created on H4, will this cause the price of the commodity to fall and revert to its mean?
N.B!
- USOIL price might not follow drawn lines . Actual price movement may likely differ from the forecast.
- Let emotions and sentiments work for you
- ALWAYS Use Proper Risk Management In Your Trades
#usoil
#crudeoil
#wti
#brentoil
WTI

WTI OIL Critical crossroads on the 16-month Resistance.WTI Oil (USOIL) is having a strong rally in the past 30 days following the rebound on the 2-year Support Zone. This Zone has contained all 1W candle closings above it, so this rebound is coming as a natural technical reaction for buyers but it is about to face a critical Resistance Cluster.
First is the 1W MA50 (blue trend-line) but the most important level is the 16-month Lower Highs trend-line that started in late September 2023. Technically, as long as it holds, the price is more likely to get rejected now back towards the Support Zone, so at the moment we are bearish with a 68.00 Target.
If the Lower Highs trend-line breaks and WTI closes a 1W candle above it, we don't expect the 1W MA200 (orange trend-line) to offer much Resistance, so we will take the small loss on the short and switch to buying. Our Target in that case will be Resistance 1 at 84.50.
-------------------------------------------------------------------------------
** Please LIKE 👍, FOLLOW ✅, SHARE 🙌 and COMMENT ✍ if you enjoy this idea! Also share your ideas and charts in the comments section below! This is best way to keep it relevant, support us, keep the content here free and allow the idea to reach as many people as possible. **
-------------------------------------------------------------------------------
💸💸💸💸💸💸
👇 👇 👇 👇 👇 👇

Waiting for Clarity: Insights on Oil and the 70 Put OptionsLet’s talk about WTI oil for a moment.
In the upcoming monthly expiration series set for January 15, there’s some interesting action happening with the 70 put options. Traders aren’t just dumping these puts; they’re actively reselling them, and there are definitely buyers stepping in. What’s even more intriguing is that the same 70 puts are being picked up in the next options series as well.
Now, if you look at the charts, it seems like prices have finally broken out of that range they’ve been stuck in for a while and are gearing up to move higher.
With this kind of sentiment in play, I’m going to hold off on making any buys for now and wait for some clearer signals before jumping in.

WTI reaches key resistance zoneCrude oil prices have been stealthily rising over the past couple of weeks, but now is the real test as prices have reached some important resistance levels.
As per the chart, WTI faces a band of resistance from its bearish trend line, 200-day moving average, and prior support and resistance, all converging around the psychologically important $75.00 level.
Specifically, the resistance range comes in between $74.55 to $77.50. Yesterday's bearish price candle was the first sign of a potential reversal, although we haven't yet seen any downside follow-through.
Support comes in around $71.50, the base of the recent breakout. Below that, $70.00 is the next downside target, followed by the recent lows.
By Fawad Razaqzada, market analyst at FOREX.com

OIL bearish bias down to $72.50The price currently trades around $73.37 and appears to be in a retracement phase after a significant sell-off. The overall structure suggests the market may continue to test lower levels with a clear rejection from the recent highs near $75.00, followed by a steady move downward.
Resistance: $74.00, where a rejection occurred
Support: $72.50, which aligns with a previous structure low
Let me know if you agree with my idea ?

USOIL - Important BreakoutHello Traders !
The USOIL price failed to create a new lower low !
Currently, The resistance line is broken !
So, I expect a bullish move🚀
_________________
TARGET: 75.52🎯

WTI Oil H4 | Falling to overlap supportWTI oil (USOIL) is falling towards an overlap support and could potentially bounce off this level to climb higher.
Buy entry is at 72.65 which is an overlap support that aligns close to the 23.6% Fibonacci retracement level.
Stop loss is at 71.10 which is a level that lies underneath a pullback support and the 50.0% Fibonacci retracement level.
Take profit is at 75.13 which is a pullback resistance.
High Risk Investment Warning
Trading Forex/CFDs on margin carries a high level of risk and may not be suitable for all investors. Leverage can work against you.
Stratos Markets Limited (www.fxcm.com):
CFDs are complex instruments and come with a high risk of losing money rapidly due to leverage. 64% of retail investor accounts lose money when trading CFDs with this provider. You should consider whether you understand how CFDs work and whether you can afford to take the high risk of losing your money.
Stratos Europe Ltd (www.fxcm.com):
CFDs are complex instruments and come with a high risk of losing money rapidly due to leverage. 66% of retail investor accounts lose money when trading CFDs with this provider. You should consider whether you understand how CFDs work and whether you can afford to take the high risk of losing your money.
Stratos Trading Pty. Limited (www.fxcm.com):
Trading FX/CFDs carries significant risks. FXCM AU (AFSL 309763), please read the Financial Services Guide, Product Disclosure Statement, Target Market Determination and Terms of Business at www.fxcm.com
Stratos Global LLC (www.fxcm.com):
Losses can exceed deposits.
Please be advised that the information presented on TradingView is provided to FXCM (‘Company’, ‘we’) by a third-party provider (‘TFA Global Pte Ltd’). Please be reminded that you are solely responsible for the trading decisions on your account. There is a very high degree of risk involved in trading. Any information and/or content is intended entirely for research, educational and informational purposes only and does not constitute investment or consultation advice or investment strategy. The information is not tailored to the investment needs of any specific person and therefore does not involve a consideration of any of the investment objectives, financial situation or needs of any viewer that may receive it. Kindly also note that past performance is not a reliable indicator of future results. Actual results may differ materially from those anticipated in forward-looking or past performance statements. We assume no liability as to the accuracy or completeness of any of the information and/or content provided herein and the Company cannot be held responsible for any omission, mistake nor for any loss or damage including without limitation to any loss of profit which may arise from reliance on any information supplied by TFA Global Pte Ltd.
The speaker(s) is neither an employee, agent nor representative of FXCM and is therefore acting independently. The opinions given are their own, constitute general market commentary, and do not constitute the opinion or advice of FXCM or any form of personal or investment advice. FXCM neither endorses nor guarantees offerings of third-party speakers, nor is FXCM responsible for the content, veracity or opinions of third-party speakers, presenters or participants.

BRIEFING Week #1 : Recession in 2025 ?Here's your weekly update ! Brought to you each weekend with years of track-record history..
Don't forget to hit the like/follow button if you feel like this post deserves it ;)
That's the best way to support me and help pushing this content to other users.
Kindly,
Phil

WTI - 2025 Q1 Forecast - Technical Analysis & Trading Ideas!💡 Midterm forecast: (Daily Time-frame)
While the price is above the support 64.00, resumption of uptrend is expected.
Technical analysis:
A trough is formed in daily chart at 66.51 on 11/18/2024, so more gains to resistance(s) 75.44 and maximum to Major Resistance (77.92) is expected.
Take Profits:
68.80
72.27
75.44
77.92
80.10
83.96
87.00
93.80
100.80
109.19
126.35
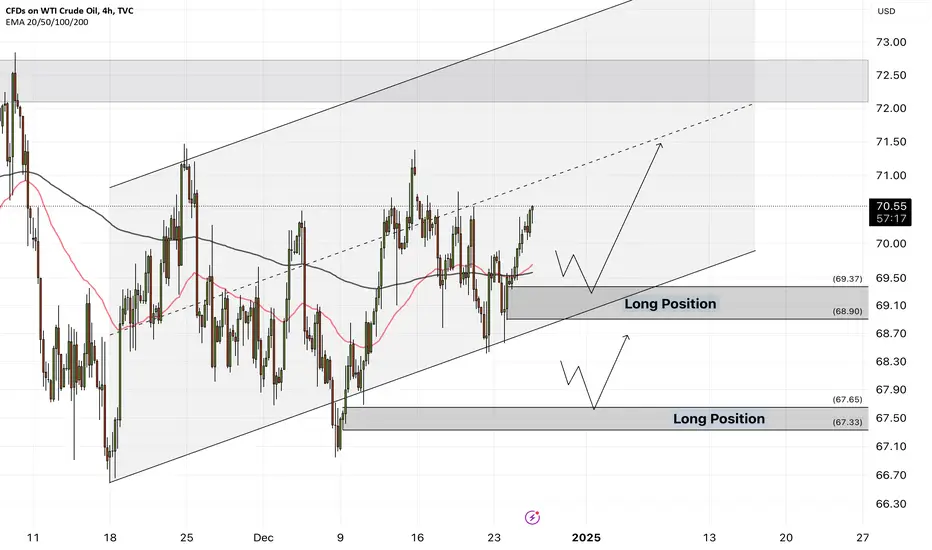
💡 Short Term forecast: (H4 Time-frame):
The bullish wave is expected to continue as long as the price is above the strong Support at 70.53
Forecast:
1- Correction wave toward the Buy Zone
2- Another Upward Impulse wave toward Higher TPs
SL: Below 70.53
__________________________________________________________________
❤️ If you find this helpful and want more FREE forecasts in TradingView,
. . . . . Please show your support back,
. . . . . . . . Hit the 👍 BOOST button,
. . . . . . . . . . . Drop some feedback below in the comment!
🙏 Your Support is appreciated!
Let us know how you see this opportunity and forecast.
Have a successful week,
ForecastCity Support Team

Oil Bulls Go for the Break into Yearly OpenOil prices are threatening a major breakout here after clearing resistance yesterday at the objective 2024 yearly open near 72.14 .
The focus is on todays close with respect to the 61.8% retracement at 73.90 . A daily close above would keep the focus on a possible rally towrads the 78.6% retracement at 75.89 and the October high-close at 77.25 - note the highlighted slope confluence (look for a larger reaction there IF reached).
Initial support back at 72.14 with bullish invalidation now raised to 71.02 .
MB

Berry Corporation - 13.5% dividend yieldBerry is in the oil and gas sector, where its current low share price and improved financials offer upside potential, albeit with higher risk

Murphy Oil Corp START BUY at 14The company in the energy sector is undertaking efforts to optimize debts and increase efficiency in production. Stable dividends and share buybacks create an interesting investment opportunity

Will Iran's Nuclear Ambitions Redefine Global Energy Markets?In a world where geopolitical tensions and energy markets dance an intricate waltz, the latest developments surrounding Iran's nuclear program have emerged as a pivotal factor in global oil dynamics. The Biden administration's deliberation of military options against Iranian atomic facilities has introduced a new variable into the complex equation of international energy markets, forcing investors and analysts to reassess their traditional market models.
The strategic significance of the Middle East's oil infrastructure, particularly the Strait of Hormuz, hangs in delicate balance as diplomatic chess moves unfold. With approximately one-fifth of the world's oil supply flowing through this crucial chokepoint, the stakes extend far beyond regional politics, touching every corner of the global economy. Market participants have begun incorporating these heightened risks into their pricing models, reflecting a new reality where geopolitical considerations carry as much weight as traditional supply and demand metrics.
The energy sector stands at a crossroads where strategic petroleum reserves, investment strategies, and risk management protocols face unprecedented challenges. Portfolio managers and energy traders must navigate this complex landscape while balancing short-term volatility against long-term strategic positioning. As the situation continues to evolve, the global oil market serves as a mirror reflecting the broader implications of international security dynamics, challenging conventional wisdom about energy market fundamentals and forcing a reevaluation of traditional risk assessment models.

Brent - good start of oil in the new year!Brent oil is above EMA200 and EMA50 in the 4-hour time frame and is moving in its upward channel. On the ceiling of the ascending channel, we will look for oil selling positions. In case of a valid break of the $75 range, we can see the continuation of the downward trend. On the other hand, within the demand zone, we can buy with a suitable risk reward.
Over the past three months, the Brent crude oil market has emerged as the largest commodity market in the world, with a daily trading volume of $75.2 billion. The credit rating agency Fitch has stated that geopolitical tensions may increase volatility in the global oil and gas sector. The agency expects global oil demand in 2025 to grow at a similar pace to 2024, although this growth is likely to be slower than in 2022 and 2023.
President Joe Biden is reportedly planning to impose a 20-year ban on leasing public lands for oil and gas exploration in Nevada. According to Fox News, this move is being considered in the final weeks of Biden’s presidency, just ahead of Donald Trump’s inauguration. This prohibition would prevent companies from leasing federal lands in the region for oil and gas exploration or extraction activities.
As reported by Axios, Biden has been reviewing potential options for a military strike on Iran’s nuclear facilities. This action would only be considered if Iran takes significant steps toward building nuclear weapons before January 20. Reports indicate that Iran has enriched uranium to 60%, which is close to the 90% threshold required for weapons-grade material. Additionally, advancements in Iran’s centrifuge technology suggest the country could achieve this level within a matter of days.
However, reports also caution that developing a nuclear warhead would still require at least one year. These assessments come as Biden approaches the end of his term and Donald Trump prepares to assume the presidency.
Trump’s approach to Iran and its nuclear program is a topic of great interest, given his record during his first term. Previously, Trump adopted a “maximum pressure” strategy against Iran and withdrew from the Joint Comprehensive Plan of Action (JCPOA). The question now arises whether he will pursue a similar course of action or take a different approach in his new administration.

WTI OIL Break-out or rejection strategy.WTI Oil (USOIL) gave us an excellent buy signal last time (December 27, see chart below) that produced a Bullish Leg straight to our $72.80 Target:
The price is right now above Resistance 2 and almost at the top (Higher Highs trend-line) of the Channel Up. Having completed a +6.65% rise (which was the previous Bullish Leg), it is now highly likely to start seeing a reversal to a Bearish Leg. Especially since the 1D RSI is testing the October 07 2024 High.
As long the price gets rejected below the top of the Channel Up, we will be bearish, targeting $70.50 (above the 0.618 Fib and the 1D MA50). If the price breaks and closes a 1D candle above the Channel Up, we will take the small loss and switch to a buy, targeting the 1D MA200 (orange trend-line) at $75.15.
-------------------------------------------------------------------------------
** Please LIKE 👍, FOLLOW ✅, SHARE 🙌 and COMMENT ✍ if you enjoy this idea! Also share your ideas and charts in the comments section below! This is best way to keep it relevant, support us, keep the content here free and allow the idea to reach as many people as possible. **
-------------------------------------------------------------------------------
💸💸💸💸💸💸
👇 👇 👇 👇 👇 👇

WTI Oil D1 | Potential bearish reversalWTI oil (USOIL) is rising towards a swing-high resistance and could potentially reverse off this level to drop lower.
Sell entry is at 72.17 which is a swing-high resistance that aligns with the 50.0% Fibonacci retracement level.
Stop loss is at 73.60 which is a level that sits above a pullback resistance.
Take profit is at 69.21 which is a swing-low support.
High Risk Investment Warning
Trading Forex/CFDs on margin carries a high level of risk and may not be suitable for all investors. Leverage can work against you.
Stratos Markets Limited (www.fxcm.com):
CFDs are complex instruments and come with a high risk of losing money rapidly due to leverage. 64% of retail investor accounts lose money when trading CFDs with this provider. You should consider whether you understand how CFDs work and whether you can afford to take the high risk of losing your money.
Stratos Europe Ltd (www.fxcm.com):
CFDs are complex instruments and come with a high risk of losing money rapidly due to leverage. 66% of retail investor accounts lose money when trading CFDs with this provider. You should consider whether you understand how CFDs work and whether you can afford to take the high risk of losing your money.
Stratos Trading Pty. Limited (www.fxcm.com):
Trading FX/CFDs carries significant risks. FXCM AU (AFSL 309763), please read the Financial Services Guide, Product Disclosure Statement, Target Market Determination and Terms of Business at www.fxcm.com
Stratos Global LLC (www.fxcm.com):
Losses can exceed deposits.
Please be advised that the information presented on TradingView is provided to FXCM (‘Company’, ‘we’) by a third-party provider (‘TFA Global Pte Ltd’). Please be reminded that you are solely responsible for the trading decisions on your account. There is a very high degree of risk involved in trading. Any information and/or content is intended entirely for research, educational and informational purposes only and does not constitute investment or consultation advice or investment strategy. The information is not tailored to the investment needs of any specific person and therefore does not involve a consideration of any of the investment objectives, financial situation or needs of any viewer that may receive it. Kindly also note that past performance is not a reliable indicator of future results. Actual results may differ materially from those anticipated in forward-looking or past performance statements. We assume no liability as to the accuracy or completeness of any of the information and/or content provided herein and the Company cannot be held responsible for any omission, mistake nor for any loss or damage including without limitation to any loss of profit which may arise from reliance on any information supplied by TFA Global Pte Ltd.
The speaker(s) is neither an employee, agent nor representative of FXCM and is therefore acting independently. The opinions given are their own, constitute general market commentary, and do not constitute the opinion or advice of FXCM or any form of personal or investment advice. FXCM neither endorses nor guarantees offerings of third-party speakers, nor is FXCM responsible for the content, veracity or opinions of third-party speakers, presenters or participants.

Hellena | Oil (4H): Short to support area at 66.867.Colleagues, oil has been in a sideways movement for the last month and is not living up to our expectations, but I still believe that the price will start a downward movement to the support area at 66.867.
Now the price is in a complicated wave movement, which I named (A, B, C). In fact, the movement is more complicated, but I will not describe the rules of the Leading diagonal now.
So I expect that the price will reach the area of 72, complete wave 2 and start a downward movement.
But there is a variant when the price will start the movement at once.
Therefore, I do not recommend long positions.
Manage your capital correctly and competently! Only enter trades based on reliable patterns!

#202452 - priceactiontds - year end special - wti crude oilGood Evening and I hope you are well.
comment: Probably the most boring outlook to write. Oil has been in a triangle since 2023-09 and we will see a bigger breakout in 2025. To which side? Absolutely no idea. Oil has been stuck inside a 10% range for the past 10 weeks and it’s almost not possible that the range contracts further. We have nested triangles and the biggest of those can play out a couple of more weeks. It’s always possible that the pattern fails and market could just continue sideways for longer. Since I don’t have a crystal ball, I do not have an opinion on where this could break out. Market is in total balance around 69. I will continue to take this market level by level and play the given range. Since neither side has any arguments for their case, I won’t write a bull/bear case for this. If you don’t like trading ranges, just don’t trade this.
current market cycle: trading range (nested triangles on multiple time frames)
key levels for 2025: 65 - 75
short term: I won’t make up stuff. Market is as neutral as it gets. Clear support 66/67 and clear resistance 70.5 / 72.3
medium-long term: Nope to the nopedy nope. Go follow some macro schmackro dude who tells the world Oil will go to 100$ again because of *insert hypothetical macro event*.
current swing trade: None

We would buy quite a lot of NATGAS when $2 levels are reachedWe hope the price will go down so we can buy cheaper

WTI/OIL Bullish Signal triggered7 days ago my bullish signal for oil triggered and I am now long.Now many new facts are being released that are align with my signals.
I have collected some very important and interpreted them.This will help you also t understand the backrounds. The bullish trend is currently at its weak phase where many false signals are ofcourse potentially possible.
In this phase of the trend I focuse just on risk management(tightenning stops,to breakeven etc.
But also increasing my positions in this phase and sizing them up are also possible.
Later in strong phase of the trend Iwont increase my positions, but I let the profits run.
I marked also Taking profits level for some of you who might are taking profits.
Generally I let the profits run and just cut the losses if necessary.
Important levels I marked in the chart.
Here Important catalysts why I believe Oil will climb up:
1
India Doubles Down on Refining Expansion. India’s state-controlled refiner Bharat Petroleum (NSE:BPCL) announced its plans to invest $11 billion in a new refinery in southern Andhra Pradesh state, adding 180,000 b/d of capacity and an integrated petrochemical plant to meet domestic demand.
France Launches First Reactor of 21st Century. 12 years overdue and four times the originally planned budget with a price tag of €13 billion, the Flamanville 3 nuclear reactor was finally connected to France’s power grid this week, marking the first addition of new nuclear capacity since Civaux-2 in 1999.
👉 Interpretation
France Launches First Reactor of the 21st Century
Key Details:
Flamanville 3 nuclear reactor, costing €13 billion and delayed by 12 years, is now operational.
First new nuclear capacity addition in France since 1999.
Implications for Oil Prices:
Reduced Dependence on Fossil Fuels: As nuclear energy replaces some fossil fuel-generated electricity, demand for oil (particularly fuel oil used for power generation in some regions) could decline slightly in Europe over the long term. However, this effect is minor since most oil demand comes from transportation rather than power generation.
Transition Signals: The operational reactor signals Europe's commitment to energy transition, which may influence long-term sentiment about reduced reliance on fossil fuels.
Neutral Short-Term Impact: Since the reactor serves a domestic market and does not affect global oil supply or demand immediately, the impact on oil prices is negligible in the short term.
India Doubles Down on Refining Expansion
Key Details:
Bharat Petroleum plans a $11 billion investment in a new refinery with a capacity of 180,000 b/d and an integrated petrochemical plant.
Focus is on meeting India’s growing domestic energy demand.
Implications for Oil Prices:
Increased Crude Demand: A new refinery requires crude oil as a feedstock, adding to global oil demand. Once operational, this expansion will support bullish trends in oil prices, especially as India becomes a larger importer of crude.
Focus on Domestic Market: The refinery aims to meet rising domestic consumption, particularly for transportation fuels and petrochemicals, reinforcing India’s growing importance as a driver of oil demand.
Positive Long-Term Outlook: While the refinery won't impact prices immediately, it highlights the bullish long-term demand trajectory for oil in emerging markets like India.
Overall Impact on Oil Prices
Bullish Factors:
India’s refinery expansion indicates long-term growth in oil demand, supporting bullish sentiment.
Emerging markets continue to drive global oil demand, balancing out declines in demand from developed regions.
Neutral or Bearish Factors:
France's new nuclear reactor reflects progress in the energy transition, potentially reducing oil demand in Europe. However, the short-term impact is negligible.
Conclusion
India's refinery expansion supports a bullish outlook for oil prices, complementing bullish signal. While France’s nuclear reactor signals a step toward alternative energy, its impact on global oil demand is minimal and overshadowed by growing energy needs in emerging markets like India. Overall, the developments reinforce a stable to slightly bullish environment for oil prices.
2
Turkey Eyes Maritime Delimitation with Syria. The Turkish government is readying to start negotiations with the new al-Julani government of Syria to delineate maritime boundaries in the Mediterranean Sea, a move that would allow Ankara to ‘increase its area of influence’ in energy exploration.
US to Finance Guyana’s Gas Power Buildout. The US Export-Import Bank approved a $526 million loan to Guyana for the construction of a 300 MW natural gas-fired power plant that would use ExxonMobil’s associated gas production from the Stabroek block, staving off intense Chinese competition.
👉 Interpretation of this news
Here's an analysis of how these developments might influence the oil market Turkey Eyes Maritime Delimitation with Syria
Key Details:
Turkey plans to negotiate maritime boundaries with the new Syrian government led by al-Julani.
The goal is to expand Turkey’s influence in Mediterranean energy exploration.
Implications for Oil Prices:
Energy Exploration Opportunities: If Turkey successfully delineates maritime boundaries, it could lead to new oil and gas exploration activities in the Mediterranean. This would increase the long-term potential for energy supply, but the impact on oil prices would be delayed and dependent on successful discoveries.
Geopolitical Risk Premium: Tensions surrounding maritime boundaries in the Eastern Mediterranean have previously caused geopolitical disputes (e.g., with Greece and Cyprus). The potential for disputes with other nations in the region could add a slight risk premium to oil prices.
No Immediate Impact: Since this development involves negotiations and potential future exploration, it does not have an immediate impact on oil supply or demand.
US to Finance Guyana’s Gas Power Buildout
Key Details:
The US Export-Import Bank approved a $526 million loan for a 300 MW natural gas-fired power plant in Guyana.
The plant will utilize ExxonMobil's associated gas from the Stabroek block, reducing flaring and tapping into a previously unused energy source.
Implications for Oil Prices:
Gas as an Alternative to Oil: Increased natural gas production in Guyana could slightly offset demand for oil in power generation over the long term. However, this is unlikely to significantly impact crude oil demand globally.
US vs. China Competition: The US financing reinforces its influence in Guyana, securing a foothold in the resource-rich region. This limits China's involvement but doesn't directly impact oil prices.
Neutral Impact on Crude Oil: Since this involves natural gas and not oil, the direct impact on crude prices is limited. However, the increased utilization of gas could eventually reduce the flare gas associated with oil production, slightly improving efficiency in Guyana's oil operations.
Overall Impact on Oil Prices
Bullish Factors:
Potential geopolitical disputes from Turkey’s maritime moves could introduce a risk premium into oil prices.
Long-term developments in Guyana's energy infrastructure reinforce stable energy supply, indirectly supporting efficient oil production.
Neutral or Limited Impact:
Both developments are longer-term in nature, with no immediate effect on crude oil supply or demand. The news leans more towards a neutral to slightly bullish influence on oil prices. Turkey’s maritime delimitation talks could introduce some geopolitical uncertainty in the Mediterranean, which may support a minor risk premium. However, neither of these developments directly counters or strongly amplifies your bullish oil signal, which remains supported by other recent market-moving news (e.g., Suez disruptions, Shell refinery shutdown).
3
Shell Shuts Singapore Refinery After Leak. UK-based energy major Shell (LON:SHEL) shut down one of its oil processing units at the 237,000 b/d Pulau Bukom refinery in Singapore after the nation’s Port Authority reported a leak of oil products together with the cooling water discharge.
Mongolia Walks Back France Uranium Deal. The government of Mongolia has retracted the announcement of reaching a $1.6 billion deal with France’s uranium mining giant Orano, marking another odd roadblock on the way towards launching the Zuuvch Ovoo mine, in development since 2013.
👉I nterpretation of this oil trading news:
Here’s how these developments could impact the oil market and your bullish signal on oil prices:
Shell Shuts Singapore Refinery After Leak
Key Details:
Shell has shut down an oil processing unit at the Pulau Bukom refinery (237,000 barrels per day capacity).
The shutdown was caused by a leak reported alongside cooling water discharge.
Implications for Oil Prices:
Tightened Refining Capacity: With one of Asia’s major refining facilities partially offline, there will be reduced supply of refined products like gasoline, diesel, and jet fuel in the region. This could support higher refined product prices, indirectly boosting crude oil demand as refineries aim to maintain supply levels.
Short-Term Supply Disruption: Depending on the duration of the shutdown, the disruption could lead to localized supply shortages and increased imports to meet demand, which is bullish for oil prices.
Environmental and Regulatory Fallout: If the shutdown is prolonged due to environmental regulations or extensive repairs, the market could factor in sustained supply tightness.
2. Mongolia Walks Back France Uranium Deal
Key Details:
Mongolia has retracted its announcement of a $1.6 billion deal with France’s Orano for developing the Zuuvch Ovoo uranium mine.
The project, in development since 2013, faces yet another delay.
Implications for Oil Prices:
Energy Diversification Delays: Delays in uranium mining projects hinder the global transition to nuclear energy, which is seen as a long-term competitor to oil and gas. This keeps oil demand relatively higher in the medium term.
Market Sentiment: Although this news doesn't directly affect oil supply or demand in the short term, it underscores uncertainties in alternative energy projects, potentially reinforcing the importance of fossil fuels for global energy security.
Overall Impact on Oil Prices
Bullish Factors:
The Shell refinery shutdown could tighten regional supply and indirectly boost crude oil demand to support refining operations.
Mongolia's uranium deal setback highlights delays in alternative energy development, indirectly supporting continued oil reliance.
Neutral or Limited Impact:
The uranium deal issue has no immediate bearing on oil markets but contributes to long-term energy security discussions.
Conclusion
The Shell refinery shutdown aligns well with bullish signal, as it adds a layer of supply disruption to the oil market. While the Mongolia news has less immediate impact, it reflects ongoing challenges in energy diversification, subtly reinforcing oil's role in the energy mix. Together, these developments lean towards a supportive outlook for higher oil prices in the short term.
4
All these news matter:
While we got early bullish signals during the last days,now more news are released.Houthi Warfare Drains Egypt Suez Revenue. Egypt reported that its Suez Canal revenues have plunged by 60% year-over-year in 2024 as Houthi maritime warfare cost the North African country at least $7 billion, worsening Cairo’s plight as the Egyptian pound slid to a record low over the past month.
Libya’s Two Governments to End Fuel Subsidies. Libya’s Benghazi government agreed to a proposal from the rival Tripoli government to end fuel subsidies in the war-torn country, with gasoline prices remaining artificially low at $0.11 per gallon, the second-cheapest in the world.
Interpretation of oil trading news today:
Here’s how the two developments could influence the oil market, particularly in light of your bullish signal on oil prices:
Houthi Warfare Drains Egypt Suez Revenue
Key Details:
Suez Canal revenues are down 60% year-over-year due to Houthi maritime attacks.
Losses of $7 billion exacerbate Egypt’s economic woes amid a record low for the Egyptian pound.
Implications for Oil Prices:
Supply Chain Disruption: The Suez Canal is a critical chokepoint for global oil and gas shipments. If Houthi attacks escalate or disrupt transit, it could delay shipments and increase transportation costs, creating upward pressure on oil prices.
Risk Premium: Geopolitical instability in the region adds a risk premium to oil prices, as traders factor in potential disruptions.
Currency Devaluation Impact: The weakening Egyptian pound might not directly influence oil prices, but it reflects economic instability that could worsen if the Suez remains compromised.
Libya’s Two Governments to End Fuel Subsidies
Key Details:
Rival governments in Libya are cooperating to end fuel subsidies.
Gasoline prices, currently at $0.11 per gallon (among the cheapest globally), are set to rise.
Implications for Oil Prices:
Higher Domestic Costs: Removing subsidies could reduce Libya’s domestic fuel consumption, leaving more oil and refined products for export.
Market Balance: Increased exports from Libya could counteract some supply tightness caused by other factors, potentially capping oil price increases.
Political Stability: This rare cooperation between Libya’s rival governments could indicate improving governance, which might increase Libya’s crude production and exports in the long term. This could have a bearish effect on oil prices if the market views it as a stabilizing factor.
Overall Impact on Oil Prices
Bullish Factors:
Suez Canal disruptions and geopolitical instability add to the risk premium on oil.
Supply chain concerns may tighten market sentiment.
Bearish or Neutralizing Factors:
Libya’s subsidy removal could lead to increased exports, easing supply pressures.
What to Watch For:
Suez Canal Traffic: Any further disruptions or escalations in Houthi maritime warfare could amplify bullish momentum in oil prices.
Libya’s Export Trends: Monitor whether Libya increases its crude oil and product exports following the subsidy removal.
In summary, the Suez Canal situation supports the bullish signal you've received, as it poses a significant risk to global oil logistics. Libya’s subsidy removal might introduce a balancing effect but seems less likely to fully offset the bullish momentum from Middle East instability.
More Tensions in the middle east in 2025 building Under Pressure, Iraq to Cut Gas Flaring. Amidst reports that Donald Trump might sanction Iraq’s imports of Iranian natural gas, Baghdad promised to cut flaring volumes by around 20% next year to meet rising demand, expecting to capture more than 85% of associated natural gas production.
Finland Seizes Suspicious Russian Tanker. Finland’s coast guard has boarded and seized the Eagle S tanker carrying Russian oil in the Baltic Sea on suspicion of having caused an outage of an undersea electricity cable connecting Finland and Estonia, investigating potential sabotage.
Beijing Issues 2025 Product Export Quotas. China’s Ministry of Commerce issued the first batch of refined product quotas for next year totaling 19 million tonnes, unchanged year-over-year, with recent changes to the country’s 13% export tax rebate making gasoline and diesel exports sub-commercial.
The news from Beijing about product export quotas and the export tax rebate has several potential implications for the oil market, particularly refined products like gasoline and diesel, which could indirectly influence crude oil prices. Here's a breakdown:
Key Points:
Unchanged Export Quotas (19 Million Tonnes):
The quota is the same as last year, suggesting that China isn't planning a significant increase or decrease in refined product exports.
A stable quota means China's refining capacity and crude oil import needs might not shift drastically in the near term.
Export Tax Rebate Adjustment:
China's 13% export tax rebate on refined products like gasoline and diesel has been adjusted, making exports less profitable or even "sub-commercial" (not economically viable).
This discourages the export of refined products, potentially keeping more supply within China for domestic consumption.
Implications for Oil Prices:
Domestic Market Focus:
If China prioritizes domestic consumption over exports, its domestic demand for crude oil (used to produce refined products) might stay strong. This can be bullish for crude oil prices as China's overall demand remains a key driver.
Global Supply Dynamics:
Reduced exports of gasoline and diesel from China could tighten global supply of these refined products, potentially driving up their prices.
Higher refined product prices could encourage refineries worldwide to increase crude oil processing, boosting crude oil demand.
Market Sentiment:
The market might interpret this as a sign of strong domestic demand in China, which is generally positive for oil prices.
However, if global economic concerns dominate, the muted export quotas might limit the bullish effect.
Oil Price Volatility:
Oil prices could see short-term bullish momentum due to perceived demand strength and tighter refined product supply globally.
Traders might also be cautious, monitoring other factors like global economic data, OPEC+ decisions, and geopolitical tensions.
Conclusion:
This news leans slightly bullish for crude oil, as it signals steady domestic demand in China and potentially tighter global supply for refined products. However, how oil prices react depends on broader market sentiment and other macroeconomic factors. Since you've received a bullish signal on oil, the news could support the signal, but always keep an eye on additional developments and technical confirmations in the market.

WTI OIL Will it hold the 4H MA200 and rebound?WTI Oil (USOIL) almost tested on yesterday's pull-back the 4H MA200 (orange trend-line), following Monday's rebound on the former Lower Highs trend-line. This technical shift from a Resistance level turning Support, signifies the emergence of a new Channel Up pattern, which needs to hold the 4H MA200 in order to materialize the new Bullish Leg to a new Higher High.
The pattern's first Higher High was priced on the 71.45 Resistance (1) and if the current Higher Low holds at the bottom of the Channel Up, we expect an equally powerful Bullish Leg for the next Higher High. However the 1D MA100 (red trend-line) needs to break as it currently poses the strongest Resistance, having rejected the uptrend not just on the Resistance 1 test (December 13) but also yesterday (December 26).
As a result, if this level breaks, we expect the trend to hit at least Resistance 2 with our Target being $72.80.
-------------------------------------------------------------------------------
** Please LIKE 👍, FOLLOW ✅, SHARE 🙌 and COMMENT ✍ if you enjoy this idea! Also share your ideas and charts in the comments section below! This is best way to keep it relevant, support us, keep the content here free and allow the idea to reach as many people as possible. **
-------------------------------------------------------------------------------
💸💸💸💸💸💸
👇 👇 👇 👇 👇 👇

WTI - the fate of oil next year!WTI oil is above the EMA200 and EMA50 in the 4-hour timeframe and is moving in its ascending channel. In case of a downward correction towards the zone, the next purchase of oil will be offered with a reward suitable for us.
Analysts believe that the global oil market will be well-supplied in the coming year due to increased oil production from non-OPEC+ countries and limited growth in global oil demand. Despite uncertainties surrounding 2025, experts maintain a cautious outlook on crude oil prices.
By the end of 2024, investment banks projected that oil prices in 2025 would remain around $70 per barrel of Brent.
However, the potential escalation of trade tensions poses a downside risk to prices.
Market observers are aware that oil price forecasts are often inaccurate. Yet, considering current fundamentals and geopolitical developments, experts generally hold a more negative than positive view on oil prices for the next year.
Most analysts and investment banks anticipate a supply surplus in the oil market for 2025, even if OPEC+ adheres to its current plan to reduce production starting in April 2025.
In December, OPEC+ announced a delay in its planned 2.2 million barrels per day production cut from January to April 2025. Additionally, the group extended the timeline for fully reversing these cuts to September 2026.
According to investment banks, while OPEC+’s decision may reduce the anticipated surplus, the market will still experience oversupply.
ING commodity strategists Warren Patterson and Ewa Manthey noted in a recent report: “For now, we forecast the oil market to face a surplus next year, although much will depend on OPEC+’s production policies.”
The International Energy Agency (IEA) has long predicted a significant supply surplus in 2025. In its monthly report, the IEA stated that even if OPEC+ maintains its current production levels throughout 2025, there would still be a daily surplus of 950,000 barrels. If OPEC+ halts voluntary production cuts at the end of March 2025, this surplus could rise to 1.4 million barrels per day.
The IEA also forecasts that global oil demand will increase by 1.1 million barrels per day next year. However, this growth will not be sufficient to absorb the additional supply from non-OPEC+ producers, primarily the U.S., Brazil, and Guyana.
Additionally, weak consumption data from China indicates that demand this year has been below initial projections. OPEC has also reduced its oil demand growth forecasts for 2024 for five consecutive months.
In its December Short-Term Energy Outlook (STEO), the U.S. Energy Information Administration (EIA) reported that if OPEC+ implements its recent production cut decisions, global oil inventories would rise by an average of 100,000 barrels per day starting in the second quarter of next year.
The EIA further predicted that this inventory increase would exert downward pressure on crude oil prices by late 2025, with Brent prices declining from an average of $74 per barrel in Q1 2025 to $72 per barrel in Q4 2025.
The agency estimates that the average annual Brent oil price in 2025 will be $74 per barrel, down from this year’s average of $80 per barrel. Recent surveys also reflect this trend, as analysts have lowered their oil price forecasts due to weak demand and robust supply growth.
Some experts argue that stricter U.S. sanctions on Iran and heightened geopolitical tensions might support prices early next year. However, overall weak demand forecasts are expected to exert significant downward pressure on oil prices.
China’s accommodative monetary policy could boost its economy and oil demand, but President-elect Trump’s promise to increase tariffs on China poses risks to economic growth, trade, and oil demand. Saxo Bank recently stated that China’s latest economic stimulus measures and the likelihood of further monetary easing could offset the impact of U.S. tariffs in 2025, signaling Beijing’s determination to prevent a severe economic downturn.
Post-Christmas Crude Oil AnalysisHere is an analysis on why I think the crude oil is going downtown, at least in the 'short-term'.
Let me know what your outlook is for this asset!
- R2F
