WTI Oil H4 | Potential bullish breakoutWTI oil (USOIL) is rising towards a potential breakout level and could climb higher from here.
Buy entry is at 75.11 which is a potential breakout level.
Stop loss is at 72.75 which is a level that lies underneath a pullback support.
Take profit is at 78.62 which is an overlap resistance that aligns close to the 78.6% Fibonacci projection level.
High Risk Investment Warning
Trading Forex/CFDs on margin carries a high level of risk and may not be suitable for all investors. Leverage can work against you.
Stratos Markets Limited (www.fxcm.com):
CFDs are complex instruments and come with a high risk of losing money rapidly due to leverage. 62% of retail investor accounts lose money when trading CFDs with this provider. You should consider whether you understand how CFDs work and whether you can afford to take the high risk of losing your money.
Stratos Europe Ltd (www.fxcm.com):
CFDs are complex instruments and come with a high risk of losing money rapidly due to leverage. 59% of retail investor accounts lose money when trading CFDs with this provider. You should consider whether you understand how CFDs work and whether you can afford to take the high risk of losing your money.
Stratos Trading Pty. Limited (www.fxcm.com):
Trading FX/CFDs carries significant risks. FXCM AU (AFSL 309763), please read the Financial Services Guide, Product Disclosure Statement, Target Market Determination and Terms of Business at www.fxcm.com
Stratos Global LLC (www.fxcm.com):
Losses can exceed deposits.
Please be advised that the information presented on TradingView is provided to FXCM (‘Company’, ‘we’) by a third-party provider (‘TFA Global Pte Ltd’). Please be reminded that you are solely responsible for the trading decisions on your account. There is a very high degree of risk involved in trading. Any information and/or content is intended entirely for research, educational and informational purposes only and does not constitute investment or consultation advice or investment strategy. The information is not tailored to the investment needs of any specific person and therefore does not involve a consideration of any of the investment objectives, financial situation or needs of any viewer that may receive it. Kindly also note that past performance is not a reliable indicator of future results. Actual results may differ materially from those anticipated in forward-looking or past performance statements. We assume no liability as to the accuracy or completeness of any of the information and/or content provided herein and the Company cannot be held responsible for any omission, mistake nor for any loss or damage including without limitation to any loss of profit which may arise from reliance on any information supplied by TFA Global Pte Ltd.
The speaker(s) is neither an employee, agent nor representative of FXCM and is therefore acting independently. The opinions given are their own, constitute general market commentary, and do not constitute the opinion or advice of FXCM or any form of personal or investment advice. FXCM neither endorses nor guarantees offerings of third-party speakers, nor is FXCM responsible for the content, veracity or opinions of third-party speakers, presenters or participants.
WTI

Hellena | Oil (4H): Short to support area at 64.617.Dear colleagues, it seems that the price is in a downward movement and at the moment the price is forming wave “2” of lower order.
I assume that after the formation of wave “2” (72.299), the price will start to form wave “3” of lower order.
The nearest target is the support area at 64.617.
Manage your capital correctly and competently! Only enter trades based on reliable patterns!

$20 Spike if Israel Hits Iran’s Oil? The Israeli military warned that its response to Iran’s missile attack would be “serious and significant,” as Goldman Sachs forecasted that oil prices could surge by $20 per barrel if Iranian production is disrupted.
Daan Struyven, Goldman’s co-head of global commodities research, stated on Friday that a "sustained drop of 1 million barrels per day" in Iranian output could lead to a peak increase of $20 per barrel next year, assuming OPEC+ does not immediately boost production, which typically requires time to implement. However, if key OPEC+ members like Saudi Arabia and the UAE step in to offset some of the supply loss, the price impact could be more moderate—around $10 per barrel, Struyven added.
Goldman did not offer a specific price forecast if Israel were to target Iran's nuclear facilities, a scenario raised after Republican presidential candidate Donald Trump suggested such a strike was appropriate to recent missile activity from Tehran.

WTI OIL📊 #WTIUSD
⏱ TIME: 1H
📝Important oil ranges for this week
⭕️risk: mid
📍The initial buying limit: 72$ and 69.7$

Crude Oil Falls to $70.30 as Market Awaits Possible ReversalOil prices have extended their losses for the second consecutive day, with crude trading around $70.30 per barrel on Wednesday. The decline in oil prices has been largely driven by the potential resolution of a political dispute in Libya, which has temporarily halted exports, along with growing concerns over a slowdown in global demand growth.
Adding to the negative market sentiment, data from the Institute for Supply Management (ISM) indicated that US manufacturing continues to struggle. Although there was a slight improvement in August, with the ISM Manufacturing PMI rising to 47.2 from 46.8 in July, it still fell short of market expectations of 47.5. This marks the 21st contraction in US factory activity over the past 22 months, underscoring the persistent weakness in the manufacturing sector.
From a technical standpoint, oil has entered a strong demand area, where seasonality data suggests a potential increase in volume, hinting at the possibility of a reversal. Additionally, the latest Commitment of Traders (COT) report shows that retail traders are heavily short on oil, further supporting the potential for a rebound. However, it's important to note that commercial traders, often seen as the "smart money," continue to hold lower positions, adding a layer of uncertainty to the reversal outlook.
Moreover, oil prices are facing additional pressure due to the Organization of the Petroleum Exporting Countries and their allies (OPEC+) planning to increase production in the upcoming quarter. This move could weigh on prices, making a sustained recovery less certain.
While there are signs of a possible reversal in oil prices, the data remains inconclusive, and traders should exercise caution as market dynamics evolve.
✅ Please share your thoughts about WTI in the comments section below and HIT LIKE if you appreciate my analysis. Don't forget to FOLLOW ME; you will help us a lot with this small contribution.

WTI Crude Surges After Iran’s Missile Attack, Supply Fears BoostWTI crude oil prices edged higher following news that Iran launched missiles at Israel in a direct attack, sparking fears of potential supply disruptions in the oil-rich Middle East region. The escalation of conflict has heightened concerns about stability in the region, with the risk of a broader war possibly threatening oil production and distribution, sending prices upward.
From a technical perspective, the price movement has played out exactly as predicted in our previous forecast, which can be seen in the following link:
In that analysis, we anticipated a rebound from a key demand area, driven by concerns over geopolitical tensions and possible oil supply disruptions from the conflict. As the situation between Israel and its neighboring countries intensifies, the fear of significant interruptions in oil supply is pushing prices higher.
Looking ahead, the bullish momentum in WTI is expected to continue, possibly driving prices above our initial take profit target. Traders should remain alert for further developments in the region, as any escalation could further fuel the upward pressure on oil prices, potentially leading to even more significant gains in the near term.
In conclusion, WTI prices are on an upward trajectory, fueled by the geopolitical risks stemming from the direct attack on Israel. Our technical forecast of a rebound from the demand zone has been validated, and with the ongoing threat of supply disruptions, the bullish outlook remains strong. Further gains could push WTI prices well beyond our take profit levels if the conflict persists.
✅ Please share your thoughts about Oil in the comments section below and HIT LIKE if you appreciate my analysis. Don't forget to FOLLOW ME; you will help us a lot with this small contribution.

WTI Oil H4 | Potential bearish reversalWTI oil (USOIL) is rising towards an overlap resistance and could potentially reverse off this level to drop lower.
Sell entry is at 74.07 which is an overlap resistance that aligns with the 127.2% Fibonacci extension level.
Stop loss is at 77.10 which is a level that sits above the 161.8% Fibonacci extension level and a swing-high resistance.
Take profit is at 70.06 which is a pullback support.
High Risk Investment Warning
Trading Forex/CFDs on margin carries a high level of risk and may not be suitable for all investors. Leverage can work against you.
Stratos Markets Limited (www.fxcm.com):
CFDs are complex instruments and come with a high risk of losing money rapidly due to leverage. 62% of retail investor accounts lose money when trading CFDs with this provider. You should consider whether you understand how CFDs work and whether you can afford to take the high risk of losing your money.
Stratos Europe Ltd (www.fxcm.com):
CFDs are complex instruments and come with a high risk of losing money rapidly due to leverage. 59% of retail investor accounts lose money when trading CFDs with this provider. You should consider whether you understand how CFDs work and whether you can afford to take the high risk of losing your money.
Stratos Trading Pty. Limited (www.fxcm.com):
Trading FX/CFDs carries significant risks. FXCM AU (AFSL 309763), please read the Financial Services Guide, Product Disclosure Statement, Target Market Determination and Terms of Business at www.fxcm.com
Stratos Global LLC (www.fxcm.com):
Losses can exceed deposits.
Please be advised that the information presented on TradingView is provided to FXCM (‘Company’, ‘we’) by a third-party provider (‘TFA Global Pte Ltd’). Please be reminded that you are solely responsible for the trading decisions on your account. There is a very high degree of risk involved in trading. Any information and/or content is intended entirely for research, educational and informational purposes only and does not constitute investment or consultation advice or investment strategy. The information is not tailored to the investment needs of any specific person and therefore does not involve a consideration of any of the investment objectives, financial situation or needs of any viewer that may receive it. Kindly also note that past performance is not a reliable indicator of future results. Actual results may differ materially from those anticipated in forward-looking or past performance statements. We assume no liability as to the accuracy or completeness of any of the information and/or content provided herein and the Company cannot be held responsible for any omission, mistake nor for any loss or damage including without limitation to any loss of profit which may arise from reliance on any information supplied by TFA Global Pte Ltd.
The speaker(s) is neither an employee, agent nor representative of FXCM and is therefore acting independently. The opinions given are their own, constitute general market commentary, and do not constitute the opinion or advice of FXCM or any form of personal or investment advice. FXCM neither endorses nor guarantees offerings of third-party speakers, nor is FXCM responsible for the content, veracity or opinions of third-party speakers, presenters or participants.

2024-10-03 - priceactiontds - daily update - oilGood Evening and I hope you are well.
tl;dr
oil - Continues to be wild. Got stopped out too many times today and wanted to hurt myself. Huge tails on daily bars above and today a 350 (5%) tick ripper. Bulls just melted through the bear trend line. Can absolutely be a bull trap and we see another giant pullback but for now I would not short it. If anything, I am not touching this for couple of day I think.
comment : Market was very two sided until the spike above 72.20 happened. Market also did not accomplish anything after that spike, which leaves us not that much smarter going into tomorrow. It could very well see a big pullback or even proving to be a bull trap near the bear trend line.
current market cycle : trading range inside big broad bear channel from the daily chart. If bulls continue above 74, it’s likely a new bull trend and could get us to 78.
key levels : 66 - 74
bull case: Bulls let it drop below 67 and still managed to rip 300 ticks higher. Wild times currently. If you are a bull and want to buy this, you need really wide stops or wait for insane pullbacks. Not easy to trade. Bulls want a breakout above the bear trend line and hit 75. Above 75 is most likely no resistance until 77. Since the pullbacks are so deep, I doubt there are many bulls who want to buy 74 in hopes of breaking the trend line but I am open for surprises.
Invalidation is below 70.4.
bear case: Bears have the do or die moment at 74. Defend the bear trend or give up until we hit the next big bear trend line around 78. Given the erratic moves, bears are alive and well, mostly anyway. Anything below 71 would be a huge win for the bears tomorrow. Daily 20 ema is also flat, decreases the chance for the bulls.
Invalidation is above 74.2.
short term: Neutral around 74. Bearish below 73 for 70 again. If bulls can continue above 74.2, we could see more giving up by the bears and another strong move to 76 or 78. Very low probability though.
medium-long term - Update from 2024-09-08: Bears broke below multi month support and want a retest of 64.46 or lower. Right now the selling is a bit too steep to be sustainable. When we get a more complex pullback and form a decent channel, I will write a longer update here. Can this bear trend be the start of a bigger where we see Oil below 50$ again? I have absolutely no idea but the current daily chart can not not lead to that conclusion.
current swing trade: None
trade of the day: Not going there today. You can’t expect this spike. Don’t fool yourself.

WTI: Will Iran drag Saudi into conflict? Israeli officials are considering how to respond after an Iranian missile strike on Wednesday, which caused little damage, but definitely had the potential to do so.
Their next steps could depend on the U.S. stance. President Joe Biden reaffirmed U.S. support for Israel but made it clear on Wednesday that he would not support Israeli strikes on Iran’s nuclear sites.
Oil prices have already jumped 5% after Biden mentioned discussions about possible Israeli strikes on Iran’s oil industry. Iran, the world’s seventh-largest oil producer, exports about half of its oil, mainly to China.
If tensions escalate into a broader conflict, Iran it is expected to draw Israel’s regional allies, including Saudi Arabia (an even larger oil producer than Iran) and Jordan, into the confrontation.

WTI Oil H4 | Rising into resistanceWTI oil (USOIL) is rising towards a swing-high resistance and could potentially reverse off this level to drop lower.
Sell entry is at 72.15 which is a swing-high resistance that aligns close to the 61.8% Fibonacci retracement.
Stop loss is at 74.58 which is a level that sits above an overlap resistance.
Take profit is at 68.63 which is an overlap support.
High Risk Investment Warning
Trading Forex/CFDs on margin carries a high level of risk and may not be suitable for all investors. Leverage can work against you.
Stratos Markets Limited (www.fxcm.com):
CFDs are complex instruments and come with a high risk of losing money rapidly due to leverage. 62% of retail investor accounts lose money when trading CFDs with this provider. You should consider whether you understand how CFDs work and whether you can afford to take the high risk of losing your money.
Stratos Europe Ltd (www.fxcm.com):
CFDs are complex instruments and come with a high risk of losing money rapidly due to leverage. 59% of retail investor accounts lose money when trading CFDs with this provider. You should consider whether you understand how CFDs work and whether you can afford to take the high risk of losing your money.
Stratos Trading Pty. Limited (www.fxcm.com):
Trading FX/CFDs carries significant risks. FXCM AU (AFSL 309763), please read the Financial Services Guide, Product Disclosure Statement, Target Market Determination and Terms of Business at www.fxcm.com
Stratos Global LLC (www.fxcm.com):
Losses can exceed deposits.
Please be advised that the information presented on TradingView is provided to FXCM (‘Company’, ‘we’) by a third-party provider (‘TFA Global Pte Ltd’). Please be reminded that you are solely responsible for the trading decisions on your account. There is a very high degree of risk involved in trading. Any information and/or content is intended entirely for research, educational and informational purposes only and does not constitute investment or consultation advice or investment strategy. The information is not tailored to the investment needs of any specific person and therefore does not involve a consideration of any of the investment objectives, financial situation or needs of any viewer that may receive it. Kindly also note that past performance is not a reliable indicator of future results. Actual results may differ materially from those anticipated in forward-looking or past performance statements. We assume no liability as to the accuracy or completeness of any of the information and/or content provided herein and the Company cannot be held responsible for any omission, mistake nor for any loss or damage including without limitation to any loss of profit which may arise from reliance on any information supplied by TFA Global Pte Ltd.
The speaker(s) is neither an employee, agent nor representative of FXCM and is therefore acting independently. The opinions given are their own, constitute general market commentary, and do not constitute the opinion or advice of FXCM or any form of personal or investment advice. FXCM neither endorses nor guarantees offerings of third-party speakers, nor is FXCM responsible for the content, veracity or opinions of third-party speakers, presenters or participants.

USOIL- at resistance? Holds or not??#USOIL - market just near his resistance area.
Keep close it because if market hold it then again drop expexted.
Don't be lazy here
Good luck
Trade wisely

2024-10-01 - priceactiontds - daily update - oilGood Evening and I hope you are well.
tl;dr
Oil - Bullish outside bar with big tails above and below. Still a strong day by the bulls but they could not get above last weeks high 72.39 which shows they are not that strong. 50% pb is around 68 so market is neutral there. We are at 70 and I expect it to be bigger resistance. Bulls want 73 to test the upper bear trend line.
comment: Bull spike was big enough to expect a second leg. Bears tested the lows enough from a technical perspective and I do think the pain trade is up. One measured move target is 74, which would be around the upper bear trend line and that is my preferred target for the bulls as of now.
current market cycle: trading range inside big broad bear channel from the daily chart
key levels : 66 - 74
bull case: Bulls should not let it drop below 68.5. If they keep it above the 1h 20ema, their odds continue to be great for a second leg to 73 or higher. There is a small chance that the pullback already happened to 69.76 and we move higher from here. Will reevaluate tomorrow morning before EU open. Bulls are favored.
Invalidation is below 69.5.
bear case: Bears need to keep it a lower high below 72.4 or market will likely move to 73/74 with force. The 71.5 price is roughly the 50% pullback for the last bear leg and market continues to find sellers in that area. As long as that is the case, we will likely continue sideways between 66 - 72.
Invalidation is above 72.4.
short term: Bullish above 69.5, expecting a second leg up.
medium-long term - Update from 2024-09-08 : Bears broke below multi month support and want a retest of 64.46 or lower. Right now the selling is a bit too steep to be sustainable. When we get a more complex pullback and form a decent channel, I will write a longer update here. Can this bear trend be the start of a bigger where we see Oil below 50$ again? I have absolutely no idea but the current daily chart can not not lead to that conclusion.
current swing trade: None
trade of the day: 67 was previous support and market got to 66.32 before we got a decent pullback. Could you have anticipated the spike? Maybe. The buying below 67 was strong enough to expect a second leg up and maybe retest 68. I’m happy for everyone who caught it.

CRUDE OIL Will Hit Resistance Soon! Sell!
Hello,Traders!
CRUDE OIL keeps growing
And the price will soon
Hit a horizontal resistance
Of 72.00$ from where
A local bearish correction
Is to be expected
Sell!
Like, comment and subscribe to help us grow!
Check out other forecasts below too!

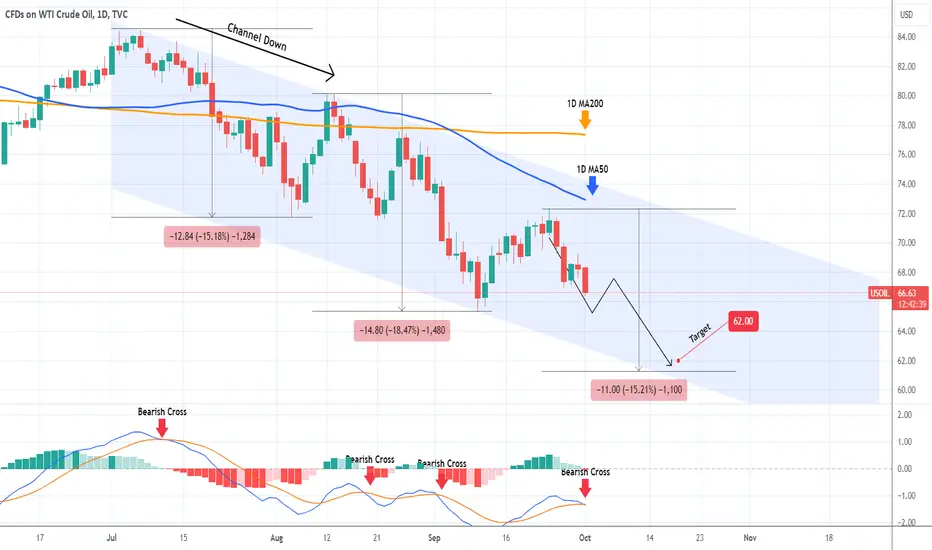
WTI OIL Channel Down prevailed. Lower Low expected.WTI Oil (USOIL) eventually failed to recover the 1D MA50 (blue trend-line), which has been the Resistance since August 13, and reversed the short-term rebound. The 3-month Channel Down appears to have prevailed and technically is now looking for its third Lower Low.
The previous two declined by -18.47% and -15.18% respectively, so roughly we same % drop. As the 1D MACD formed a Bearish Cross today, we can claim that we have the necessary confirmation for a Bearish Leg that at best, we are half-way on it.
Assuming the minimum drop of -15.18%, we expect to see at least $62.00 before this Leg prices the Lower Low.
-------------------------------------------------------------------------------
** Please LIKE 👍, FOLLOW ✅, SHARE 🙌 and COMMENT ✍ if you enjoy this idea! Also share your ideas and charts in the comments section below! This is best way to keep it relevant, support us, keep the content here free and allow the idea to reach as many people as possible. **
-------------------------------------------------------------------------------
💸💸💸💸💸💸
👇 👇 👇 👇 👇 👇
BRIEFING Week #39 : China RoaringHere's your weekly update ! Brought to you each weekend with years of track-record history..
Don't forget to hit the like/follow button if you feel like this post deserves it ;)
That's the best way to support me and help pushing this content to other users.
Kindly,
Phil

MCL: One-Two Punch Could Lift Crude Oil to Higher GroundNYMEX: Micro WTI Crude Oil Futures ( NYMEX:MCL1! )
On September 18th, the U.S. Federal Reserve cut interest rate by a supersized 50 basis points, ushering a long-awaited monetary easing cycle.
Six days later, on September 24th, China introduced a broad stimulus package to revive its economy. It includes cutting interest rates, reducing bank reserve requirements, supporting the property sector, and injecting liquidity into the stock market. Specifically,
• The People’s Bank of China (PBOC), China’s central bank, cut its 7-day reverse repurchase rate to 1.5% from 1.7%
• The PBOC slashed the reserve requirement ratio of financial institutions by 0.5%
• The PBOC lowered home mortgage downpayment requirements to 15%; previously, those buying houses other than primary residence were required to put down 25%
• Separately, the PBOC would advise banks to lower mortgage interest rate by 0.5%
• The PBOC also announced a new RMB $1 trillion long-term credit facility (equivalent to US$143 billion). It allows financial institutions to use their stocks, bonds and ETF funds as collateral to obtain funding from the PBOC. The use of fund is specifically earmarked for credit lending to publicly traded companies for stock buyback
Each of these policies is a major stimulus measure. Putting together, they have the potential to reshape the economic outlook for China, and for the rest of the world as well.
Following the announcement, Chinese stock markets clocked their best week in 16 years as the CSI 300 rallied 15.7%. Hong Kong’s Hang Seng index recorded a weekly gain of 12.75%. On Friday, the CSI 300 climbed 4.47% to close at 3,703.68, its highest level in a year, while the HSI rose 3.32% to 20,586.94, its highest since February 2023.
On Monday, September 30th, China’s SSE Composite Index rallied 8.06%, closing at 3,336.50. This marks a nine-day winning streak, its best day since September 2008 and its highest point since August 2023.
In 2024, China’s economy has slowed significantly. Last week, China released its industrial profit data for August, which saw a 17.8% plunge year on year. On a year-to-date basis, profits at large industrial firms grew at 0.5% to 4.65 trillion yuan ($663.47 billion) for the first eight months, down from 3.6%.
However, China’s supersized monetary policies could help its economy turn a corner. It is highly expected that China’s Ministry of Finance will follow suit to announce new fiscal stimulus and add more ammunition to fuel economic growth.
Together, the extraordinary measures installed by the Top 2 economies, which account for 40% of global GDP, could help improve the global economy in a meaningful way.
WTI Crude Oil: Higher Demand from Economic Growth
While it is still too early to quantify how much the global economy would benefit from these stimulus measures, we could expect higher industrial output from the government credit extension and the lower business cost of capital. The potential impact could be huge for stocks, bonds, foreign exchange and commodities. Today, my analysis concentrates on crude oil.
The Fed rate cut and China Stimulus package both exceeded market expectations. These are game changers big enough to reverse the declining trend of crude oil prices. Recent escalation of Middle East conflict would only add to the uncertainty of oil supply.
In my opinion, WTI could reclaim the previous levels of $76, $83 and $89, consequently. The expected stimulus from China’s Ministry of Finance and the November 6th FOMC rate cut could support the upward trend if they meet or exceed market expectations.
The recent CFTC Commitment of Traders report confirms a shift to the long positions:
• As of September 24th, total open interest (OI) of WTI futures was 2,242,432 contracts
• Managed Money held 210,469 long and 48,541 short, a 4.3-to-1 ratio
• Compared to the previous week, the long positions increased by 24,734, while the shorts decreased by 3,969 contracts; this shows a bullish view building up
For someone with a bullish view of crude oil, he could establish a long position in NYMEX Micro WTI Crude Oil Futures ( GETTEX:MCL ). The contract has a notional value of 100 barrels. At 1/10 the size of benchmark WTI Crude Oil contracts, Micro WTI futures offer the same robust trading transparency and price discovery with smaller margin requirements. At Friday closing price of $68.63, each November contract (MCLX) is worth $6,863. CME Group requires an initial margin of $596 for each MCL contract, long or short.
Hypothetically, if WTI bounced back to $76.88, its previous high on August 5th, the price increase of $8.25 would produce a gain of $825 (=8.25x100) for a long position.
The risk of buying crude oil is that the follow-up government stimulus packages were less than market expectations, which could undermine the growth forecast. To hedge the downside risk, an experienced trader could consider the use of put options on WTI crude oil futures.
Happy Trading.
Disclaimers
*Trade ideas cited above are for illustration only, as an integral part of a case study to demonstrate the fundamental concepts in risk management under the market scenarios being discussed. They shall not be construed as investment recommendations or advice. Nor are they used to promote any specific products, or services.
CME Real-time Market Data help identify trading set-ups and express my market views. If you have futures in your trading portfolio, you can check out on CME Group data plans available that suit your trading needs www.tradingview.com

OIL Short - Don't Slip On Your Longs BoysHey everybody, so while obviously the media is all about the Israel conflict I think we are still far away from being at the bottom. We just wicked today, on a monday, the friday high, started to show some major rejection signs which gives me the green light for a short "experiment" to finally wick the low weekly and daily levels. Remember boys, the best trades appear when the masses got stop out, not the other way around.

WTI Oil H4 | Falling to 78.6% Fibonacci retracement supportWTI oil (USOIL) is falling towards a swing-low support and could potentially bounce off this level to climb higher.
Buy entry is at 67.14 which is a swing-low support that aligns with the 78.6% Fibonacci retracement level.
Stop loss is at 65.00 which is a level that lies underneath a swing-low support.
Take profit is at 72.15 which is a multi-swing-high resistance that aligns close to the 61.8% Fibonacci retracement level.
High Risk Investment Warning
Trading Forex/CFDs on margin carries a high level of risk and may not be suitable for all investors. Leverage can work against you.
Stratos Markets Limited (www.fxcm.com):
CFDs are complex instruments and come with a high risk of losing money rapidly due to leverage. 62% of retail investor accounts lose money when trading CFDs with this provider. You should consider whether you understand how CFDs work and whether you can afford to take the high risk of losing your money.
Stratos Europe Ltd (www.fxcm.com):
CFDs are complex instruments and come with a high risk of losing money rapidly due to leverage. 59% of retail investor accounts lose money when trading CFDs with this provider. You should consider whether you understand how CFDs work and whether you can afford to take the high risk of losing your money.
Stratos Trading Pty. Limited (www.fxcm.com):
Trading FX/CFDs carries significant risks. FXCM AU (AFSL 309763), please read the Financial Services Guide, Product Disclosure Statement, Target Market Determination and Terms of Business at www.fxcm.com
Stratos Global LLC (www.fxcm.com):
Losses can exceed deposits.
Please be advised that the information presented on TradingView is provided to FXCM (‘Company’, ‘we’) by a third-party provider (‘TFA Global Pte Ltd’). Please be reminded that you are solely responsible for the trading decisions on your account. There is a very high degree of risk involved in trading. Any information and/or content is intended entirely for research, educational and informational purposes only and does not constitute investment or consultation advice or investment strategy. The information is not tailored to the investment needs of any specific person and therefore does not involve a consideration of any of the investment objectives, financial situation or needs of any viewer that may receive it. Kindly also note that past performance is not a reliable indicator of future results. Actual results may differ materially from those anticipated in forward-looking or past performance statements. We assume no liability as to the accuracy or completeness of any of the information and/or content provided herein and the Company cannot be held responsible for any omission, mistake nor for any loss or damage including without limitation to any loss of profit which may arise from reliance on any information supplied by TFA Global Pte Ltd.
The speaker(s) is neither an employee, agent nor representative of FXCM and is therefore acting independently. The opinions given are their own, constitute general market commentary, and do not constitute the opinion or advice of FXCM or any form of personal or investment advice. FXCM neither endorses nor guarantees offerings of third-party speakers, nor is FXCM responsible for the content, veracity or opinions of third-party speakers, presenters or participants.

#202440 - priceactiontds - weekly update - wti crude oil futuresGood Evening and I hope you are well.
tl;dr
wti crude oil: 50% pullback is around 68.20 and we are at 68.18. I favor the bulls that they printed a higher low major trend reversal here and 67 will hold. The pattern on the 1h looks like market is forming a round bottom which could lead to a big cup & handle pattern. If they get above 69 on Monday, I do expect 71.5 quickly after an likely a hit of the bear trend line around 72.5. Below 66.8 bears are favored for retest of 65.
Quote from last week:
comment: Low effort comment last week. Deal with it. Bulls have formed a small pullback bull trend from the 64 low and bears selling below 67 are still trapped. Bears have not gotten one daily bar below the prior bar during the past 8 days. No reason to expect this to change all of a sudden.
comment: Bears finally came around last week and got a decent pullback to the 50% pullback from the recent bull leg. At 68.20 market is in total balance and I can’t be anything but neutral. I do think bulls are slightly favored and the 67 low could very well hold. Above 69 I favor the bulls, below 67 the bears.
current market cycle: bear trend
key levels: 64-74
bull case: Bulls want this to be a higher low major trend reversal and 67 to hold. If they manage that, they can print up to 73 to test the bear trend line starting mid July. As of now, we are at the 50% pb and the pattern does not give you any confirmation. You have to wait for it or trade in the probability with a potentially higher reward if you take the long here. Bulls need to stay above 67 though.
Invalidation is below 67.
bear case: Bears printed decent bear bars Wednesday & Thursday and it’s reasonable to expect more sideways movement because they want to retest 65 or lower. Same argument for the bears as for the bulls, we are at the 50% pb and there is no confirmation for either side. Below 67 bulls could have their stops and would wait for 64/65 before longing this again.
Invalidation is above 69.
outlook last week:
short term: Bullish near the 4h 20ema until it stops working. Take profits at new highs unless bulls show even bigger strength.
→ Last Sunday we traded 71 and now we are at 68.18. 4h ema buy worked on Monday but then it stopped on Wednesday. Meh outlook.
short term: Neutral. Bullish above 69 and bearish below 67.
medium-long term - Update from 2024-09-22: Bears channel is the main pattern right now but bulls are trying to test the upper trend line. There we will see if the bear trend is has another leg down or we move sideways. There is an argument that the spike below 69 was a trap and we continue inside a range 69 - 75/77.
current swing trade: None
chart update: removed broken bull trend lines

USOIL Trading IdeaBased on Simple Technical Analysis ( Trendline + Support & Resistance )
Risk Disclaimer:
Please be advised that I am not telling anyone how to spend or invest their money. Take all of my analysis as my own opinion, as entertainment, and at your own risk. I assume no responsibility or liability for any errors or omissions in the content of this page, and they are for educational purposes only. Any action you take on the information in these analysis is strictly at your own risk. There is a very high degree of risk involved in trading. Past results are not indicative of future returns. Good luck :-)

CRUDE OIL PULLBACK AHEAD|SHORT|
✅CRUDE OIL surged again to retest the resistance of 69.00$
But it is a strong key level
So I think that there is a high chance
That we will see a bearish pullback and a move down
SHORT🔥
✅Like and subscribe to never miss a new idea!✅

CRUDE OIL Risky Short! Sell!
Hello,Traders!
CRUDE OIL is making a
Bullish correction but
Will soon hit a horizontal
Resistance level of 69.00$
From where we will be
Expecting a local
Bearish move down
Sell!
Like, comment and subscribe to help us grow!
Check out other forecasts below too!

WTI Oil H1 | Bearish downtrend to resume?WTI oil (USOIL) is rising towards a pullback resistance and could potentially reverse off this level to drop lower.
Sell entry is at 68.28 which is a pullback resistance that aligns with the 23.6% Fibonacci retracement level.
Stop loss is at 68.90 which is a level that sits above an overlap resistance.
Take profit is at 66.21 which is a swing-low support.
High Risk Investment Warning
Trading Forex/CFDs on margin carries a high level of risk and may not be suitable for all investors. Leverage can work against you.
Stratos Markets Limited (www.fxcm.com):
CFDs are complex instruments and come with a high risk of losing money rapidly due to leverage. 62% of retail investor accounts lose money when trading CFDs with this provider. You should consider whether you understand how CFDs work and whether you can afford to take the high risk of losing your money.
Stratos Europe Ltd (www.fxcm.com):
CFDs are complex instruments and come with a high risk of losing money rapidly due to leverage. 59% of retail investor accounts lose money when trading CFDs with this provider. You should consider whether you understand how CFDs work and whether you can afford to take the high risk of losing your money.
Stratos Trading Pty. Limited (www.fxcm.com):
Trading FX/CFDs carries significant risks. FXCM AU (AFSL 309763), please read the Financial Services Guide, Product Disclosure Statement, Target Market Determination and Terms of Business at www.fxcm.com
Stratos Global LLC (www.fxcm.com):
Losses can exceed deposits.
Please be advised that the information presented on TradingView is provided to FXCM (‘Company’, ‘we’) by a third-party provider (‘TFA Global Pte Ltd’). Please be reminded that you are solely responsible for the trading decisions on your account. There is a very high degree of risk involved in trading. Any information and/or content is intended entirely for research, educational and informational purposes only and does not constitute investment or consultation advice or investment strategy. The information is not tailored to the investment needs of any specific person and therefore does not involve a consideration of any of the investment objectives, financial situation or needs of any viewer that may receive it. Kindly also note that past performance is not a reliable indicator of future results. Actual results may differ materially from those anticipated in forward-looking or past performance statements. We assume no liability as to the accuracy or completeness of any of the information and/or content provided herein and the Company cannot be held responsible for any omission, mistake nor for any loss or damage including without limitation to any loss of profit which may arise from reliance on any information supplied by TFA Global Pte Ltd.
The speaker(s) is neither an employee, agent nor representative of FXCM and is therefore acting independently. The opinions given are their own, constitute general market commentary, and do not constitute the opinion or advice of FXCM or any form of personal or investment advice. FXCM neither endorses nor guarantees offerings of third-party speakers, nor is FXCM responsible for the content, veracity or opinions of third-party speakers, presenters or participants.
