WTI Oil D1 | Falling to multi-swing-low supportWTI oil (USOIL) is falling towards a multi-swing-low support and could potentially bounce off this level to climb higher.
Buy entry is at 71.89 which is a multi-swing-low support that aligns with the 61.8% Fibonacci projection level.
Stop loss is at 68.70 which is a level that lies underneath a swing-low support and the 100.0% Fibonacci projection level.
Take profit is at 76.01 which is a pullback resistance.
High Risk Investment Warning
Trading Forex/CFDs on margin carries a high level of risk and may not be suitable for all investors. Leverage can work against you.
Stratos Markets Limited (www.fxcm.com):
CFDs are complex instruments and come with a high risk of losing money rapidly due to leverage. 62% of retail investor accounts lose money when trading CFDs with this provider. You should consider whether you understand how CFDs work and whether you can afford to take the high risk of losing your money.
Stratos Europe Ltd (www.fxcm.com):
CFDs are complex instruments and come with a high risk of losing money rapidly due to leverage. 59% of retail investor accounts lose money when trading CFDs with this provider. You should consider whether you understand how CFDs work and whether you can afford to take the high risk of losing your money.
Stratos Trading Pty. Limited (www.fxcm.com):
Trading FX/CFDs carries significant risks. FXCM AU (AFSL 309763), please read the Financial Services Guide, Product Disclosure Statement, Target Market Determination and Terms of Business at www.fxcm.com
Stratos Global LLC (www.fxcm.com):
Losses can exceed deposits.
Please be advised that the information presented on TradingView is provided to FXCM (‘Company’, ‘we’) by a third-party provider (‘TFA Global Pte Ltd’). Please be reminded that you are solely responsible for the trading decisions on your account. There is a very high degree of risk involved in trading. Any information and/or content is intended entirely for research, educational and informational purposes only and does not constitute investment or consultation advice or investment strategy. The information is not tailored to the investment needs of any specific person and therefore does not involve a consideration of any of the investment objectives, financial situation or needs of any viewer that may receive it. Kindly also note that past performance is not a reliable indicator of future results. Actual results may differ materially from those anticipated in forward-looking or past performance statements. We assume no liability as to the accuracy or completeness of any of the information and/or content provided herein and the Company cannot be held responsible for any omission, mistake nor for any loss or damage including without limitation to any loss of profit which may arise from reliance on any information supplied by TFA Global Pte Ltd.
The speaker(s) is neither an employee, agent nor representative of FXCM and is therefore acting independently. The opinions given are their own, constitute general market commentary, and do not constitute the opinion or advice of FXCM or any form of personal or investment advice. FXCM neither endorses nor guarantees offerings of third-party speakers, nor is FXCM responsible for the content, veracity or opinions of third-party speakers, presenters or participants.
WTI

USOIL Trading IdeaBased on Simple Technical Analysis ( Trendline + Support & Resistance )
Risk Disclaimer:
Please be advised that I am not telling anyone how to spend or invest their money. Take all of my analysis as my own opinion, as entertainment, and at your own risk. I assume no responsibility or liability for any errors or omissions in the content of this page, and they are for educational purposes only. Any action you take on the information in these analysis is strictly at your own risk. There is a very high degree of risk involved in trading. Past results are not indicative of future returns. Good luck :-)

CRUDE OIL (WTI) Bearish Continuation Next Week
Crude Oil will most likely keep falling next week.
The price violated a key daily horizontal support and closed below that.
We can anticipate a bearish continuation at least to 71.9
❤️Please, support my work with like, thank you!❤️

CRUDE OIL Strong Breakout! Sell!
Hello,Traders!
CRUDE OIL broke the key
Horizontal level of 74.34$
So we are locally bearish
Biased and a further
Move down is to be expected
Sell!
Like, comment and subscribe to help us grow!
Check out other forecasts below too!

Crude oil approaches bullish reversal zoneWeak Chinese demand and hopes for a Middle East peace deal on the downside, OPEC+ production cuts and geopolitical tensions on the topside. It’s amazing how the same narratives get rolled out depending on where the WTI crude price sits within its 2024 range, often reaching their crescendo just before the price turns. I wonder whether we’re about to see the same outcome again.
WTI has fallen heavily over the past week, apparently on hopes for a peace deal in Gaza. That may be reason, and I hope it happens from a humanitarian perspective, but I’ve been around long enough to know narratives are often designed to fit with the prevailing price action. All I know is that the last two occasions WTI has dipped to $72.50 per barrel it’s coincided with a near-term bottom. Sitting at $73.11, the price is not far away again.
I would be reluctant to buy preemptively, but should the price bounce from $72.50, it would make for a decent long setup, allowing for a stop to be placed beneath the February low of $71.44 for protection. Minor levels at $74.60 and $76.94 are two potential targets, $80.30 another considering how much work the price did either side earlier in the year.
DS

CRUDE OIL BEARISH BREAKOUT|SHORT|
✅CRUDE OIL is going down
Now and the price broke the
Key horizontal level of 74.33$
So we are bearish biased now
And we will be expecting a
Further move down
SHORT🔥
✅Like and subscribe to never miss a new idea!✅

Waiting for WTI rebound. H4 30.08.2024 Waiting for WTI rebound
Oil WTI has been flattening with pullbacks all week, which is exhausting. My top-up was knocked out together with the rest of the last buy. Although the total plus came out due to partial fixation. Now the price is back to the key support area, it went down to the buyers' zone 73.34-72.63 and near the specified 1/2 margin. There are no large volumes, which is confusing, but they can make a buyback. Therefore, you should look here for confirmations on your strategy. If pushed the zones below, then the price will go to 71.

CRUDE OIL TO $160? (UPDATE)Oil prices are up currently up 8% so far from our green, supply zone. Despite that we are still at the START OF THE BULL (BUY) RUN. We are nowhere near the top, so diversify your portfolio & take advantage! Huge buying momentum for the market over the past few weeks, showing you the possibility of which way Oil prices are heading.
Buyers still holding strong. GET INTO LONG TERM OIL POSITIONS NOW!

WTI Oil H1 | Potential bearish breakoutWTI oil (USOIL) is looking to make a bearish break below an overlap support and could potentially drop lower from here.
Sell entry is at 74.13 (wait for the 30-min candle to close below this level for confirmation).
Stop loss is at 75.10 which is a level that sits above an overlap resistance.
Take profit is at 72.81 which is a pullback support that aligns with a 78.6% Fibonacci retracement level.
High Risk Investment Warning
Trading Forex/CFDs on margin carries a high level of risk and may not be suitable for all investors. Leverage can work against you.
Stratos Markets Limited (www.fxcm.com):
CFDs are complex instruments and come with a high risk of losing money rapidly due to leverage. 62% of retail investor accounts lose money when trading CFDs with this provider. You should consider whether you understand how CFDs work and whether you can afford to take the high risk of losing your money.
Stratos Europe Ltd (www.fxcm.com):
CFDs are complex instruments and come with a high risk of losing money rapidly due to leverage. 59% of retail investor accounts lose money when trading CFDs with this provider. You should consider whether you understand how CFDs work and whether you can afford to take the high risk of losing your money.
Stratos Trading Pty. Limited (www.fxcm.com):
Trading FX/CFDs carries significant risks. FXCM AU (AFSL 309763), please read the Financial Services Guide, Product Disclosure Statement, Target Market Determination and Terms of Business at www.fxcm.com
Stratos Global LLC (www.fxcm.com):
Losses can exceed deposits.
Please be advised that the information presented on TradingView is provided to FXCM (‘Company’, ‘we’) by a third-party provider (‘TFA Global Pte Ltd’). Please be reminded that you are solely responsible for the trading decisions on your account. There is a very high degree of risk involved in trading. Any information and/or content is intended entirely for research, educational and informational purposes only and does not constitute investment or consultation advice or investment strategy. The information is not tailored to the investment needs of any specific person and therefore does not involve a consideration of any of the investment objectives, financial situation or needs of any viewer that may receive it. Kindly also note that past performance is not a reliable indicator of future results. Actual results may differ materially from those anticipated in forward-looking or past performance statements. We assume no liability as to the accuracy or completeness of any of the information and/or content provided herein and the Company cannot be held responsible for any omission, mistake nor for any loss or damage including without limitation to any loss of profit which may arise from reliance on any information supplied by TFA Global Pte Ltd.
The speaker(s) is neither an employee, agent nor representative of FXCM and is therefore acting independently. The opinions given are their own, constitute general market commentary, and do not constitute the opinion or advice of FXCM or any form of personal or investment advice. FXCM neither endorses nor guarantees offerings of third-party speakers, nor is FXCM responsible for the content, veracity or opinions of third-party speakers, presenters or participants.

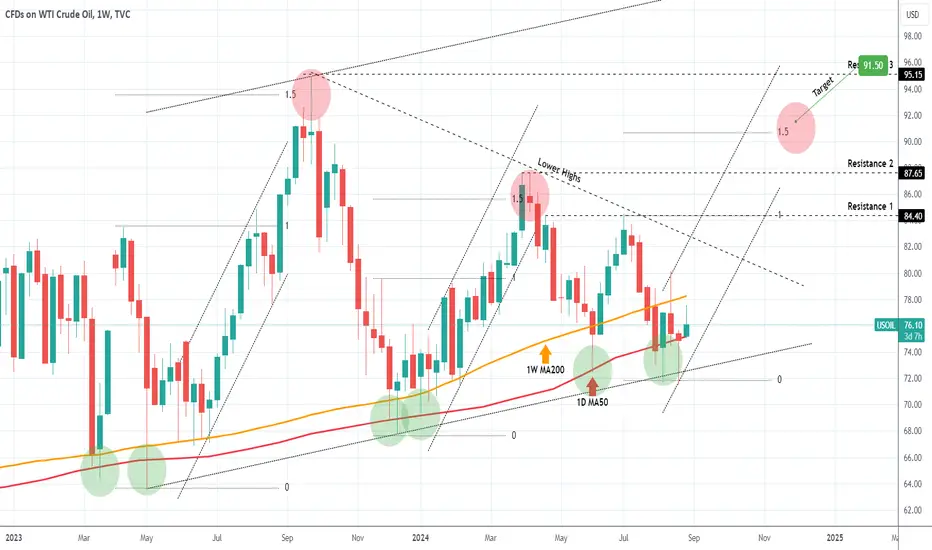
WTI OIL holding the multi-year Support Zone.As mentioned on our last analysis, it is critical for WTI Crude Oil (USOIL) to hold the 1M MA50 (red trend-line) and close the monthly candle (1M) above it. So far it has been holding, the current one is a 1W time-frame chart and as you see even on a weekly basis, all 4 last candles have held the 1M MA50.
At the same time though, the 1W MA200 (orange trend-line) is applying selling pressure for the same time period as a Resistance. If this Zone holds, we still expect a strong rally to start and peak above the 1.5 Fibonacci extension. Our Target Zone is intact at 91.50 - 92.00.
-------------------------------------------------------------------------------
** Please LIKE 👍, FOLLOW ✅, SHARE 🙌 and COMMENT ✍ if you enjoy this idea! Also share your ideas and charts in the comments section below! This is best way to keep it relevant, support us, keep the content here free and allow the idea to reach as many people as possible. **
-------------------------------------------------------------------------------
💸💸💸💸💸💸
👇 👇 👇 👇 👇 👇
Will there be a false breakdown WTI ? H4 20.08.2024Will there be a false breakdown WTI ? H4 20.08.2024
Oil is in an interesting situation right now. Initially I was waiting for repositioning to buy, however the price went lower. As a result, I closed my purchases on be and now the question is whether or not there will be a false breakdown of the support zone 71.30-72.40. The poured volume in the margin at 73.50 did not give a buyback reaction, but oil moves very insidiously. It could do a false breakdown and then come back on volumes and form a delayed culmination. In any case, the rebound is somewhere near, so watch carefully.

Possible correction WTI. H4 27.08.2024Possible correction WTI
Oil has now approached the marginal resistance zone 77.41-77.97,
as shown in the previous analysis.
Large point volumes have appeared in the zone and may mean
fixation of purchases and the beginning of accumulation
of corrective sales.
The question is whether the pullback will be
and how deep it will be.
In general, I expect an approach around 1/2 of the margin
and then up again from there. That's why yesterday at 77.40
I closed 50% of buys and I'm still in the waiting mode.
Oil after filling volumes likes to make
gains and then go into a reversal.

2024-08-26 - priceactiontds - daily update - oilGood Morning and I hope you are well.
tl;dr
Oil - Breakout above happened as written in my weekly update. Only looking for longs now. Want 79 and then 80 before I expect a more complex pullback.
quote from my weekly update:
short term: Bullish above 75.1, bearish below 74 for retest of 72 or lower.
comment : Bulls just continued on Monday and my 75.1 target was easily passed through. That trade was good for 200+, hope you made some. We are now at a minor bear trend line around 77.6 and I’d be surprised if we can just melt through that as well. The 1h ema was not touched once since Thursday’s US session. Very strong move by the bulls and decent chances we see 79 this morning.
current market cycle: trading range (triangle)
key levels: 75 - 79
bull case: Bulls did what I expected in my weekly outlook and their next targets above are 79 and then 80. I do think 80 can happen today or tomorrow. If bulls can break above current August high 78.99, bears will probably step aside enough for 80 to come fast.
Invalidation is below 76.
bear case: Bears did not want to fight this after their leg down and market move’s freely higher without any fight. News weren’t on their side either yesterday. Where could we expect a bigger pullback? 78 is a big maybe. 79/80 is where I expect it more but do not look for any fades until bears closed a bear below the 1h ema. You would be trying to short a strong bull trend and that’s mostly gambling.
Invalidation is above 78.
short term: Bullish for 78 and most likely 79/80 as long as we stay above the 1h 20ema.
medium-long term: We are seeing the big triangle playing out between 72 and 82/84. The high of the triangle got tested until mid of April and we have now tested the lows around 72.5. We are at the bear trend line and odds favor the bears if they stay below 86.27 for trading back down below 76 again. Update: If we break below 70.67, the triangle is dead and we need to find new support. Will update this again when it happens.
current swing trade: None
trade of the day: Longing the breakout above 75.1 as I wrote in my weekly update. Was good for 200+.

USOil WTI Technical Analysis and Trade IdeaThe current USOil chart exhibits clear signs of price overextension, with the asset pushing into a critical resistance zone. Given this technical setup, a retracement appears probable. My strategy involves seeking a long entry, but only if the price experiences a pullback to the key Fibonacci retracement levels, specifically targeting the 50% to 61.8% zone.
It's crucial to contextualize this analysis within the broader macroeconomic landscape. The recent Bank of Japan rate hike has injected significant volatility into global markets. We must anticipate and account for potential continuation of these heightened volatility conditions, as they could materially impact price action and risk management parameters.
This technical and fundamental confluence presents a compelling setup, but as always, proper risk management is paramount. Traders should conduct their own due diligence and consider their individual risk tolerance before executing any positions.
Disclaimer: This analysis is provided for educational and informational purposes only. It does not constitute financial advice or a recommendation to enter any specific trade.

Can USOIL, which has surged due to geopolitical concerns, contin
Due to the expanding armed conflict between Israel and Hezbollah, supply instability has surged in the crude oil market. Oil prices shot up by 3% in a single day due to temporary halts in oil production caused by political risks in Libya.
While geopolitical risks have not significantly impacted oil prices in recent weeks, escalating tensions will likely influence future movements. In particular, the suspension of oil production in Libya, a major exporter of about 1 million barrels per day, could substantially impact the oil market.
USOIL has experienced a significant surge, breaking through the 76.50 level. Additionally, the EMA21 is about to golden-cross the EMA78, indicating a strong bullish signal. In addition, the formation of a double-bottom pattern clearly shows a positive future price outlook for USOIL.
If USOIL continues its current uptrend and breaks the 77.50 resistance, the price may gain upward momentum toward the 79.00 level. Conversely, if USOIL breaks the 75.00 threshold, the price could fall further toward the 74.20 support level.

USOIL H4 | Potential bearish reversal at 61.8% FibonacciWTI oil (USOIL) is rising towards an overlap resistance and could potentially reverse off this level to drop lower.
Sell entry is at 76.80 which is an overlap resistance that aligns with the 61.8% Fibonacci retracement level.
Stop loss is at 78.80 which is a level that sits above the 78.6% Fibonacci retracement level and a pullback resistance.
Take profit is at 73.50 which is a pullback support.
High Risk Investment Warning
Trading Forex/CFDs on margin carries a high level of risk and may not be suitable for all investors. Leverage can work against you.
Stratos Markets Limited (www.fxcm.com):
CFDs are complex instruments and come with a high risk of losing money rapidly due to leverage. 68% of retail investor accounts lose money when trading CFDs with this provider. You should consider whether you understand how CFDs work and whether you can afford to take the high risk of losing your money.
Stratos Europe Ltd, previously FXCM EU Ltd (www.fxcm.com):
CFDs are complex instruments and come with a high risk of losing money rapidly due to leverage. 73% of retail investor accounts lose money when trading CFDs with this provider. You should consider whether you understand how CFDs work and whether you can afford to take the high risk of losing your money.
Stratos Trading Pty. Limited (www.fxcm.com):
Trading FX/CFDs carries significant risks. FXCM AU (AFSL 309763), please read the Financial Services Guide, Product Disclosure Statement, Target Market Determination and Terms of Business at www.fxcm.com
Stratos Global LLC (www.fxcm.com):
Losses can exceed deposits.
Please be advised that the information presented on TradingView is provided to FXCM (‘Company’, ‘we’) by a third-party provider (‘TFA Global Pte Ltd’). Please be reminded that you are solely responsible for the trading decisions on your account. There is a very high degree of risk involved in trading. Any information and/or content is intended entirely for research, educational and informational purposes only and does not constitute investment or consultation advice or investment strategy. The information is not tailored to the investment needs of any specific person and therefore does not involve a consideration of any of the investment objectives, financial situation or needs of any viewer that may receive it. Kindly also note that past performance is not a reliable indicator of future results. Actual results may differ materially from those anticipated in forward-looking or past performance statements. We assume no liability as to the accuracy or completeness of any of the information and/or content provided herein and the Company cannot be held responsible for any omission, mistake nor for any loss or damage including without limitation to any loss of profit which may arise from reliance on any information supplied by TFA Global Pte Ltd.
The speaker(s) is neither an employee, agent nor representative of FXCM and is therefore acting independently. The opinions given are their own, constitute general market commentary, and do not constitute the opinion or advice of FXCM or any form of personal or investment advice. FXCM neither endorses nor guarantees offerings of third-party speakers, nor is FXCM responsible for the content, veracity or opinions of third-party speakers, presenters or participants.

#202435 - priceactiontds - weekly update - wti crude oilGood Evening and I hope you are well.
tl;dr
wti crude oil: Bears answered last weeks question on Monday but bulls kept the market two sided and bears gave up at the double bottom below 72. Bulls are creating decent bull bars again and last time they did this we went above 78. Above 75 odds favor the bulls for more upside to at least 77 but we are still low enough for bears to come around and test 72 again. Leaning bullish if market stays above 74.
Quote from last week:
comment : Bull and bear legs alike get shorter, market is contracting further. Triangle is valid since 2022. We are in the last weeks of it. If we get a huge event where we see Oil prices skyrocketing over the next 3-4 months, you read it here first. Play the range is the name of the game.
current market cycle: trading range (triangle)
key levels: 70-80
bull case: Bulls printed a nice double bottom around 71 and are on their way up again. They want at least 77.5 and test the minor bear trend line starting from 2024-07-18. The last two reversal from prices below 72 both went without any pullback on the daily chart so I expect this one to just go up as well. No side is currently fighting the other too much.
Invalidation is below 75.
bear case: Bears got their early move below 74 and just went for 72 again. No bigger fight for 72 so bulls are doing the reversal again. There is a low chance that bears come around and want to keep it below the daily ema at 75 but i doubt it. If they do, best they can hope for is a test of 71.5 again. Above 75.1 I expect an easy and fast trade up to at least 77.
Invalidation is above 75.1.
outlook last week:
short term: Neutral. Again. What can you do.
→ Last Sunday we traded 75.54 and now we are at 74.83. Low of the week was 71.47 and my target was 71/72. Hope you made some.
short term: Bullish above 75.1, bearish below 74 for retest of 72 or lower.
medium-long term: We are seeing the big triangle playing out between 70 and 80. No more updates until market makes higher highs or lower lows again.
current swing trade: None
chart update: None

BRIEFING Week #34: Crazy Monthly CandleHere's your weekly update ! Brought to you each weekend with years of track-record history..
Don't forget to hit the like/follow button if you feel like this post deserves it ;)
That's the best way to support me and help pushing this content to other users.
Kindly,
Phil

WTI - Short Trade IdeaThis is a short trade idea that fades the recent expansion upwards.
I did an analysis all the way from the yearly timeframe down to the daily, and all arrows still point lower. WTI came into a yearly BISI, which is generally a big deal, but I have a feeling (also based on analysis) that we will come lower into a 6-month BISI and take out the ascending SSL below. The inefficiencies on the daily timeframes are also indicating a move lower. However, caution will be expressed in observing the creation of bullish PD Arrays on the way to my short POI.
If price continues up from my short POI and closes candles above on the daily, then we may be looking at higher prices first. USDCAD, which is negatively correlated with WTI to a high degree, has some a large double top on the higher timeframe overview. This would coincide with a move lower on WTI. That being said as a USD pair, how much of a recovery can we expect on the US Dollar is this happens?
- R2F

Copper & Oil : Are commodities about to surge? Copper is showing great pattern consolidation.
it appears to be putting in a daily bull flag pattern that looks poised to breakout.
If copper follows some of the other recent price action in the commodity space it makes it even more likely to surge.,
You're seeing #gold #uranium #oil and other all performing well.
Will this dampen and slow down the dis inflation expectations? Perhaps.
I am long SCCO with members and have already secured some profits today with members.
I do think there is more strength to come in copper.

WTI Oil H1 | Rising into pullback resistanceWTI oil (USOIL) is rising towards a pullback resistance and could potentially reverse off this level to drop lower.
Sell entry is at 73.66 which is a pullback resistance that aligns with the 23.6% Fibonacci retracement level.
Stop loss is at 74.55 which is a level that sits above an overlap resistance.
Take profit is at 71.52 which is a pullback support.
High Risk Investment Warning
Trading Forex/CFDs on margin carries a high level of risk and may not be suitable for all investors. Leverage can work against you.
Stratos Markets Limited (www.fxcm.com):
CFDs are complex instruments and come with a high risk of losing money rapidly due to leverage. 68% of retail investor accounts lose money when trading CFDs with this provider. You should consider whether you understand how CFDs work and whether you can afford to take the high risk of losing your money.
Stratos Europe Ltd, previously FXCM EU Ltd (www.fxcm.com):
CFDs are complex instruments and come with a high risk of losing money rapidly due to leverage. 73% of retail investor accounts lose money when trading CFDs with this provider. You should consider whether you understand how CFDs work and whether you can afford to take the high risk of losing your money.
Stratos Trading Pty. Limited (www.fxcm.com):
Trading FX/CFDs carries significant risks. FXCM AU (AFSL 309763), please read the Financial Services Guide, Product Disclosure Statement, Target Market Determination and Terms of Business at www.fxcm.com
Stratos Global LLC (www.fxcm.com):
Losses can exceed deposits.
Please be advised that the information presented on TradingView is provided to FXCM (‘Company’, ‘we’) by a third-party provider (‘TFA Global Pte Ltd’). Please be reminded that you are solely responsible for the trading decisions on your account. There is a very high degree of risk involved in trading. Any information and/or content is intended entirely for research, educational and informational purposes only and does not constitute investment or consultation advice or investment strategy. The information is not tailored to the investment needs of any specific person and therefore does not involve a consideration of any of the investment objectives, financial situation or needs of any viewer that may receive it. Kindly also note that past performance is not a reliable indicator of future results. Actual results may differ materially from those anticipated in forward-looking or past performance statements. We assume no liability as to the accuracy or completeness of any of the information and/or content provided herein and the Company cannot be held responsible for any omission, mistake nor for any loss or damage including without limitation to any loss of profit which may arise from reliance on any information supplied by TFA Global Pte Ltd.
The speaker(s) is neither an employee, agent nor representative of FXCM and is therefore acting independently. The opinions given are their own, constitute general market commentary, and do not constitute the opinion or advice of FXCM or any form of personal or investment advice. FXCM neither endorses nor guarantees offerings of third-party speakers, nor is FXCM responsible for the content, veracity or opinions of third-party speakers, presenters or participants.

WTI Oil H1 | Rising into overlap resistanceWTI oil (USOIL) is rising towards an overlap resistance and could potentially reverse off this level to drop lower.
Sell entry is at 74.24 which is an overlap resistance that aligns with the 23.6% Fibonacci retracement level.
Stop loss is at 75.00 which is a level that sits above a pullback resistance.
Take profit is at 72.18 which is a pullback support.
High Risk Investment Warning
Trading Forex/CFDs on margin carries a high level of risk and may not be suitable for all investors. Leverage can work against you.
Stratos Markets Limited (www.fxcm.com):
CFDs are complex instruments and come with a high risk of losing money rapidly due to leverage. 68% of retail investor accounts lose money when trading CFDs with this provider. You should consider whether you understand how CFDs work and whether you can afford to take the high risk of losing your money.
Stratos Europe Ltd, previously FXCM EU Ltd (www.fxcm.com):
CFDs are complex instruments and come with a high risk of losing money rapidly due to leverage. 73% of retail investor accounts lose money when trading CFDs with this provider. You should consider whether you understand how CFDs work and whether you can afford to take the high risk of losing your money.
Stratos Trading Pty. Limited (www.fxcm.com):
Trading FX/CFDs carries significant risks. FXCM AU (AFSL 309763), please read the Financial Services Guide, Product Disclosure Statement, Target Market Determination and Terms of Business at www.fxcm.com
Stratos Global LLC (www.fxcm.com):
Losses can exceed deposits.
Please be advised that the information presented on TradingView is provided to FXCM (‘Company’, ‘we’) by a third-party provider (‘TFA Global Pte Ltd’). Please be reminded that you are solely responsible for the trading decisions on your account. There is a very high degree of risk involved in trading. Any information and/or content is intended entirely for research, educational and informational purposes only and does not constitute investment or consultation advice or investment strategy. The information is not tailored to the investment needs of any specific person and therefore does not involve a consideration of any of the investment objectives, financial situation or needs of any viewer that may receive it. Kindly also note that past performance is not a reliable indicator of future results. Actual results may differ materially from those anticipated in forward-looking or past performance statements. We assume no liability as to the accuracy or completeness of any of the information and/or content provided herein and the Company cannot be held responsible for any omission, mistake nor for any loss or damage including without limitation to any loss of profit which may arise from reliance on any information supplied by TFA Global Pte Ltd.
The speaker(s) is neither an employee, agent nor representative of FXCM and is therefore acting independently. The opinions given are their own, constitute general market commentary, and do not constitute the opinion or advice of FXCM or any form of personal or investment advice. FXCM neither endorses nor guarantees offerings of third-party speakers, nor is FXCM responsible for the content, veracity or opinions of third-party speakers, presenters or participants.

CRUDE OIL Support Ahead! Buy!
Hello,Traders!
CRUDE OIL keeps falling
But a strong horizontal
Support level is ahead
At 71.75$ and after
The retest a local bullish
Correction will be expected
Sell!
Like, comment and subscribe to help us grow!
Check out other forecasts below too!

WTI Oil H1 | Potential bearish breakoutWTI oil (USOIL) is falling towards a potential breakout level and could drop lower from here.
Sell entry is at 72.81 which is a potential breakout level.
Stop loss is at 73.50 which is a level that sits above an overlap resistance.
Take profit is at 71.65 which is a swing-low support.
High Risk Investment Warning
Trading Forex/CFDs on margin carries a high level of risk and may not be suitable for all investors. Leverage can work against you.
Stratos Markets Limited (www.fxcm.com):
CFDs are complex instruments and come with a high risk of losing money rapidly due to leverage. 68% of retail investor accounts lose money when trading CFDs with this provider. You should consider whether you understand how CFDs work and whether you can afford to take the high risk of losing your money.
Stratos Europe Ltd, previously FXCM EU Ltd (www.fxcm.com):
CFDs are complex instruments and come with a high risk of losing money rapidly due to leverage. 73% of retail investor accounts lose money when trading CFDs with this provider. You should consider whether you understand how CFDs work and whether you can afford to take the high risk of losing your money.
Stratos Trading Pty. Limited (www.fxcm.com):
Trading FX/CFDs carries significant risks. FXCM AU (AFSL 309763), please read the Financial Services Guide, Product Disclosure Statement, Target Market Determination and Terms of Business at www.fxcm.com
Stratos Global LLC (www.fxcm.com):
Losses can exceed deposits.
Please be advised that the information presented on TradingView is provided to FXCM (‘Company’, ‘we’) by a third-party provider (‘TFA Global Pte Ltd’). Please be reminded that you are solely responsible for the trading decisions on your account. There is a very high degree of risk involved in trading. Any information and/or content is intended entirely for research, educational and informational purposes only and does not constitute investment or consultation advice or investment strategy. The information is not tailored to the investment needs of any specific person and therefore does not involve a consideration of any of the investment objectives, financial situation or needs of any viewer that may receive it. Kindly also note that past performance is not a reliable indicator of future results. Actual results may differ materially from those anticipated in forward-looking or past performance statements. We assume no liability as to the accuracy or completeness of any of the information and/or content provided herein and the Company cannot be held responsible for any omission, mistake nor for any loss or damage including without limitation to any loss of profit which may arise from reliance on any information supplied by TFA Global Pte Ltd.
The speaker(s) is neither an employee, agent nor representative of FXCM and is therefore acting independently. The opinions given are their own, constitute general market commentary, and do not constitute the opinion or advice of FXCM or any form of personal or investment advice. FXCM neither endorses nor guarantees offerings of third-party speakers, nor is FXCM responsible for the content, veracity or opinions of third-party speakers, presenters or participants.
