Trump’s “ambiguous” statement, where will oil prices go?
💡Message Strategy
Trump's remarks are repeated, and the geopolitical premium still limits the downward space of oil prices
Trump said that the United States "may or may not" join Israel's actions against Iran. Analysts pointed out that if the United States is officially involved in the conflict, oil prices may rise by $5; if peace talks are launched, they may fall by the same amount.
The geopolitical focus is still on the Strait of Hormuz
Iran produces 3.3 million barrels of oil per day, but more importantly, about 19 million barrels of crude oil are transported through the Strait of Hormuz. The escalation of the conflict may threaten the safety of the waterway.
The Fed's policy turn to dovish failed to effectively support oil prices
Although the Fed hinted that it may cut interest rates twice this year, Chairman Powell emphasized that the decision still depends on inflation data, and Trump's upcoming new round of import tariffs may push up prices and limit the boost in oil demand brought about by loose policies.
📊Technical aspects
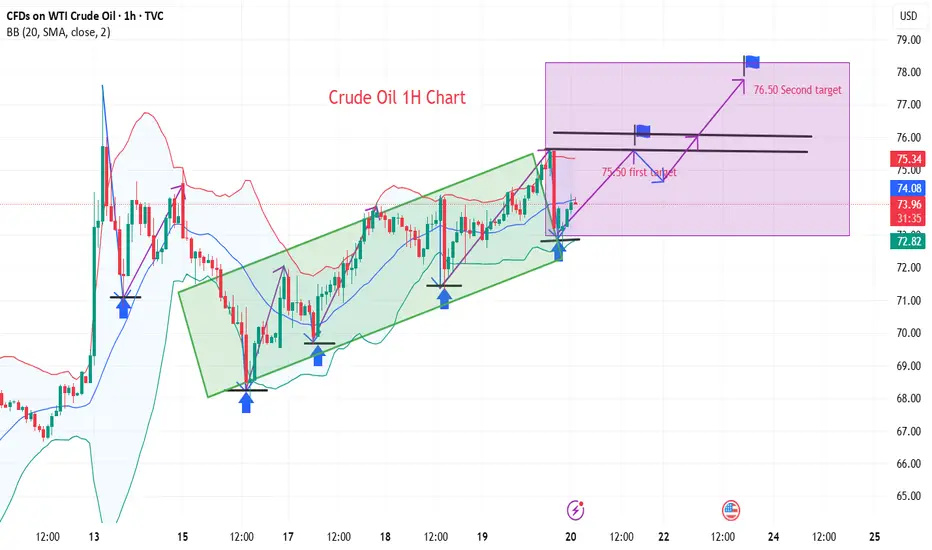
From the daily chart level, crude oil prices in the medium term broke through the upper resistance of the range and tested a new high of 75.50. The moving average system is in a bullish arrangement, and the medium-term objective trend is in the direction.
The current trend is in the upward rhythm of the main trend. The MACD indicator fast and slow lines overlap with the bullish column above the zero axis, indicating that the bullish momentum is currently full, and it is expected that the medium-term trend is expected to usher in a wave of rising rhythm.
💰Strategy Package
Long Position:73.00-73.50,SL:72.50
The first target is around 75.50
The second target is around 76.50
If the situation in the Middle East escalates, the room for crude oil to rise will be enlarged
WTI
WTI Short PositionBelieve stability within the Middle East market will bring the price down so it could rebound back up once liquidity has been cleared

Oil panic buying after Iran Strikes?President Donald Trump has confirmed that the U.S., in coordination with Israel, has conducted three strikes on Iranian nuclear facilities.
Will there be panic buying of WTI and Brent at the open?
In response, Iran’s parliament has approved a proposal to close the Strait of Hormuz, a key global oil shipping route. The final decision lies with Iran’s Supreme National Security Council and Supreme Leader Ayatollah Ali Khamenei.
If a blockade is enforced, oil prices could rise sharply. ClearView Energy Partners estimates a short-term closure could add between $8 and $31 per barrel. JP Morgan has suggested that a full-scale conflict and complete shutdown could drive prices to $130.

WTI POSSIBLE TRADE SETUPPotential Trade Setup on WTI
WTI has been on a strong 2-week rally, following the geopolitical escalation where Israel launched a preemptive attack on Iran. This event sparked a 2% surge, keeping prices hovering around $77 for the past two weeks.
Despite the bullish momentum, I am anticipating a healthy pullback before looking to engage.
My eyes are on two key zones:
- April High Region (Previous resistance turned support)
- 50% Fibonacci Retracement (Measured from recent rally low to high)
🧭 Trading Plan:
1. BUY: is currently the only play, and as I anticipate for a two-level of pullback on the 4H chart.
🟢 Risk-to-Reward:
Targeting 1:3 R/R on either entry.

BRIEFING Week #25 : Heading into Summer ModeHere's your weekly update ! Brought to you each weekend with years of track-record history..
Don't forget to hit the like/follow button if you feel like this post deserves it ;)
That's the best way to support me and help pushing this content to other users.
Kindly,
Phil

Middle East Tension: Read This Before You Trade today⚔️🕊️💣 Middle East Tension: Read This Before Markets close for the Weekend 🌍🔥✌️
Video:
Hey traders,
Today’s landscape is delicate and raw: we stand between a possible US strike on Iran and a chance for leaders to step back from the edge. Many are asking: Should I bet on gold? Should I short the indices? Should I buy oil?
Here’s my honest read, straight from today’s video (which I highly recommend you watch for full context 📺):
👉 Bitcoin (BTC)
Still ranging sideways. The last move hit my resistance zone perfectly. For now, BTC keeps its cool — but watch out: global fear can spark sudden moves, or the opposite, a liquidity crunch.
👉 Gold & Silver
Yes, they’re classic safe havens — but don’t fall for the textbook trap. When true chaos strikes, big players often sell profitable gold positions to cover losses elsewhere. So an initial spike is possible, but deep pockets can reverse it fast. This is why I’m cautious: I do not expect a guaranteed pump on gold or silver.
👉 Crude Oil (WTI)
The chart says it all: any strike in the Middle East fuels oil prices fast. But as I’ve always said — I do not long oil during human tragedy. Ethics over easy pips.
👉 Indices & USDJPY
Gaps are likely. Risk assets may get hammered if bombs fall. If leaders choose dialogue instead, expect a risk-on rebound. The USD stays a wildcard: trust in the US remains, but shocks test that trust.
👉 Airlines Pausing Flights?
Yes — major airlines are avoiding the Gulf. That alone signals how real this risk is.
✅ My plan is clear:
I never short disasters. I never profit from pain. I am LONG on humanity and peace. I’d rather lose a trade than wish for blood in the streets.
I do have some carefully calculated positions open tonight — fully risk-managed and small-sized. If Monday gaps bless me, fine. If peace wins and my trades lose? Even better.
👉 Watch the full video for my live charts, context, and unfiltered thoughts.
This text is just a recap — the full idea is already posted as a video.
Stay sharp. Stay ethical. Protect your capital and your soul — one good trade is never worth your humanity.
One Love,
The FXPROFESSOR 💙
Disclosure: I am happy to be part of the Trade Nation's Influencer program and receive a monthly fee for using their TradingView charts in my analysis. Awesome broker, where the trader really comes first! 🌟🤝📈

Middle East Tension & Markets: My Honest Stance🌍🕊️✌️ Middle East Tension & Markets: My Honest Stance 💣 🔥 🗡️
Hi everyone,
It’s Friday, June 20th — and we face a fragile moment: the uncertainty of possible US military action against Iran. 📉📰✈️
On my charts:
Bitcoin (BTC) reached key resistance and now ranges sideways as we await clarity.
Gold (XAUUSD) remains the classic safe haven — it holds an ascending structure, but profit-taking could trigger dips if markets crash.
Silver (XAGUSD) is similar, yet needs broader industrial strength to outperform gold.
Crude Oil (WTI) could spike dramatically if bombs fall — but I choose not to profit from pain.
USDJPY & USD pairs reflect global trust in the dollar and US stability — I’ll cover this more next week.
My personal stance is simple:
💙 I never short disasters. I never profit from human suffering. I am LONG on humanity and peace. 🕊️✌️🌈
👉 I expect potential market gaps between now and Monday:
✅ Bad news (war) → gold, silver, oil likely pump
✅ Good news (diplomacy) → risk assets rebound, oil stabilizes
I am positioned carefully with small risk and clear stops. My goal: protect my capital, trade my plan, but never bet on pain. If I lose because peace prevails — I win as a human.
Stay safe, trade wisely, and never forget: sometimes the best trade is no trade at all.
One Love,
The FXPROFESSOR 💙
Disclosure: I am happy to be part of the Trade Nation's Influencer program and receive a monthly fee for using their TradingView charts in my analysis. Awesome broker, where the trader really comes first! 🌟🤝📈

WTI(20250620)Today's AnalysisMarket news:
The Bank of England kept interest rates unchanged at 4.25%, and the voting ratio showed that internal differences were increasing. Traders expect the bank to cut interest rates by another 50 basis points this year.
Technical analysis:
Today's buying and selling boundaries:
74.33
Support and resistance levels:
77.40
76.25
75.51
73.15
72.40
71.26
Trading strategy:
If it breaks through 73.15, consider buying, and the first target price is 75.00
If it breaks through 72.40, consider selling, and the first target price is 71.26

WTI Oil H1 | Overlap resistance at 61.8% Fibonacci retracementWTI oil (USOIL) is rising towards an overlap resistance and could potentially reverse off this level to drop lower.
Sell entry is at 76.02 which is an overlap resistance that aligns closely with the 61.8% Fibonacci retracement.
Stop loss is at 78.00 which is a level that sits above a multi-swing-high resistance.
Take profit is at 71.40 which is a swing-low support that aligns closely with the 78.6% Fibonacci retracement.
High Risk Investment Warning
Trading Forex/CFDs on margin carries a high level of risk and may not be suitable for all investors. Leverage can work against you.
Stratos Markets Limited (tradu.com ):
CFDs are complex instruments and come with a high risk of losing money rapidly due to leverage. 63% of retail investor accounts lose money when trading CFDs with this provider. You should consider whether you understand how CFDs work and whether you can afford to take the high risk of losing your money.
Stratos Europe Ltd (tradu.com ):
CFDs are complex instruments and come with a high risk of losing money rapidly due to leverage. 63% of retail investor accounts lose money when trading CFDs with this provider. You should consider whether you understand how CFDs work and whether you can afford to take the high risk of losing your money.
Stratos Global LLC (tradu.com ):
Losses can exceed deposits.
Please be advised that the information presented on TradingView is provided to Tradu (‘Company’, ‘we’) by a third-party provider (‘TFA Global Pte Ltd’). Please be reminded that you are solely responsible for the trading decisions on your account. There is a very high degree of risk involved in trading. Any information and/or content is intended entirely for research, educational and informational purposes only and does not constitute investment or consultation advice or investment strategy. The information is not tailored to the investment needs of any specific person and therefore does not involve a consideration of any of the investment objectives, financial situation or needs of any viewer that may receive it. Kindly also note that past performance is not a reliable indicator of future results. Actual results may differ materially from those anticipated in forward-looking or past performance statements. We assume no liability as to the accuracy or completeness of any of the information and/or content provided herein and the Company cannot be held responsible for any omission, mistake nor for any loss or damage including without limitation to any loss of profit which may arise from reliance on any information supplied by TFA Global Pte Ltd.
The speaker(s) is neither an employee, agent nor representative of Tradu and is therefore acting independently. The opinions given are their own, constitute general market commentary, and do not constitute the opinion or advice of Tradu or any form of personal or investment advice. Tradu neither endorses nor guarantees offerings of third-party speakers, nor is Tradu responsible for the content, veracity or opinions of third-party speakers, presenters or participants.

The wealth code of crude oil is: low and long
💡Message Strategy
According to market research, Iran's crude oil export infrastructure has not been directly hit yet, and most of the impact is still concentrated on shipping. However, analysts pointed out that once the conflict spreads to the entire region, oil prices are likely to rise further.
The Strait of Hormuz has become the market's biggest concern. It is the throat of about one-fifth of the world's crude oil supply. Although there is no sign that Iran is trying to block the channel, any escalation of the situation may pose a serious threat to the global energy supply chain.
"Trump's threat to Iran's supreme leader shows that diplomatic channels are no longer effective," said Charu Chanana, chief investment strategist at Saxo Financial Markets Ltd. in Singapore. "If Iran's exports are interrupted, or even in the worst case scenario such as the Hormuz blockade, oil prices may soar rapidly."
The rise in geopolitical risks has also triggered turmoil in financial markets, with investors turning to safe-haven assets such as gold, and the volatility of the crude oil market has hit a three-year high. At the same time, crude oil producers have stepped up hedging operations, and futures and options trading volumes have surged.
The latest API crude oil inventory data showed that U.S. crude oil inventories fell sharply last week, further reinforcing market expectations of tight supply. According to data released by the American Petroleum Institute (API) in the early hours of June 18, U.S. crude oil inventories fell by 11 million barrels in the week ending June 14, far exceeding market expectations of a decline of 2.5 million barrels, marking the largest weekly drop since August last year.
📊Technical aspects
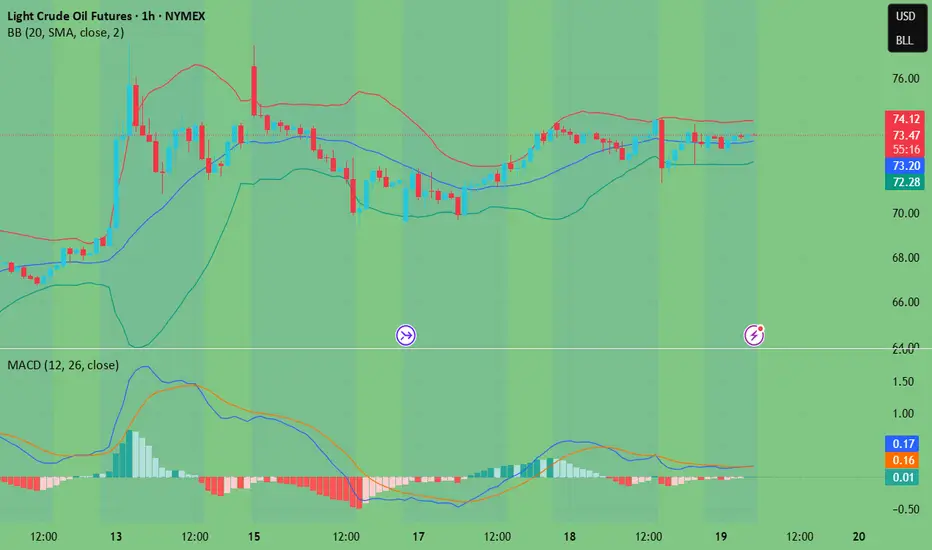
From a technical perspective, the daily chart of US crude oil (WTI) shows a clear bullish trend. After breaking through the previous high of $72, the price quickly rose and stabilized above $75, showing strong upward momentum. The current K-line has closed with long positive lines, and the red column of the MACD indicator has expanded, and the fast and slow lines have crossed, indicating that the bullish momentum continues to increase.
At the same time, the price has moved away from the 20-day and 50-day moving averages. There is a possibility of a technical correction in the short term, but the overall trend is still upward. If the geopolitical situation continues to be tense, the target may be raised to $77.5 or even the integer mark of $80, and the support will focus on the vicinity of $72.50.
💰 Strategy Package
Crude oil has reached our upward target of 74.00 yesterday and fell back. The current upward pressure on crude oil is around 75.50. If it breaks through upward, it will soon reach our second target of 77.50.
rend: Upward trend
Support: Around 72.50
Resistance: Around 75.50
Long Position:72.00-72.50,SL:71.50
The first target is around 75.00
The second target is around 77.50

Bullish momentum to extend?WTI Oil (XTI/USD) has bounced off the pivot and could potentially rise to the 1st resistance.
Pivot: 73.40
1st Support: 71.46
1st Resistance: 76.64
Risk Warning:
Trading Forex and CFDs carries a high level of risk to your capital and you should only trade with money you can afford to lose. Trading Forex and CFDs may not be suitable for all investors, so please ensure that you fully understand the risks involved and seek independent advice if necessary.
Disclaimer:
The above opinions given constitute general market commentary, and do not constitute the opinion or advice of IC Markets or any form of personal or investment advice.
Any opinions, news, research, analyses, prices, other information, or links to third-party sites contained on this website are provided on an "as-is" basis, are intended only to be informative, is not an advice nor a recommendation, nor research, or a record of our trading prices, or an offer of, or solicitation for a transaction in any financial instrument and thus should not be treated as such. The information provided does not involve any specific investment objectives, financial situation and needs of any specific person who may receive it. Please be aware, that past performance is not a reliable indicator of future performance and/or results. Past Performance or Forward-looking scenarios based upon the reasonable beliefs of the third-party provider are not a guarantee of future performance. Actual results may differ materially from those anticipated in forward-looking or past performance statements. IC Markets makes no representation or warranty and assumes no liability as to the accuracy or completeness of the information provided, nor any loss arising from any investment based on a recommendation, forecast or any information supplied by any third-party.

WTI(20250619)Today's AnalysisMarket news:
Fed's June meeting - kept interest rates unchanged for the fourth time in a row, and the dot plot showed two rate cuts this year, but the number of officials who expected no rate cuts this year rose to 7, and the rate cut expectations for next year were cut to 1. Powell continued to call for uncertainty, and the current economic situation is suitable for waiting and watching. He also expects tariff-driven inflation to rise in the coming months.
Technical analysis:
Today's buying and selling boundaries:
72.69
Support and resistance levels:
75.60
74.51
73.81
71.58
70.88
69.79
Trading strategy:
Upward breakthrough of 73.81, consider entering the market to buy, the first target price is 74.51
Downward breakthrough of 72.69, consider entering the market to sell, the first target price is 71.58
Strait of Hormuz risk priced in—or not yet?Iran has repeatedly threatened to block the Strait of Hormuz during periods of heightened tension with the U.S., notably in 2011, 2018, and 2020. The Strait is considered the world’s most critical oil chokepoint, with nearly 20 million barrels passing through daily.
Several banks warn that a full closure could push crude prices above $120–$150 per barrel, or higher if the disruption is prolonged. Still, most analysts view a complete shutdown as unlikely, since Iran also depends on the Strait to export its own oil.
Technically, recent WTI candles suggest that the risk premium may be fading. Price action near $74 shows hesitation, raising the risk of a developing double top—particularly if support at $70 fails. Unless tensions escalate materially, such as the U.S. becoming more directly involved, WTI may consolidate between $70–$74.

WTI CRUDE OIL: There is no better time to sell that this.WTI Crude Oil has turned overbought on its 1D technical outlook (RSI = 71.048, MACD = 2.830, ADX = 41.529) and this is technically the most efficient level to sell on the long term. Not only is that the top of the dotted Channel Down but last week the price got very close to the 1W MA200, which has produced the last 3 major rejections since the week of August 12th 2024. Technically the market still has some room to move upwards and test it but since it rose purely on the latest Middle East conflict, it is more likely than not to see an equally quick price deflation and rebalancing. The earlier bearish waves (September 2023 onwards), initially targeted the 0.786 Fibonacci level and then bounced. That translates to TP = 61.00 (at least) towards the end of the year.
See how our prior idea has worked out:
## If you like our free content follow our profile to get more daily ideas. ##
## Comments and likes are greatly appreciated. ##

WTI drops as Trump keeps markets guessing Despite a huge draw in US crude inventories - not that this was going to move the market given the focus being firmly fixated on the Middle East situation - oil prices fell as Trump kept markets guessing about US military involvement in Iran. The US president said: "I may do it. I may not do it. Nobody knows what I’m going to do." The US president also revealed that he told Israel PM Netanyahu to keep going, but has not given an indication that the US will provide more help. Meanwhile, Iran has issued an evacuation warning for residents of Haifa, Israel. This suggests that the conflict is far from over. But for now at least, the US is not getting involved, if one can believe Trump.
Anyway, WTI is now back at short-term support here, around the $72 handle. If it goes back above $73.00 again then we may see momentum build up again to the upside, especially if the war between Iran and Israel escalates.
By Fawad Razaqzada, market analyst with FOREX.com

Oil Traders Brace for Impact: US War or Pullback?WTI Crude Oil – Intraday Update: Tension Builds Inside Rising Channel
1H Technical Outlook — June 18, 2025
🧭 Current Market Structure:
WTI is currently trading at $72.54, holding above key support but struggling to break through a strong intraday supply zone around $73.80–74.00. Price has formed a rising channel, gradually climbing with higher highs and higher lows—often a pre-breakout structure.
Momentum on the Stochastic oscillator is turning, suggesting the market is preparing for a strong directional move.
📊 Key Technical Levels:
Resistance Zones:
$74.00 – intraday supply
$76.00 – swing high zone
$78.00+ – war-driven extension target
Support Zones:
$70.00 – mid-channel & psychological level
$68.00 – previous breakout zone
$66.00 – bearish continuation target if war is ruled out
🔺 Scenario 1: US-Iran War Escalates (Bullish Breakout)
If the U.S. launches airstrikes or there is confirmed military escalation:
Expect immediate breakout above $74.00.
Price likely to test $76.00, followed by an impulsive move toward $78.00+.
Intraday traders should watch for breakout retest setups on lower timeframes (M15/M5).
🛢️ Market could price in a $5–$10 geopolitical premium per barrel within hours if conflict begins.
🔻 Scenario 2: No War / De-escalation (Bearish Breakdown)
If headlines signal de-escalation or diplomacy:
Rising channel may break to the downside.
WTI could fall back to test $70.00, and if broken, flush toward $68.00–66.00 support.
Watch for bearish engulfing candles, divergence, or momentum fading.
📉 Oil often unwinds risk premium quickly when fear fades — beware sharp selloffs.
🔁 Neutral Intraday Note:
Price currently consolidating between $72.00–74.00 inside an ascending channel.
Break above or below this range will dictate momentum.
Wait for confirmation candle close before entering breakout trades.
🛡️ Risk Management:
Avoid large overnight positions — news headlines can cause gaps or whipsaws.
Use tight stops if trading breakout/down; volatility is news-driven.
Consider options strategies for limited risk exposure (calls above $74 / puts below $70).
📢 If you found this analysis valuable, kindly consider boosting and following for more updates.
⚠️ Disclaimer: This content is intended for educational purposes only and does not constitute financial advice.

Massive Oil Move Incoming? Only One Thing Can Stop ItOIL – Overview
Oil Rallies to 5-Month High as Israel-Iran Tensions Escalate
Oil prices surged to a five-month high early Wednesday amid escalating conflict between Israel and Iran. The ongoing airstrikes between the two nations, along with reports that the Trump administration is considering military involvement, have intensified concerns over a broader regional war.
Since Israel launched a surprise strike on Iran last week targeting nuclear sites, oil has risen nearly 10%, fueled by fears of potential supply disruptions. President Trump has publicly called for Iran's "unconditional surrender," signaling heightened geopolitical risk.
Despite the ongoing conflict, Iran's oil exports remain largely unaffected, and the country has not yet disrupted shipping through the Persian Gulf — a critical route supplying around 20% of global oil demand. However, markets remain on edge over the potential for further escalation that could directly impact supply.
Technical Outlook:
Oil maintains bullish momentum as long as it trades above 72.21, with upside targets at:
➡️ 77.21
➡️ 79.50 — key breakout level
➡️ 85.40 — next resistance zone
➡️ Potential extension to 88.40 if momentum continues
🔻 A shift to bearish sentiment is only likely if negotiations begin between Iran and Israel, signaling potential de-escalation.
Key Levels:
• Pivot: 73.20
• Resistance: 77.21 / 79.50 / 85.40
• Support: 69.55 / 68.33 / 66.03
Caution: Any signs of de-escalation or negotiations between Iran and Israel could quickly reverse the trend.

WTI(20250618)Today's AnalysisMarket news:
World Gold Council: 95% of central banks expect gold reserves to rise in the next 12 months.
Technical analysis:
Today's buying and selling boundaries:
72.29
Support and resistance levels:
76.53
74.95
73.92
70.66
69.63
68.04
Trading strategy:
If the price breaks through 73.92, consider buying, the first target price is 74.95
If the price breaks through 72.29, consider selling, the first target price is 70.66

WTI Oil H1 | Falling toward a pullback supportWTI oil (USOIL) is falling towards a pullback support and could potentially bounce off this level to climb higher.
Buy entry is at 73.31 which is a pullback support that aligns with the 38.2% Fibonacci retracement.
Stop loss is at 70.90 which is a level that lies underneath a swing-low support and the 61.8% Fibonacci retracement.
Take profit is at 77.60 which is a swing-high resistance.
High Risk Investment Warning
Trading Forex/CFDs on margin carries a high level of risk and may not be suitable for all investors. Leverage can work against you.
Stratos Markets Limited (tradu.com ):
CFDs are complex instruments and come with a high risk of losing money rapidly due to leverage. 63% of retail investor accounts lose money when trading CFDs with this provider. You should consider whether you understand how CFDs work and whether you can afford to take the high risk of losing your money.
Stratos Europe Ltd (tradu.com ):
CFDs are complex instruments and come with a high risk of losing money rapidly due to leverage. 63% of retail investor accounts lose money when trading CFDs with this provider. You should consider whether you understand how CFDs work and whether you can afford to take the high risk of losing your money.
Stratos Global LLC (tradu.com ):
Losses can exceed deposits.
Please be advised that the information presented on TradingView is provided to Tradu (‘Company’, ‘we’) by a third-party provider (‘TFA Global Pte Ltd’). Please be reminded that you are solely responsible for the trading decisions on your account. There is a very high degree of risk involved in trading. Any information and/or content is intended entirely for research, educational and informational purposes only and does not constitute investment or consultation advice or investment strategy. The information is not tailored to the investment needs of any specific person and therefore does not involve a consideration of any of the investment objectives, financial situation or needs of any viewer that may receive it. Kindly also note that past performance is not a reliable indicator of future results. Actual results may differ materially from those anticipated in forward-looking or past performance statements. We assume no liability as to the accuracy or completeness of any of the information and/or content provided herein and the Company cannot be held responsible for any omission, mistake nor for any loss or damage including without limitation to any loss of profit which may arise from reliance on any information supplied by TFA Global Pte Ltd.
The speaker(s) is neither an employee, agent nor representative of Tradu and is therefore acting independently. The opinions given are their own, constitute general market commentary, and do not constitute the opinion or advice of Tradu or any form of personal or investment advice. Tradu neither endorses nor guarantees offerings of third-party speakers, nor is Tradu responsible for the content, veracity or opinions of third-party speakers, presenters or participants.

The best opportunity is when crude oil falls
💡Message Strategy
Crude oil futures fell in the European session on Monday (June 16), giving up earlier gains, as a new round of hostilities between Israel and Iran had limited impact on oil production and exports.
WTI briefly rebounded to $77.49, close to last week's high, which was also our second profit target, but failed to break through the key resistance level near $78.09.
Oil prices surged 7% on Friday, driven by geopolitical risks, pushing crude to its highest level since January. However, Monday's reversal reflected the lack of immediate threats to supply routes, especially the strategically important Strait of Hormuz.
If Iran's production drops sharply due to the conflict, the global oil supply buffer will be quickly exhausted and oil prices may usher in a new round of surges. Faced with this complex situation, investors, oil-producing countries and consumers need to be prepared to meet the possible energy storm.
This is also the reason why we repeatedly emphasize that crude oil should be long when it falls. We can foresee its upward momentum, and the pullback is only in a moment without any signs.
📊Technical aspects
The short-term (1H) trend of crude oil continued to fluctuate upward, and the price near 74 was tested. The moving average system relies on the bullish arrangement of oil prices, and the short-term objective trend direction remains upward.
In the morning, the oil price hit a new high near 75.30, and then fell back and closed with a negative real candlestick. The short-term momentum is still bullish, and it is expected that the trend of crude oil will continue to maintain a high-level oscillating upward rhythm.
💰 Strategy Package
Long Position:69.50-70.50
The first target is around 73.00
The second target is around 75.00

WADZ & the Petrodollar RevivalGlobal FX Shift: The Rise of WADZ (2025–2026)
In mid-2025, a war between Iran and Israel spirals fast. Iran strikes hard, Israel’s defenses go offline from cyberattacks, and the U.S. surprisingly doesn’t intervene.
Instead, America steps in quietly, setting up a “peacekeeping” zone along the Jordan-Israel border. It’s called the West Asia Demilitarized Zone (WADZ) — but behind the scenes, it’s about control, not peace.
Oil jumps to $115.
Markets flip. USD/JPY and USD/TRY spike. EUR/USD slides.
Then the U.S. launches WZ-Digital, a USD-backed oil coin. Now, all oil in the region trades through America.
OPEC fractures. Saudi and UAE fall in line.
China gets iced out. USD/CNY shoots past 8.30.
In the desert, a secret U.S. city appears: The Watchtower — a hub that manages oil, data, and borders.
Regional FX Snapshot (2026)
Europe: Gas crisis deepens. EUR/USD drops to 0.95. East Europe leans on U.S.
China: Crypto-oil push fails. Capital flight triggers USD/CNY → 8.80.
Russia: Oil-for-yuan helps short-term, but ruble stays shaky.
Africa: Egypt & Morocco adopt WZ-Digital. Local currencies stay weak.
Southeast Asia: Dual oil trade (USD/WZ). SGD steady, MYR & IDR choppy.
(BRICKS+)
Latin America: Brazil, Argentina resist — then cave. USD demand surges.
Bottom Line:
By end of 2026, USD isn’t just money — it’s a global system.
WADZ quietly reprograms the rules of energy and trade.
No invasion, no headlines. Just quiet, total control.
Bye guys

Oil Eyes $90+ as U.S.–Iran Conflict LoomsWTI Crude Oil — Bullish Reversal in Play as War Risk Escalates
Technical & Geopolitical Outlook — Weekly Chart | 17 June 2025
🧭 Current Market Condition:
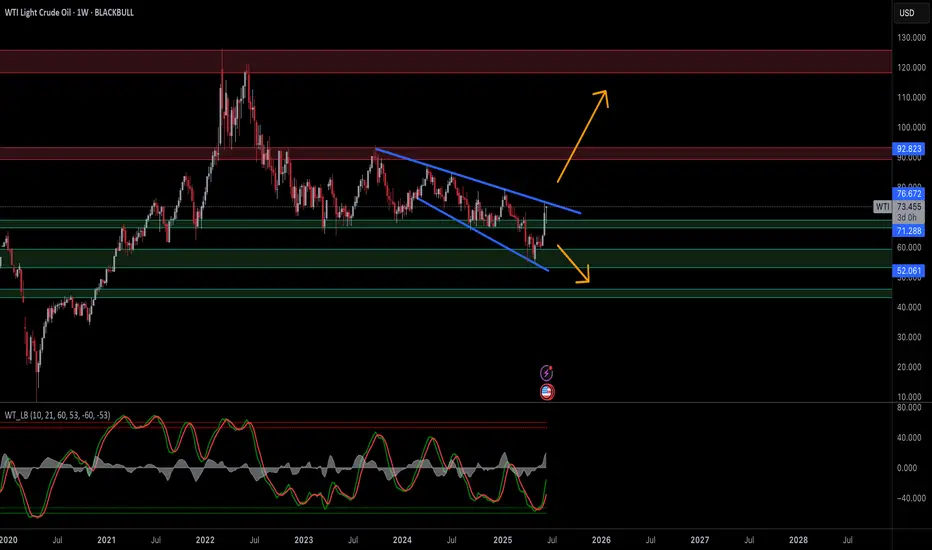
WTI crude oil is breaking out of a multi-month falling wedge, a classically bullish reversal pattern, after bouncing from the $67–68 support region. This technical move is further amplified by rising geopolitical tensions in the Middle East, particularly fears of a potential U.S. military strike on Iran, which would threaten global oil supply routes through the Strait of Hormuz.
The current breakout attempt aligns with a sentiment shift from oversold to recovery mode, supported by a sharp rise in weekly momentum indicators.
📊 Key Technical Highlights:
Bullish Falling Wedge Breakout: Price breaking above descending resistance.
Key Resistance Levels:
$76.67 – immediate supply zone
$92.82 – prior breakout area; major target if breakout sustains
Key Support Levels:
$71.28 – breakout retest level
$67.00–$68.00 – wedge base, strong historical support
$52.00 – longer-term bearish invalidation (unlikely unless demand collapses)
Momentum: Weekly stochastic sharply rising from bottom, signaling strength building.
🔺 Bullish Scenario — If U.S. Attacks Iran:
If the U.S. carries out military strikes on Iranian targets, oil prices are highly likely to:
Price in geopolitical risk premium of $10–$20/barrel.
Spike toward $90–$100 range within days or weeks due to:
Fears of supply disruption (Hormuz choke point)
Panic buying and short covering
Strategic reserves hoarding
Technical Targets:
$76.67 → Break above confirms bullish continuation
$92.82 → First major upside target
$100–$110 → Stretch target if conflict escalates or prolongs
🛢️ Energy traders and institutions typically front-run geopolitical escalations, so price can jump before any physical conflict if tensions remain unresolved or rhetoric intensifies.
🔻 Bearish Scenario — Fake Breakout or De-escalation:
Rejection from $76.67 or failure to hold above $71.28 can trigger pullbacks.
If tensions cool and Iran conflict is diplomatically diffused:
WTI may slide back toward $68.00 and re-enter the wedge.
Below $67.00, oil could revisit $60–$52 range in a risk-off macro environment.
🛡️ Risk Management & Outlook:
Geopolitical events can override technicals, especially in commodities.
Gaps, whipsaws, and sharp reversals are common — caution with overnight positions.
Consider hedging strategies or limited-risk option plays if trading leveraged oil instruments.
📢 If you found this analysis valuable, kindly consider boosting and following for more updates.
⚠️ Disclaimer: This content is intended for educational purposes only and does not constitute financial advice.
WTI above $75 on fears of US involvement in Israel-Iran conflictThe Israel-Iran situation is quite different this time and with Trump announcing that *we* now have full control over Iranian skies, suggesting the US is entering the fray – hardly a surprise to be honest - this is not going to end well. The conflict may get far worse in the short-term, and this will send shockwaves through the oil markets – especially if there are disruptions in the Strait of Hurmuz. Oil prices could easily spike to $100 and higher in the worst-case scenario. So, the situation is quite serious, unfortunately. Let's hope that it quickly de-escalates and lives are not lost.
But make no mistake, this could get really big - especially with headlines like these coming out in the last few minutes:
*US OFFICIALS SAY TRUMP 'SERIOUSLY CONSIDERING' STRIKE ON IRAN: AXIOS;
*TRUMP TO MAKE POLICY DECISION ON ISRAEL-IRAN: AXIOS
*IRAN WILL SOON LAUNCH 'PUNITIVE' OPERATION AGAINST ISRAEL: IRNA
The picture is looking quite grim, unfortunately.
by Fawad Razaqzada, market analyst with FOREX.com
