CRUDE OIL: I'm buying📊 Analysis on WTI:
👉 We're at an OTE (Optimal Trade Entry)
👉 Correction is underway
👉 A SOLID Order Block
👉 We're following the trend
👉 Targeting Liquidity $
🚀 If you liked it, don't forget to boost
Wtianalysis

WTI H1 / Opportunity for a Short Trade 💲Hello Traders!
I see a good opportunity to execute a short trade on WTI H1. I expect the BOSS at the price of 77.80 to be taken, and in case of retracement, I will look for a short trade entry.
Traders, if my proposal resonates with you or if you hold a divergent viewpoint regarding this trade, feel free to share your thoughts in the comments. I welcome the opportunity to hear your perspectives.
____________________________________
Follow, like, and comment to see my content:
www.tradingview.com

The Market Behaviour on different market sessionAsia market session makes compression price, and the next session when UK session is expecting to manipulate the market. The last session US session is expected market to do the distribution/direction. The price is on the strong supply area waiting for the price to break resistance before or do the rejection on the supply zone.

Crude Oil - Buy Zone!Hey there!
I'm selling on WTI: (Second trade)
-RMID (Range Manipulation Initiation Distribution)
-We have liquidity uptake.
-We have an interesting zone.
-We have the optimal Fibonacci.
-We have accumulation before/on the zone.
-We are with the trend.
🚀 If you liked it and want more, don't hesitate to subscribe and boost the post!
Questions? Leave a comment!

Crude Oil - Buy Zone!Hey there!
I'm selling on WTI:
-RMID (Range Manipulation Initiation Distribution)
-We have liquidity uptake.
-We have an interesting zone.
-We have the optimal Fibonacci.
-We have accumulation before/on the zone.
-We are with the trend.
🚀 If you liked it and want more, don't hesitate to subscribe and boost the post!
Questions? Leave a comment!

WTI crude looks set to bounceMomentum has clearly been in favour of bears over the past week for WTI traders, but given it has fallen over 10% from the January high it could be argued the move is oversold (at least over the near term).
A doji formed on Monday to show bears are losing their grip, and the fact it is forming a base above the 2023 open price and $72 handle adds to the case for a technical bounce. Moreover, bears entered around the January highs but volumes declined as prices fell to suggest the move is running out of steam, and RSI (2) was oversold on Friday.
The bias is for a bounce towards the weekly and monthly pivot points around 74.50 - 74.80 whilst prices remain above Monday's low.

USOIL Sell Setup🚨 Crude Oil #WTI
🗓️ Date: 12 February, 2024
⏰ Timeframe: Daily
💡 Given in the chart –
♦️ Green (long term support) = 67.50
♦️ Red (resistance) = 78.85
The price has been in the range (red color) on the chart since December last year. Price touched this range several times but failed to deliver a breakout. As long as this range remains active, the potential trend will be neutral.
✅ Those who like to trade in Crude Oil, please take Buy position near the support level of the range and Sell position near the resistance level. That is, bounce trading strategy
✅ As long as the price is not able to break this range, you can accept entries according to this pattern.
🚫 Remember, while staying within the range, no Buy/Sell entry can be taken in intermediate positions. Either let the price approach the resistance level or the support level, then take a reversal entry.

WTI M15 / Retracement from the FVG H1 / Long Entry ✅Hello Traders!
This is My idea related to WTI M15. I see a retracement from the FVG H1. I see this as a good opportunity to execute a long entry. My target is OB at the price of 76.300.
Traders, if you liked my idea or if you have a different vision related to this trade, write in the comments. I will be glad to see your perspective.
____________________________________
Follow, like, and comment to see my content:
www.tradingview.com

WTI → RectangleWe have a possible Rectangle pattern with a target at 65.000, as long as the price does not break the 80.000 zone.

WTI → Oil prices drop as the USD recovers, OPEC cutsThe outlook has turned bearish for the WTI. This is mainly because the Relative Strength Index (RSI) and Moving Average Convergence Divergence (MACD) reside deep in negative territory and as the price is seen below its 20,100 and 200-day Simple Moving Averages (SMA). This indicates that on the shorter and broader scales, the sellers are dominating.
Resistance Levels: $75.00, $76.15 (20-day SMA), $77.00
Support Levels: $72.80, $72.30, $71.00

WTI → Prices dip ahead of OPEC+ delayed meetingBLACKBULL:WTI is set to consolidate at around the $75.00-$80.00 range, after failing to decisively break the November 22 swing low of $73.85, which could have exacerbated a drop to $70.00 per barrel. That said, WTI’s success in registering a daily close above $75.00 could open the door to test the first resistance at the 20-day moving average (DMA) at $77.62 before buyers could lift prices to the 200-DMA $78.06. Further upside is expected once the latter is breached.

USOIL WTI Technical Analysis And Trade IdeaIn this video, we conduct a comprehensive analysis of the USOIL market, with a primary focus on the prevailing bearish sentiment observed in higher timeframes. Notably, WTI has recently approached a critical support level. Throughout the video, we delve into essential elements of technical analysis, which encompass aspects such as the current trend, price action dynamics, market structure, and various other fundamental components of technical analysis. As we progress through the latter part of the video, we closely examine a potential trading opportunity.
It is crucial to emphasize that the information presented here serves exclusively for educational purposes and should not be construed as financial advice. Engaging in currency market trading carries a significant level of risk. Therefore, it is imperative to prudently incorporate risk management strategies into your trading plan.

US OIL / WTI Analysis 13Oct2023Over the last few weeks, the price of oil has experienced a noticeable decline. Upon closer inspection, this trend appears to be the result of a series of corrections from the previously bullish market. Currently, there is speculation surrounding the possibility of Wave (C) occurring, which is being analyzed through the addition of Fibo Expansion. It is predicted that the price will likely move towards the 76 area, which intersects with Fibo 0.786 and the SND area. This level of detail provides a more comprehensive understanding of the current market trends and the anticipated future movements of oil prices.

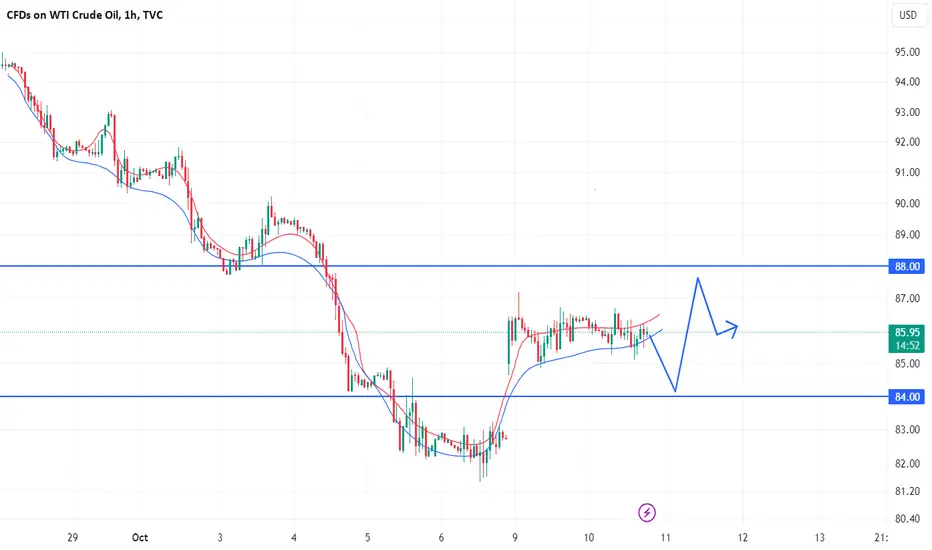
Crude oil fluctuates today
The Palestinian-Israeli conflict has killed more than 1,600 people! Crude oil rose more than 4% and may continue to rise in the future.
After the Palestinian-Israeli conflict, it was in a range, with the lowest of 84.6 and the highest of 87.2 that day. The daily line closed at 86.3. From the daily line, oil prices will continue to rise. The top continues to pay attention to the breakthrough of 87. On the four-hour line, the Bollinger Track is parallel. , showing a volatile upward trend, the hourly line, the Bollinger Band narrowed in parallel, and oil prices will remain range-bound in the short term. In summary, intraday operations are dominated by shocks, let’s first look at the 84-88 range.
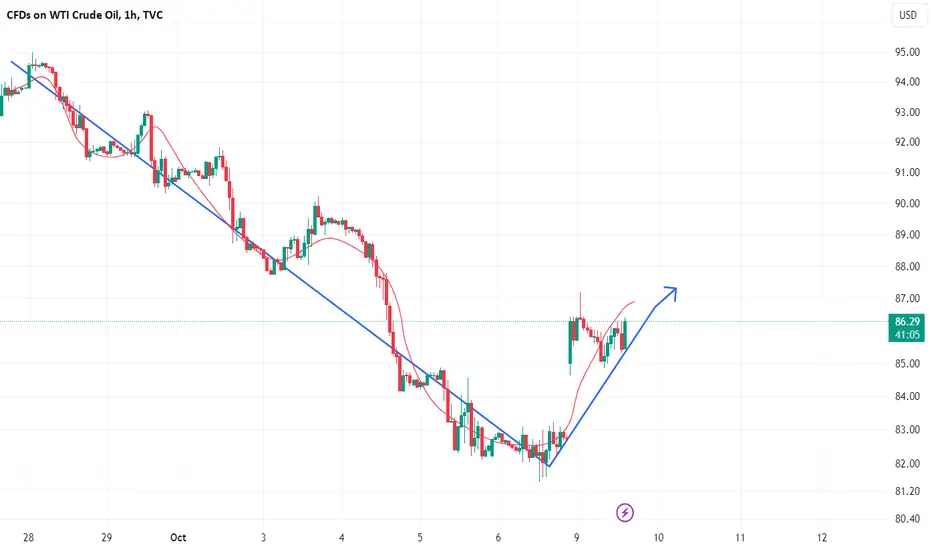
WTI trade analysis
Over the past weekend, conflicts in the Middle East shook the market, and oil prices jumped on Monday (October 9). News from Israel has been dominating Asian markets, with the usual safe havens finding bids. Oil prices led the gains, with Brent and U.S. crude rising as much as 5%, at a time when oil prices retreated slightly.
It is recommended that crude oil rebounds from 86.2-86.7 and shorts in batches, with a stop loss of 87.3 and a target of 84.7-83.0; hold if the position is broken;
It is recommended to go long in batches when crude oil hits 83.5-83.0 for the first time, with a stop loss of 82.5 and a bullish target of 84.2-84.8;
Crude Oil (WTI)This looks like it is poised to head back into a well established $70-$80 range (and then some!). Anticipated long-term USD strength, as well as extended Global economic weakness bodes well for an enduring price weakness outlook.
Technically, Crude is at a major pivot, both, at the top of a rising daily channel, as well as at the top of a descending weekly channel trend line, resulting in a significant confluence region - both of those having price-negative connotation.
The Daily (main signal);
SHORT on any reversal!
... and the 240 min. (secondary signal);


WTI trade analysis
Crude oil fluctuated upward last week, with the lowest at 86.6 and the highest at 90.7. The weekly closed at 90.3. From the weekly perspective, oil prices will continue to rise. On the daily line, the price fluctuated upward. In summary, the operation ideas this week are mainly callbacks. During the day, The four-hour line fluctuates upward. The hourly line fluctuates in a range. In summary, the main trend during the day is shock and upward. Let’s first look at the 88-91 range.

WTI 's rally could just be getting startedThe more we look at market positioning on WTI, the more we suspect that oil may be dominating headlines as we head into 2024.
In recent weeks we can see that large speculators and asset managers have been increasing long exposure and reducing shorts, which is the ideal scenario for a bullish trend. Yet net-long exposure for both sets of traders remains low by historical standards, and therefore shows no immediate threat of the move higher being extended. If anything, it could look underbought considering OPEC's desire to support prices.
And when you consider oil is rising despite the stronger US dollar, you get to appreciate how strong the rally could get if the dollar's rally were to falter. Either way, with a rising US dollar and oil prices, 2024 could get messy and perhaps risk assets will get their reckoning once more.

WTI Upside target 91.5
Crude oil continues to rise in the direction of the trend. Any intraday adjustment before reaching the new target of 91.50 is an opportunity to continue to be bullish in the short term. Of course, since the overall increase has been huge enough, the current space above is limited. Another one is in this round. It is the end of the rise, so it is not advisable to be overly bullish.
The operation suggestion is to wait for 89.50 to buy first line, stop loss at 89, and target 90.80~91.50. If it rises directly to 91.50, we will look at the pressure signals and decide whether to buy the top.

WTI Target breaks through 90
The overall trend of crude oil rose and fell back yesterday. After a slight rise, the bulls were unable to come out of the decline, but the bullish direction remained unchanged. After all, the bullish form on the daily line was good, and the moving averages were also arranged by bulls. If there is an unexpected second bottom, the bullish trend can continue. . Therefore, it is recommended to be directly bullish on 88.7, add positions to 88.3, lose 87.8, and look at 90-91. As long as the daily MA10 position does not break, the bullish idea remains unchanged. If it breaks below, it will face adjustments. We can then watch for a pullback. It may be a slow rising trend during the day!

US OIL / WTI Analysis 14Sep2023US Oil has a very strong bullish, by always forming new high. If at the end of this clock, a bullish candle is formed which is quite thick, it is likely that the price will continue to the right price of 91 in the Fibo extension area of 0.786 and contact with the channel line. We see again how the market reaction in the price area.

US OIL / WTI Analysis 10Sep2023The movement of US oil has been very bullish in recent months, it seems to be seen to be peak for a few moments ahead. If you look at the Elliot Wave series that occurs, Wave 5 is likely to end. If you want to Short, it's better to wait for prices to fall to the reversal and retrace areas.
