MEDIUM TERM WTI CRUDE OIL ANALYSISHEY ZEYAN HERE
Hello, zeyan. I was previously fairly bullish on oil, but as I can see now, oil prices will be settling back to below 100, with 82.50 being the next best probable position.
this is an idea a plan in a uncertain chaotic environment out of multiple plans to be certain
IF anything happens that changes the fundamentals of this idea, i will update.
please note that this is not financial advice. do your own research and use this information as conformational biase on top of your own analysis.
like for support!!!!
Wtianalysis

CRUDE OIL Breakout Long !!CRUDE OIL was trading in a downtrend
But then broke the falling resistance
After is retested a support level at 95.30
I think that we will see a move up
To retest the target above at 115.18

WTI: Flying SquirrelFlying squirrels are not, in fact, able to fly but rather glide from tree to tree, using their extended skin that stretches from their arms to their legs. Just like one of those flying squirrels, WTI has jumped off the retracement at $115.78, where it has finished wave b in orange, and is currently gliding downwards in the direction of the support at $80.98. After it has completed wave (A) in white in this region, WTI should temporarily gain some new momentum, spreading its parachute-like skin again for a countermovement in wave (B) in white. Then, it should continue to float into the green treetop between $70.12 and $35.77 to conclude wave (C) in white, wave c in orange and wave 2 in green.

WTI: Fast and Furious 🏎🏎🏎After its racy rush upwards into the red zone between $111.46 and $131.21, WTI has slammed on the brakes at the resistance line at $130.50 and turned around with screeching tires to race down into the orange zone between $96.40 and $88.38. There, WTI should finish wave a in orange and then ride a short loop upwards to complete wave b in orange. After this daring feat, the drive should go on downwards below the support at $80.98 and into the green zone between $70.12 and $35.77.

WTI starting to recover from inflation driven plungeHello everyone, as we all know the market action discounts everything :)
_________________________________Make sure to Like and Follow if you like the idea_________________________________
Oil prices surged above $83 per barrel in volatile trading on Thursday, recovering from significant drops caused by concerns about rising US inflation, as OPEC reduced its 2021 oil demand prediction owing to high energy prices.
In a monthly report, the Organization of Petroleum Exporting Countries (OPEC) stated that it expected oil consumption to average 99.49 million barrels per day (bpd) in the fourth quarter of 2021, a 330,000 bpd decrease from last month's prediction.
Possible Scenario for the market :
The market is currently trading at $81.26 and looks like it going to the support line located at $80.17 where a battle will happen between the Bears and the Bulls over control, the outcome will probably be in favor of the bulls which will cause the market to increase in value reaching the first resistance at $84.08.
in case the demand for oil increases even more then we will most likely see a further push that could reach the $88.00 level by the end of the week.
Technical Analysis show :
1) The market is below the 5 10 20 MA and EMA indicating a Bearish Short-term movement, but still above the 50 100 and 200 MA and EMA indicating a Bullish Long-term trend
2) The RSI is at 51.61 showing good strength in the market with a small Bullish divergence that could be a sign of a Bearish short-term trend.
3) The MACD is above the 0 line still indicating a Bullish market, but it has a Negative crossover between the MACD line and the Signal line indicating a small Bearish movement.
Support & Resistance points :
support Resistance
1) 80.17 1) 84.08
2) 78.63 2) 86.45
3) 76.26 3) 87.99
Fundamental point of view :
OPEC expects global consumption to hit 100 million bpd in the third quarter of 2022, three months later than predicted last month.
On Wednesday, data indicated that inflation in the United States surged by 6.2 percent, the quickest rate in 30 years, owing primarily to increasing energy prices, which pushed the dollar higher while sending Brent and WTI oil down by 2.5 % and 3.3 %, respectively.
A surge in US oil supplies following the government's release of some critical reserves pushed up prices even further.
In reaction to rising inflation, US President Joe Biden stated he directed the National Economic Council to concentrate on lowering energy costs and the Federal Trade Commission to crack down on market manipulation in the energy industry in order to reverse inflation.
This is my personal opinion done with technical analysis of the market price and research online from Fundamental Analysts and News for The Fundamental point of view, not financial advice.
If you have any questions please ask and have a great day !!
Thank you for reading.

WTI Oil can correct to 70 zoneYesterday, after a short-lived spike above 76, WTI reversed strongly confirming this zone as strong resistance
A deeper correction can follow from this point and we can look to sell rallies under 76
A daily close above resistance would negate this scenario

Good time to short XTIUSD (WTI crude) 06 Sep, 2021As you can see from my daily chart, after reaching a high in early July, this pair is forming a sequence of lower highs/lower lows. The recent high of 76.53 is actually a double top (scroll back to 30 Sep 2018). After bouncing off the support at 61.700, we had a pullback to 70.500. This level (area) acted as minor support/resistance during the past few months. This pullback to a previous significant level is encouraging to me – it shows a structure in the price action.
In my opinion, we could be seeing the start of a bearish trend and would be ready to take a short either at current levels or better still a small pullback to 70.500. Either way, we have a good R/R whether we target the 61.700 or 53.920 region. It is important to limit the loss in case this analysis is wrong, my stop will probably be located at 72.100 area.
If you like my analysis, please give it a “thumbs up” and follow me to get immediate notifications.
Always use sound money and risk management in all your trades.

WTIUSD USOIL long I trade 1 min chart ... I expect a triangle here
everything is planned
like my chart so that i can continue sharing ideas and you guys can make money

US Stock In Play: $WTI (W&T Offshore Inc)With Oil and Gas stocks continue to rally up form their 2020 lows, and SPDR S&P Oil & Gas Exploration & Production ETF ($XOP) already above its Pre-Covid levels, $WTI rally of +24.06% over the past weeks of trading upon the high volume break of a two weeks consolidated pattern, continue to suggest it is playing catch up relative to the broader sector.
With management of $WTI owning 35% of the common stock, it provides a strong alignment of incentives. Its offshore's asset values alone suggest that the shares are underpriced and may be worth $6-$7.
The immediate resistance for $WTI is at $5.
$WTI an independent oil and natural gas producer, engages in the acquisition, exploration, and development of oil and natural gas properties in the Gulf of Mexico. The company sells crude oil, natural gas liquids, and natural gas. It holds working interest in approximately 43 offshore fields in federal and state waters. The company also owns interest in approximately 146 offshore structures.

WTI Oil : 73.75-76 level possible short term target ?Seems like a clear upside break out with a short term support near 67 handle ( previous resistance) + SSI is around 30% on an average
Trend : Bullish
Signal : Buy @ 68.50 (weekly pivot) , Buy limits above 64.25 - 66.00 (Supports)
Strategy : Split positions
Target : 73.75 - 76 Handle
Stop Loss : Manual close / Parallel position below 64

WTI Oil : Upside break out is possible targeting 72-74 Handle As of now trading around 67 area with speculative sentiment index around 20% hence an upside break out is highly possible targeting the 72+ levels coming weeks . However, considering the trade on the last day of month + price around the range top , You can try putting sell limit orders 100-150 pips above the 67 top although success rate will probably very low as the HERD is in mass selling mode.
Trend : Up
Pattern : Possible upside break out
Signal : Buy Dips
Target : 72-74 handle
Trade to try : Sell limit @ 68-68.50
Stop Loss : 69
Target : 63-64
Accuracy : Less than 50%


WTI Crude Oil.. Analysis..Crude oil is one of the most in-demand commodities, with the two most popularly traded grades of oil being Brent Crude and West Texas Intermediate (WTI). Crude oil prices reflect the market’s volatile and liquid nature, as well as oil being a benchmark for global economic activity. The oil price charts offer live data and comprehensive price action on WTI Crude and Brent Crude patterns. Get information on key pivot points, support and resistance and crude oil news.
Daily Classical Pivot Points. Last Updated: Apr 25, 2021

WTI crude should start descending the week of 19 April, 2021The most significant levels are marked on my weekly chart above. The high of 74.50 was achieved late in 2019 but I don't think we are going to get there this time. The area around 63.50 was reached 2 times in the recent past but it held firm each time. Now we have been there again, the bulls did break above but were quickly defeated creating what we traders call a false break. The last weekly candle has tested the 63.50 from below and I think we are ready for a nice bearish move.
s3.tradingview.com
Taking a look at the daily price action, we can see that the break above was quickly overcome by a large bearish candle. It is the largest bearish candle in the entire chart in view and that tells me that the bears did take over control. The following price action is a consolidation, rather weak judging by how much time it has taken to recover the territory gained earlier by the bears.
I am ready to take a short as soon as the market stabilizes on Monday with an initial target to the bottom of this equidistant channel. I will watch PA if this works out, possibly to extend my target to the 52.00 area. Even with the higher target we have a 3.50 or 4.00 R trade.
Please give my analysis a "thumbs up" if you like it.
As always, please use sound money and risk management in all your trades.


WTI Crude Oil..Wait for sell..Trade At Your Own Risk (TAYOR)Decending triangle.. Wait untill break below triangle..

Oil outlookOil made a new high post negative territory above 45usd/barrel and for 2 weeks now is staling in this zone.
I think at least a correction is just around the corner and WTI could fall to 43, to say the least.
A confirmation for sellers comes with a break under 45.
I'm looking to sell it

WTI- Can it reach 50?After a few days of consolidation between 39 and 42, Oil broke above resistance and also above the recent 43 high and looks determined to continue higher.
The chart looks very constructive and with this new "vaccine" and wave of optimism crude oil could find strong bids that can drive the price to 50 old support now resistance.
As long as the price is above 43 on a daily close basis I'm bullish

WTI outlookAlthough the price of Oil remains elevated, it doesn't convince me...
Rises are very well capped around 42.50-43 zone and I expect the price to tumble sooner or later.
A daily close under 41 would be the signal for bears and, considering the economic outlook, 35usd/Baril would not surprise me at all
WTI- I maintain my 37 targetWTI had a short-lived spike above resistance and this rise proved to be a false break.
Now Oil is trading just in rising trendline support and a break here should accelerate losses towards at least 37.

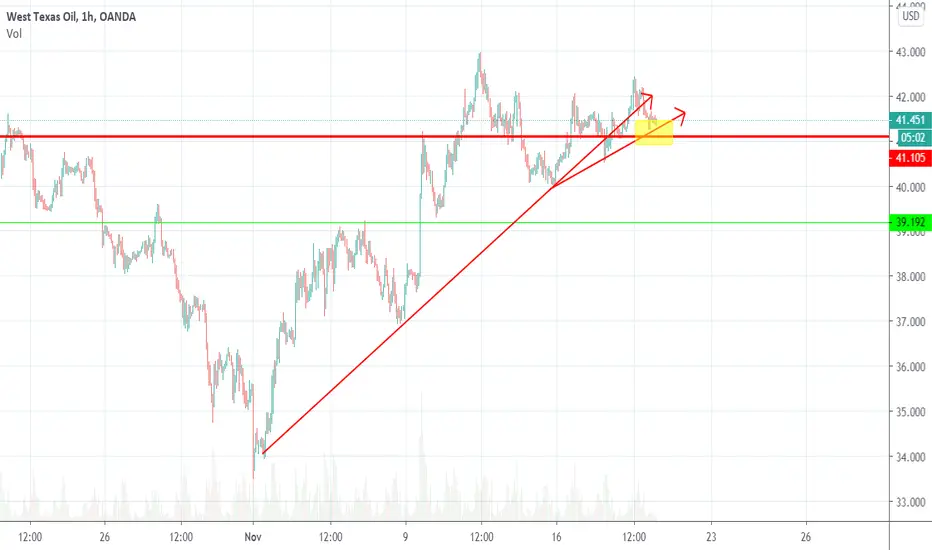
WTI- Looking to sellFrom 34 recent low Oil has risen 20% to 41 resistance zone.
Now the price is just under this important resistance and I expect Oil to remain in this 35-41 range in the medium term
That being said I will look to sell rallies above 41 with a target on the lower part of the range

Ending Diagonal and Double Top patterns Drop to the level of 31$The oil price is directly related to the Canadian dollar level, let's discuss oil in light of the Canadian dollar, which is likely enters to a corrective uptrend.
The uptrend has ended in the range of USD 43.15, and the price has entered to the corrective phase (the downtrend), the first wave of which ended the range of 36.01.
Currently, we are in the C wave from B point, where the price is beautifully forming the patterns of Ending Diagonal and Double Top. Also, divergence is quite visible in MACD and RSI, all these cases indicate a strong downtrend in the direction of C wave and the completion of B / 2 wave, the first target of which is 36.01, and then, according to Fibonacci percentages, it can drop to the range of USD 33 and 31
Please note that the Ending Diagonal pattern is not completed yet, this analysis can be confirmed by crossing the price from a range of 40.17
