Wtianalysis


WTI Crude OilWTI crude oil, the spring is wound (very low volatility in latter days), soon the price will shoot upwards

OIL WEEKLY ANALYSIS – PRICES UNLIKELY TO BREAK RESISTANCEThe market traded in a tight range this week, near its top around the 40$ handle failing to break the resistance level. Moreover, a whole month into consolidation with a total lack of fundamental supports has brought the market to retrace in yesterday's trading session, losing its grip and registering a drop of about 3% and continuing this downward momentum at today's opening Friday Asian's session. Finally, the "debate" about peak oil demand having already arrived aims the pandemic, and new outbreaks continue now with some skepticism.
Technically speaking, there is not much to say, a whole month into consolidation, and last week trading in a tight range, it has kept most investors out of the market expecting some real catalyst. In the intraday realm of H4, a breakout from a smooth ascending channel has just happened, EMA forming a death-cross and price heading towards its support level from the D1 timeframe channel. MACD in a diminished bullish trend with RSI in the land of nobody for unambiguous confirmation of bears diving in. The trend consolidation in price action is expected to remain unchanged for the time being
Now, concerns are coming from the fundamental front, with some states in the US hitting single day peaks for coronavirus deaths, Anthony Fauci, the "expert" suggesting to look into lockdown protocols raising concern about the country's economic outcomes. Reports from EIA and build-up of inventories to +5.6M barrels vs. -3.19 M expected has hit the demand and confirm the economic recovery slowdown. With Saudi Arabia and the OPEC+ new concerns about the expiring agreement for production cuts and no-compliance of some members in the cartel, that remain laggards in their quotes create a dark-cloud shadow that unfortunately dominates the market sentiment.
This week's closing looks bearish for the market. In the meantime, let's keep sit on our hands, enjoying the weekend ahead. Stay safe and remember the social distancing. May the market stays with us. Happy Friday.

US OIL: Weakness In Bullish MomentumHi Traders,
WTI is showing signs of slowing bullish momentum and will likely make a case for downside in the coming sessions. We are currently looking at a 5 wave ending diagonal, and this structure is a reversal pattern. Don't miss this move and look for short entries only when price confirms.
Regards
Wave Theorist

USOIL - WTIHey guys!
We had big move to the upside, however, it is going to create corrective structure. Expecting $8-10 price drop before we take another long shot.
Hope you benefited trading both side.
It's not a trading call just an idea how the market would move.
Ty

USOIL - WTI (CRUDE)Hey Guys,
GOLD and OIL both are quite Bullish due to current economic uncertainty.
Buy the dips and keep long term targets to 33, 35, and 40.
Note, any impulsive moves to the downside will be short-lived.
Ty

WTI CAPPING UP FRESH HIGHWith just four trading sessions left before the WTI June contract expires, in despite the total number of coronavirus cases reaching 4.5 million and 300k death reported worldwide by Johns Hopkins and the market, in general, ignoring the US unemployment claims close to 3 million, the oil price was able to capped to a fresh high. A whole trading week has cost the market to shatter its consolidation and finally break the $26 handle.
Market impulse can be attributed to the additional 1mb/d pledge cut from Saudi Arabia on Monday to take effect next month in the aim to support the stability of global oil markets, where concerns remain about the easing of the lockdowns leading to a second wave of COVID-19 cases that could profoundly impact the already crippled demand.
Moving on to the technical side, the chart indicates a clear bullish bias after the breakout of the flag formation in the D1 chart. Price action is currently trading above the 50EMA, fighting the resistance from previous high on April 3rd at 28.63 handle, with sufficient room for price action to manage and reach next golden Fibonacci level 6.18 where the bullish momentum in MACD and the RSI still far from the overbought level support the bias. However, we could expect a small correction and price re-testing the upper line from the flag as long as price action is not able to break the current level.\
This week probably close inarguably bullish, where the OPEC+ altogether with non-OPEC producers and their 6.6mb/d cuts response informed on the IEA’s monthly report has given the marker the need support for this roaring come back.

WTI US OIL Outlook : High chance of a SHORT OPPORTUNITYHELLO EVERYONE, FEEL FREE TO LIKE AND FOLLOW IF YOU LIKE MY IDEAS!
First of, H1 Time frame, shows a recent bearish double top pattern that lead to a sell off to the nearest support level @ 25.00. This is followed by a SHARP REJECTION at the resistance line @ 27.70, proving to be a tough barrier to break through.
WTI is now fighting in the 25.00 - 26.00 range
Possible Opportunities:
- An hourly candle CLOSE ABOVE 26.00 followed by bullish confirmation would see WTI retest the resistance of @ 27.70, giving us a possible LONG opportunity to 27.70
- A BREAKDOWN BELOW 24.50-25.00 area of support would see us a SHORT opportunity to TP1 @ 20.60, an area of major support
As always, remember to place your stop losses and good luck!
Regards,
Gol D Roger


OIL Break 20$ Support and NEXT 17.89$ FOR LONG.Many Reasons behind Oil continues dropping After OPEC cut Production.
1- Oil should stay above 20$ after Deal Cut, but look like price war still going on.
2-Demand is very low at the moment all over the country because of lockdown and Economy under the shutdown.
Coming weeks expecting Oil will do big correction upside end of April to mid-May, but before correction Oil could hit support level 2001 Year 16.90 to 17.26$
Good to long entry 18$ as major support level
🛑SUPPORT/RESISTANCE
✅S1= 17.25
✅S2=16.10
✴️R1=20.50
✴️R2=24.10
Please like, share, comments and follow me to get daily base analysis
Thank you for your support, I appreciate it.


CRUDE OIL (WTI) | Bearlish scenario The graphs of CRUDE OIL (WTI) and BRENT OIL are very similar. However, I want to show a separate scenario for CRUDE OIL (WTI
Scenario for BRENT is BELOW
____________________________
Guys, please hit the like button, and write any comment, this will be the best thanks from your side.
!!! Please, dont forget, the content on this analysis is provided for the sole purpose of assisting traders to make independent investment decisions. Do not trade this idea before you make your own analysis! !!!
______________________________


WTICOUSD ANALYSISOil price is now at important resistant level that we can see price bounce and come back down or break and go up after testing it. All key levels are drown in this chart. Please don't forget to follow this channel for more update. Like, Comment. Thank you :)

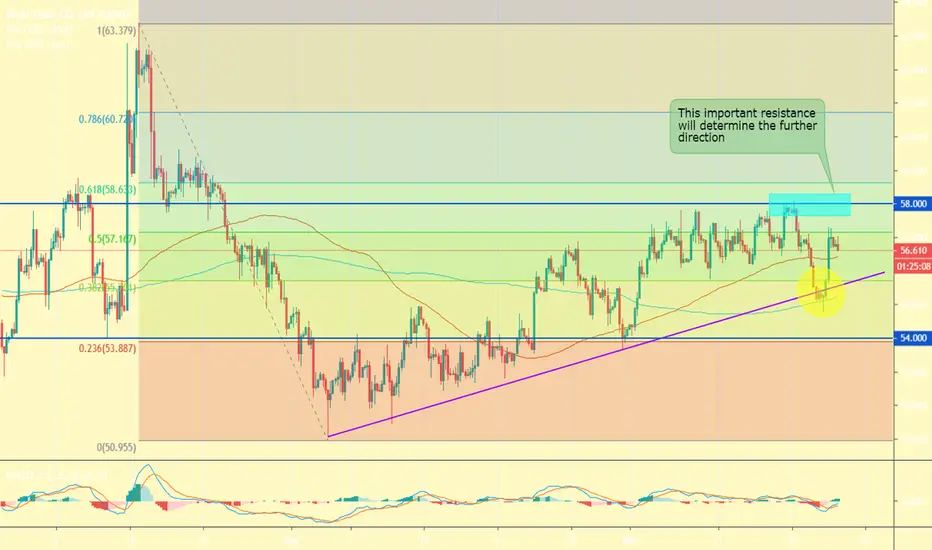
WTI Could Test $58 Key ResistanceOil posted its biggest percentage decline in nearly 2 months after reports indicated Russia is unlikely to lower production at the upcoming OPEC meeting. WTI dropped towards its 7-week support trend line, but after that rebounded from $ 55.00 and 200-day SMA on H4 chart.
Earlier on Wednesday, the EIA reported that overall Crude stocks rose 1.4 Mb, about in line with consensus for a 1.5 Mb. However, the market latched on to the fact inventories at Cushing fell 2.3 Mb barrels, the most significant drop in 3 months.
When you look out over the last couple of months, we essentially have been forming an uptrend and bullish channel, and as a result we could very easily go higher. The nearest resistance is near $57.17 at 50% Fibo level on the recent fall from 63.38 to 51.06 (4-hours). A clear break there will extend the rise for testing key resistance $58. It corespondent to the upper border of the current range. In that area the market could see a bit of market memory where sellers could come back in. Conversely, if the price fails to continue under $56.50, it could resume its decline.
Ultimately, we like the idea of buying short-term pullbacks. But we're looking for any type of major breakout in one direction or the other, since the market have found a bit of an equilibrium in the last month.
WTI Crude Oil bullish in the short-termWTI Crude Oil is moving within a bullish channel which in turn is located within larger rectangular congestion. Likely a retest of the resistance.


USOIL back in the wedgeHello oil traders! Finally seeing oil creeping back into the lower channel wedge to hopefully stay in consolidation for a little while longer. Will it stay? Only time will tell. I am expecting oil to return to $56 range before going any lower. I am also only expecting dramatic world news to affect any major movement before the end of the year. At this point I can't say which way it will go, but because demand worldwide is waning and with the climate change fanatics preaching against the evils of carbon-based fuels, I can only expect that prices will eventually fall. However, if you want to hedge your bet on oil for a nice long term gain, keep your eye on Aramco's IPO and when it hits the market, buy some. Aramco is the most profitable company in the world, raking in $111B in profits last year. That's more than most companies are worth. Have a great weekend!
