WTI (Crude Oil)

watch the channel for potential wave 4Recently Ucad has been quite stubborn. Therefore I look to oil to help make sense of it. what I'm looking at is a potential wave 4 forming on both the primary and intermediate degree. I' ( looking at further upside in oil prices up to around 67.15$ per barrel (next support level).


WTICOUSD SellHi All ,
Price broken down from rectangle range , with Bearish engulfing candle . Sell till next support as Tp1 and Tp2 D1 uptrend channel trendline .
Sl to entry .
Many Thanks.


OIL hitting resistance with double topOil has made a huge rally past months, without any corrections. I did not touch it for a while, but think we have a good chance this time to short it. More factors in favor now for the first time in a while.
The double top is something i saw yesterday, so unfortunately the entry is less great now, since it's already at the neckline of the double top. But that doesn't matter that much. For me this will be a swing trade and we have a good tight stop for this one, which is the high of the double top around 64.8/65. At the moment it looks like a flag at support, which is usually a very good sign. So i will try to short half at top of that flag on the right and the other half when support breaks of the neckline. First target will be around 60ish, don't know yet if more is possible.
Previous analysis:

Is another Long signal in the building?Seems WTICO is forming support here! Though we will have to wait for breakout.

Update CRUDE OIL: 7.238M barrel build - CAUTION... to finish after I was rudely cut off, options returns are a bell curve based on duration, you never want to hold them until expiry unless you are planning on taking delivery!
(*Note to tradingview - performance should increase for paid subscriptions)

WTI crude oil - daily chartI believe that achieved target of the wave b(261,80% of the wave a). Can reaches 361,80% Fibonacci.
Wave b, yet.

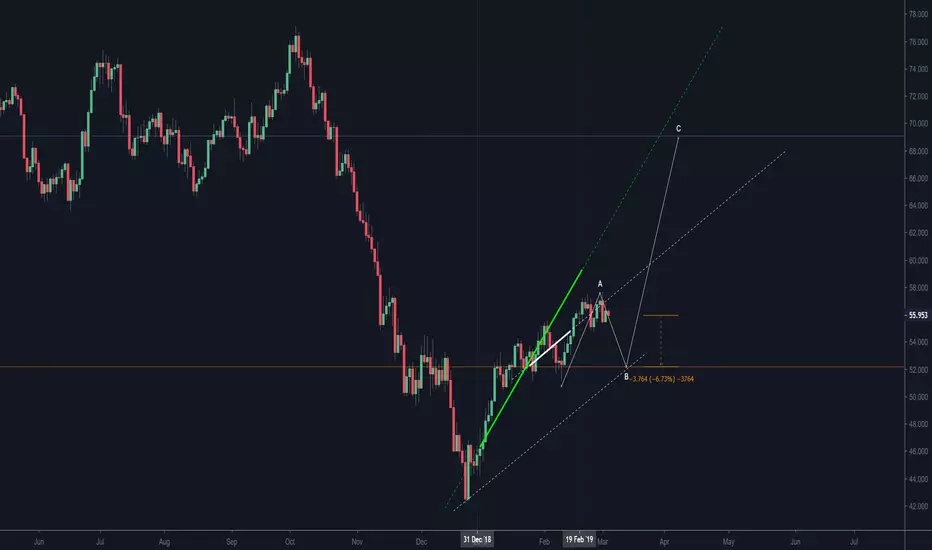
Update USOIL: $61.50 first, then $52Commodities are typically the last asset to peak during a cycle. We typically interest rates peak first, a couple of months later that followed by equities and a couple of months after equities we see commodities peak. Commodities such as crude oil, are part of the contraction phase in the cycle, the higher the price rises it begins to acts as a tax on consumers and that begins the early recession phase. For that reason, I have marked this rally in crude as a wave A of a bigger corrective pattern.

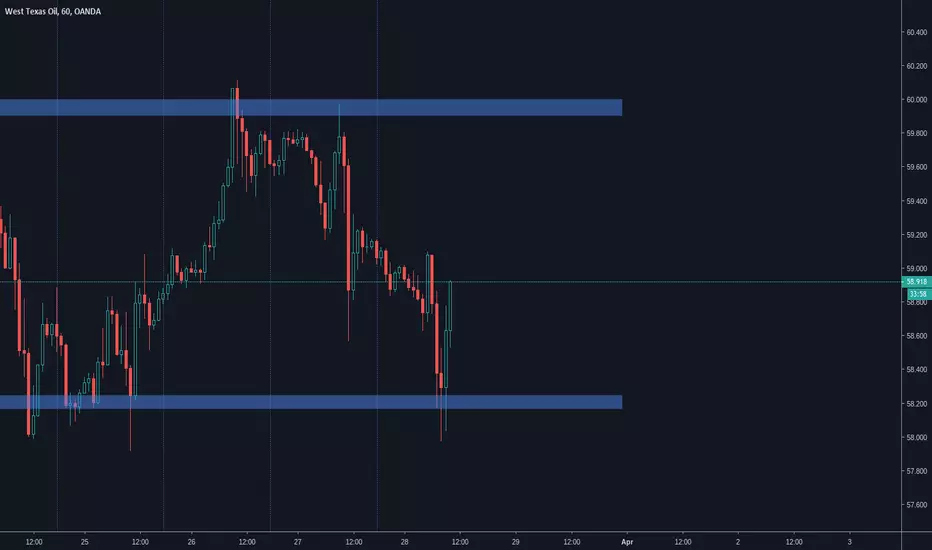
Downtrend ContinuationEntry was triggered around 58.80 and SL is set around 59.20. TP has yet to be determined but I do not expect support to hold should the trade go my way.
WTICOUSD came in major resistance zone.WTICOUSD came in major resistance zone. It is fibonacci 50% retracement.

OIl cleanest pattern-dropOil have , in my opinion , the cleanest form of reversal patterns, and its playng out !
We have ascending wihtin ascedning (double confirmation, stronger probability for drop )
This is definitely on my Watchlist for next week....
First target on bottom trend line , then scale-in and trail stops all the way to low where ascending started....
Even if 1$ per barrel drops, you could bank nice profits on 15 min entrys (flag continuations or something )

Long BiasOrders are accumulating and I expect the price to keep moving up until it tells me otherwise. Ideally a break below the range with signs of reversal would trigger a long position.

WTICOUSD, Continuous uptrend on H4: BUYH4:
- Structure: Uptrend
- Break resistance
- Above and pullback
-> waiting signal=> BUY


WTICOUSD TRADE SET UPThe wedge broke so expect price to move towards the two target boxes. After we hit target 1 move stop loss to break even.

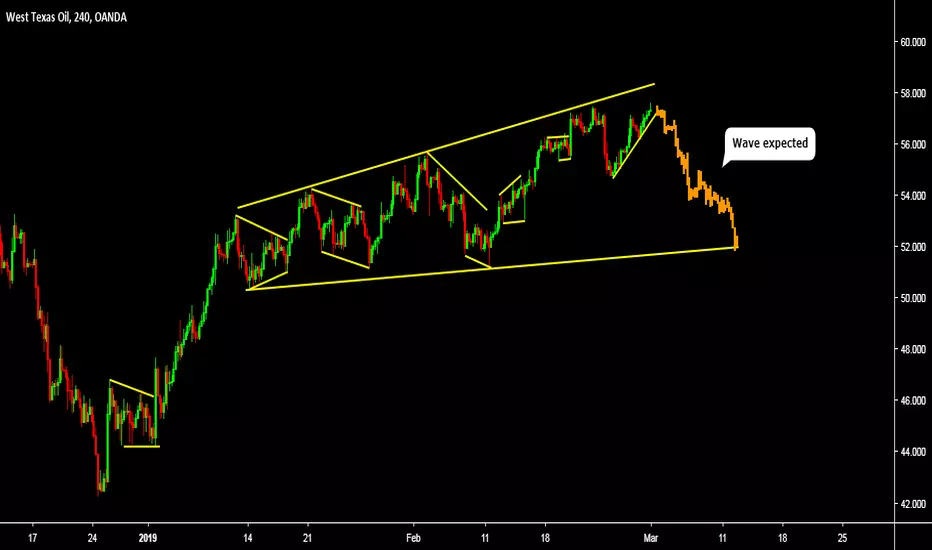
WTICOUSD 6.7% correction... The wave of the exchange rate (green line) is rising, so I assume that it is moving in the long run. The slope of the ATR axis (white line) decreases, leading to corrective movement. The WTI correction level is 52 usd. I'm looking forward to testing this back.
WTICO USD SELL (WEST TEXAS CRUDE OIL - US DOLLAR)Hi there. Price is forming a continuation pattern to the downside. Watch strong price action at the current price for sell.
WTICOUSD, Continuous uptrend: BUYH4:
- Structure: uptrend
- Test trendline
- Weakening
-> Pullback
-> Waiting signal=> BUY

