WTI (Crude Oil)

Are we looking at the biggest crash in the market??Based on my analysis I believe we are approaching another crash in the market, probably the biggest one yet..
NASDAQ is rising on hopes and dreams, FED are pumping money into it left right and center, and it has reached a new high. There is a considerable amount of divergence on EVERY time frame and yet price has barely gone down.
Dow Jones is approaching its previous highest high where it took a tumble
SP500 is also doing the same as DOW
And now OIL is reaching a point in the market where it previously crashed
I suspect Nasdaq will flutter around and consolidate until DJ30 / US500 and Crude OIL catch up and then everything will crumble at the same time.
I may be wrong but these are my thoughts on this madness

NYSE:WTI P-Modeling Pt 2. Harmonic Strings of The Illusive CajunWelcome Hyperspace Agent.
This is an analysis of WTI OIL.
In order to understand where we are now, you must see the entire time-series of Part One.
Press Play first.. Then View Snapshots In Order
Then scroll to see Time-Series Snapshots In order. This idea is from Sept 2019.
If you skip the step above.. you won't understand... how i progressed to what I am presenting now.
Or if you simply don't care.. That is perfectly ok! No one is forcing you.
But you prob won't get it either way. And if you do...? well.. gold star for youuu. .
_______________________________________________________________________________________________________
Nothing is placed randomly. The original idea *PART ONE* nailed the targets, but was incorrect on timing. However, once adjusted it can be viewed in Time-Series fashion how the targets were indeed hit quite in an interesting manner. Both Part One and Two are on the same time-frame. The inverted cup and handle was executed. It had a harmonic exit.. so my initial timing was off. This was validated with the snapshots in Part One. But then it deviated after completing the original harmonic goals.. So two propositions began to develop.
Proposition A is in the yellow trend.
Proposition B is in the Red trend.
We inch a tad higher? and Wham..Bam. Slapped down..
Catalyst.. Dropped demand of oil as USA and globe enters Wave Two of Covid-19. or
The idea is we have a second bottom. But a true Bottom. That is outlined in Proposition B. Adam and Eve as they may call it I guess?..
I think we are going to execute Proposition B. Mere Penny's.
However, keep an eye on proposition A and the structure of the chosen fractal vs the actualization of the trending.
It will not be exact... Not always at least. ;)
This is simply an update to see how the rest of the story plays out.
There is def a lot of validity to it. Now let's see if we can refine it further..
Trial and Error.
Failure is a necessary component of success.
Thanks for Pondering the Unknown with Me,
Glitch420

WTICO/USDOn USOIL we have broken an ascending channel and now price has formed a retest which coincides with a key level. Price has the potential to fall to the beginning of the structure, which would be at around $32 a barrel.


WTICOUSD 4H Bearish Crab Bearish Crab!
Giriş,hedef,stop grafik de! Yeşil alana gelmeden alım yapılmaz, geleceğinin de garantisi yok formasyon gerçekleşmeyebilir

OIL Bullish confirmedWe expected a sell position before, but price broke above the resistance at 40.55 and closed.
A buy position was confirmed with 44.30 as 1st TP.


USOIL Position Update (Revised Downside)Revised target for my short entry from the high $39's/BBL. Stoploss remains at breakeven from the original entry price accounting for spread and commission.
Original re-entry
14:25:24 (UTC)
Wed Jun 17, 2020

Brent Crude Oil Forecasted to New ATHsABCDE correction complete at E with divergence and upthrust therefrom.


WTICOUSD Ideas intraday tradingDisclaimer: Use paper trading, I take no responsibility for losing money based on this analysis.
You have support at 26.68 26.51 on small time frame for two small shorts.
On a long event when confirmed resistance at 27.26 and hard 27.42
So 2 long 2 shorts.
1. right now TP 26.67
2. short order at 26.60 tp at 26.51
3. long order after 1 and 2 at 26.83 TP 27.26
4. long order at 27.32 TP at 27.42
5. long order at 27.50 TP at 27.70

I am going long on WTICOUSDI a going long at market price on WTICOUSD with a TP: 20.280 and a SL: 19.300

WTICOUSD long term longTP: 20.857
SL: 19.705
at least 2 candles away on 4h timeframe
with 115 pips to TP from now

WTICOUSD probably time to short it at least short timeI guess it's probably time for a short.
TP: 18.996
SL: 19.450

WTICOUSD short term buying opportunityI would say there is a short term buying opportunity for at least 700 pips. What do you think? TP: 19,413; SL: 18,230


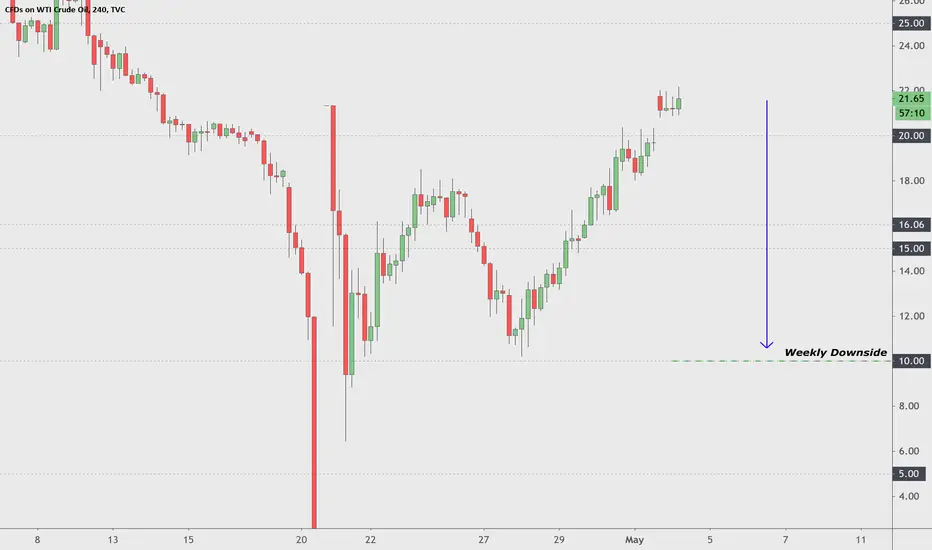
USOIL- Weekly Downside Target $10/bbl Downside target for WTI, with upper bounds reached, execution will happen within the equity session when servers hit.
Weekly downside 10$ a barrel.
WTICOUSD - Oil weekly. Is oil ready to pivot?4/17/2020 OIL weekly chart
All the talking heads are saying how the C-19 virus destroyed the Oil and etc.
The truth is the oil peaked in 2008 and it is looking to be completing a 5 wave structures down.
Currently the oil is in 19 handle
I can see Oil may go down to the 17 handle
I can also say see that Oil met the minimum requirement to begin moving up from this area.
EVERYONE was bullish when oil was $130-$140
EVERYONE is bearish now when WTI is $19.xx and USO is at $4


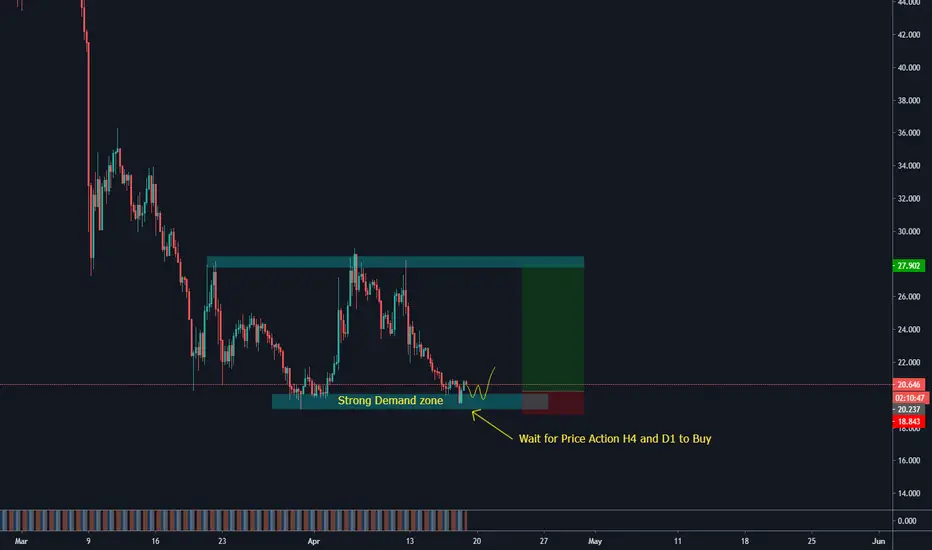
WTICOUSD - Oil is in Strong demand zone, wait signals to buyOil is in Strong demand zone, wait signals and price action to buy.
WTICOSUD West Texas Oil USD Double Bottom?West Texas Oil looking for a double bottom off the back of the Opec production deal - Target is around $37
