WTI(20250620)Today's AnalysisMarket news:
The Bank of England kept interest rates unchanged at 4.25%, and the voting ratio showed that internal differences were increasing. Traders expect the bank to cut interest rates by another 50 basis points this year.
Technical analysis:
Today's buying and selling boundaries:
74.33
Support and resistance levels:
77.40
76.25
75.51
73.15
72.40
71.26
Trading strategy:
If it breaks through 73.15, consider buying, and the first target price is 75.00
If it breaks through 72.40, consider selling, and the first target price is 71.26
Wticrude

The wealth code of crude oil is: low and long
💡Message Strategy
According to market research, Iran's crude oil export infrastructure has not been directly hit yet, and most of the impact is still concentrated on shipping. However, analysts pointed out that once the conflict spreads to the entire region, oil prices are likely to rise further.
The Strait of Hormuz has become the market's biggest concern. It is the throat of about one-fifth of the world's crude oil supply. Although there is no sign that Iran is trying to block the channel, any escalation of the situation may pose a serious threat to the global energy supply chain.
"Trump's threat to Iran's supreme leader shows that diplomatic channels are no longer effective," said Charu Chanana, chief investment strategist at Saxo Financial Markets Ltd. in Singapore. "If Iran's exports are interrupted, or even in the worst case scenario such as the Hormuz blockade, oil prices may soar rapidly."
The rise in geopolitical risks has also triggered turmoil in financial markets, with investors turning to safe-haven assets such as gold, and the volatility of the crude oil market has hit a three-year high. At the same time, crude oil producers have stepped up hedging operations, and futures and options trading volumes have surged.
The latest API crude oil inventory data showed that U.S. crude oil inventories fell sharply last week, further reinforcing market expectations of tight supply. According to data released by the American Petroleum Institute (API) in the early hours of June 18, U.S. crude oil inventories fell by 11 million barrels in the week ending June 14, far exceeding market expectations of a decline of 2.5 million barrels, marking the largest weekly drop since August last year.
📊Technical aspects
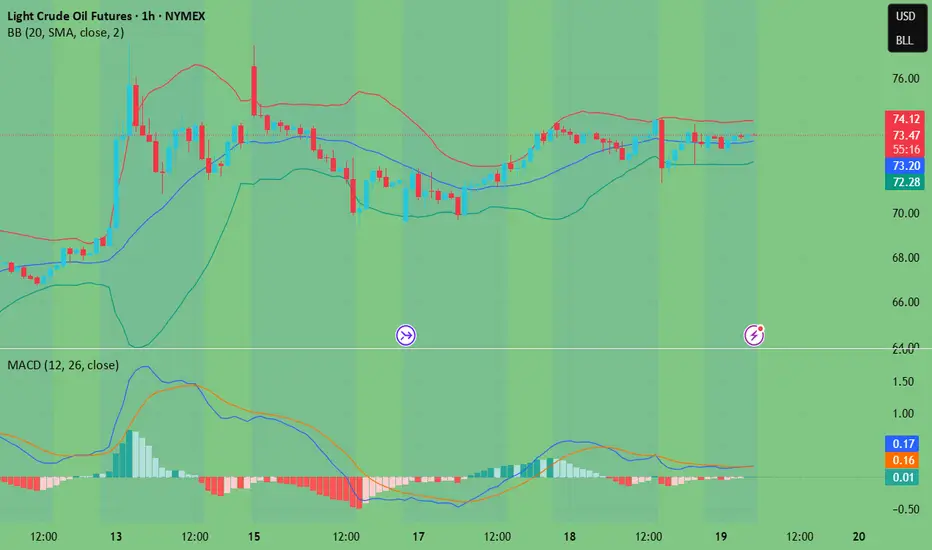
From a technical perspective, the daily chart of US crude oil (WTI) shows a clear bullish trend. After breaking through the previous high of $72, the price quickly rose and stabilized above $75, showing strong upward momentum. The current K-line has closed with long positive lines, and the red column of the MACD indicator has expanded, and the fast and slow lines have crossed, indicating that the bullish momentum continues to increase.
At the same time, the price has moved away from the 20-day and 50-day moving averages. There is a possibility of a technical correction in the short term, but the overall trend is still upward. If the geopolitical situation continues to be tense, the target may be raised to $77.5 or even the integer mark of $80, and the support will focus on the vicinity of $72.50.
💰 Strategy Package
Crude oil has reached our upward target of 74.00 yesterday and fell back. The current upward pressure on crude oil is around 75.50. If it breaks through upward, it will soon reach our second target of 77.50.
rend: Upward trend
Support: Around 72.50
Resistance: Around 75.50
Long Position:72.00-72.50,SL:71.50
The first target is around 75.00
The second target is around 77.50

WTI(20250619)Today's AnalysisMarket news:
Fed's June meeting - kept interest rates unchanged for the fourth time in a row, and the dot plot showed two rate cuts this year, but the number of officials who expected no rate cuts this year rose to 7, and the rate cut expectations for next year were cut to 1. Powell continued to call for uncertainty, and the current economic situation is suitable for waiting and watching. He also expects tariff-driven inflation to rise in the coming months.
Technical analysis:
Today's buying and selling boundaries:
72.69
Support and resistance levels:
75.60
74.51
73.81
71.58
70.88
69.79
Trading strategy:
Upward breakthrough of 73.81, consider entering the market to buy, the first target price is 74.51
Downward breakthrough of 72.69, consider entering the market to sell, the first target price is 71.58
The best opportunity is when crude oil falls
💡Message Strategy
Crude oil futures fell in the European session on Monday (June 16), giving up earlier gains, as a new round of hostilities between Israel and Iran had limited impact on oil production and exports.
WTI briefly rebounded to $77.49, close to last week's high, which was also our second profit target, but failed to break through the key resistance level near $78.09.
Oil prices surged 7% on Friday, driven by geopolitical risks, pushing crude to its highest level since January. However, Monday's reversal reflected the lack of immediate threats to supply routes, especially the strategically important Strait of Hormuz.
If Iran's production drops sharply due to the conflict, the global oil supply buffer will be quickly exhausted and oil prices may usher in a new round of surges. Faced with this complex situation, investors, oil-producing countries and consumers need to be prepared to meet the possible energy storm.
This is also the reason why we repeatedly emphasize that crude oil should be long when it falls. We can foresee its upward momentum, and the pullback is only in a moment without any signs.
📊Technical aspects
The short-term (1H) trend of crude oil continued to fluctuate upward, and the price near 74 was tested. The moving average system relies on the bullish arrangement of oil prices, and the short-term objective trend direction remains upward.
In the morning, the oil price hit a new high near 75.30, and then fell back and closed with a negative real candlestick. The short-term momentum is still bullish, and it is expected that the trend of crude oil will continue to maintain a high-level oscillating upward rhythm.
💰 Strategy Package
Long Position:69.50-70.50
The first target is around 73.00
The second target is around 75.00

WTI - ANALYSIS BUY AREA This week the ongoing conflict seems to bring more uptrend to this commodity
I believe that the last broken resistance now turning support at 67.300 will be tested prior to the OIL raising again
If the conflict doesn’t end and we don’t have a ceasefire we could see this commodity running to the 78.000 and 82.000 levels

WTI Crude Oil Regains Bullish MomentumWTI Crude Oil Regains Bullish Momentum
WTI Crude oil prices climbed higher above $70.00 and might extend gains.
Important Takeaways for WTI Crude Oil Price Analysis Today
- WTI Crude oil prices started a decent increase above the $65.00 and $68.50 resistance levels.
- There is a major bullish trend line forming with support at $71.50 on the hourly chart of XTI/USD at FXOpen.
Oil Price Technical Analysis
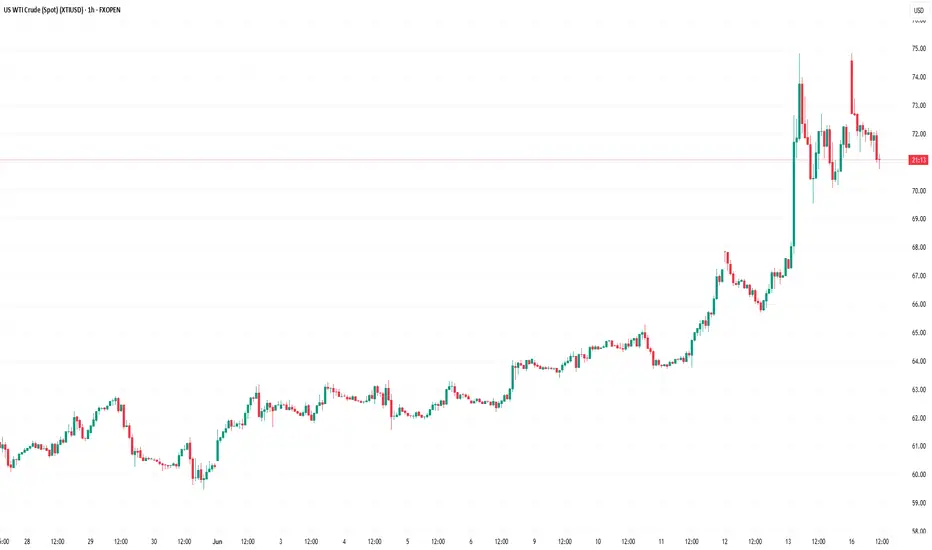
On the hourly chart of WTI Crude Oil at FXOpen, the price started a decent upward move from $65.00 against the US Dollar. The price gained bullish momentum after it broke the $68.50 resistance and the 50-hour simple moving average.
The bulls pushed the price above the $69.50 and $71.50 resistance levels. The recent high was formed at $74.80 and the price started a downside correction. There was a minor move below the 50% Fib retracement level of the upward move from the $69.55 swing low to the $74.83 high.
The RSI is now below the 60 level. Immediate support on the downside is near the $71.50 zone. There is also a major bullish trend line forming with support at $71.50 and the 61.8% Fib retracement level of the upward move from the $69.55 swing low to the $74.83 high.
The next major support on the WTI crude oil chart is near the $69.50 zone, below which the price could test the $67.90 level. If there is a downside break, the price might decline toward $65.20. Any more losses may perhaps open the doors for a move toward the $63.75 support zone.
If the price climbs higher again, it could face resistance near $72.50. The next major resistance is near the $74.80 level. Any more gains might send the price toward the $78.50 level.
This article represents the opinion of the Companies operating under the FXOpen brand only. It is not to be construed as an offer, solicitation, or recommendation with respect to products and services provided by the Companies operating under the FXOpen brand, nor is it to be considered financial advice.
WTI(20250616)Today's AnalysisMarket news:
Trump: The United States may still intervene in the Iran-Israel conflict. If Iran launches an attack on the United States, the United States will "fight back with all its strength on an unprecedented scale." Iran and Israel should reach an agreement.
Technical analysis:
Today's buying and selling boundaries:
71.11
Support and resistance levels:
78.59
75.79
73.98
68.24
66.43
63.64
Trading strategy:
If the price breaks through 73.98, consider buying in, the first target price is 75.79
If the price breaks through 71.11, consider selling in, the first target price is 68.24

Crude oil is the ultimate winner
💡Message Strategy
Currently trading around $70.00 a barrel during Friday's European session, crude oil prices surged on growing concerns about supply disruptions. Rising tensions in the Middle East threaten navigation through the Strait of Hormuz, a key passage for about 20% of global oil shipments.
📊Technical aspects
From the daily chart level, crude oil prices in the medium term broke through the upper resistance of the range and tested a new high of 75.50. The moving average system is in a bullish arrangement, and the medium-term objective trend is upward.
The current trend is in the upward rhythm of the main trend. The MACD indicator fast and slow lines overlap with the bullish column above the zero axis, indicating that the bullish momentum is currently full, and it is expected that the medium-term trend is expected to usher in a wave of rising rhythm.
The short-term (1H) trend of crude oil continued to fluctuate upward, and the price near 74 was tested. The moving average system relies on the bullish arrangement of oil prices, and the short-term objective trend direction remains upward. Oil prices hit a new high near 75.30, and then fell back and closed with a negative real candlestick. The short-term momentum is still bullish, and it is expected that the trend of crude oil will continue to maintain a high-level oscillation upward rhythm.
💰 Strategy Package
Long Position:70.09-71.50

Oil Price Rally Stalls at $77.72, Just Below 2025 HighFenzoFx—Oil prices resumed their bullish trend, accelerating after geopolitical tensions in the Middle East. The rally paused at $77.72, just below the 2025 high.
RSI 14 indicates an overbought market, while volume accumulation at $73.7 suggests possible sell orders. A consolidation phase is likely before further gains.
If oil pulls back, key demand zones at $64.00 and $66.00 offer bullish opportunities, with a potential move toward the 2025 high at $80.59.

Oil prices surge amid Middle East turmoil
💡Message Strategy
WTI prices climbed to a nearly two-month high, weighed down by rising geopolitical tensions in the Middle East.
📊Technical aspects
From the daily chart level, crude oil's medium-term trend is upward around the moving average system, and the medium-term objective trend is mainly oscillating upward. Oil prices gradually rise to the upper edge of the range.
From the perspective of momentum, the MACD indicator fast and slow lines cross the zero axis upward, and the bullish momentum begins to warm up. The K line closes with a small positive line continuously. If the oil price breaks through the range resistance in the later period, the medium-term trend is expected to further rise and test the 80 line.
The short-term (4H) trend of crude oil fluctuated upward and hit a new high of 70. The moving average system is arranged in a bullish pattern, and the short-term objective trend direction remains upward. The K-line closed with a large real positive line in the early trading, showing an upward main trend.
The MACD indicator opened upward above the zero axis, and the bullish momentum was dominant. It is expected that the crude oil trend will continue to break upward during the day.
💰 Strategy Package
Long Position:70.00-72.20,Target 75.50

wti looking for reversalSwing trade
Wti looking for reversal 3 Major bull points
Trend reversal
Rsi divergence
Reversal chart pattern Head and shoulder
Manage your risk before putting trade on real account

USOIL CRACK!Usually, these types of events are great selling opportunities as they are short-lived. However, this time may be different.
I would expect a pullback then if it lasts and escalates a breakout. For now, just observe, have patience, and look for the 2nd crack!
If it cracks a 2nd time, it is definitely not good for US inflation.

WTI(20250613)Today's AnalysisMarket news:
The number of initial jobless claims in the United States for the week ending June 7 was 248,000, higher than the expected 240,000, the highest since the week of October 5, 2024. The monthly rate of the core PPI in the United States in May was 0.1%, lower than the expected 0.30%. Traders once again fully priced in the Fed's two interest rate cuts this year.
Technical analysis:
Today's buying and selling boundaries:
66.96
Support and resistance levels:
69.10
68.30
67.78
66.13
65.61
64.81
Trading strategy:
If the price breaks through 67.78, consider buying in, and the first target price is 68.30
If the price breaks through 66.96, consider selling in, and the first target price is 66.13

Crude oil is expected to break through the $68.00 mark
💡Message Strategy
WTI crude oil futures prices soared during the European session on Wednesday (June 11), continuing Tuesday's gains, but failed to reach the important level of $66.45. Currently, bulls are focusing on whether they can clearly break through the technical resistance level to confirm the continued upward trend.
OPEC+ plans to increase production by 411,000 barrels per day in July, the fourth consecutive month of increase. Its impact on global supply may be weakened. Domestic demand in Saudi Arabia and other OPEC+ members may increase in the summer, helping to absorb the additional supply. According to Capital Economics, this internal consumption may support oil prices in the short term by offsetting the increase in supply.
China-US trade truce boosts risk appetite, but demand questions remain
WTI hit a seven-week high, reflecting the recovery of market risk appetite after the China-US trade negotiations. The two sides have agreed on a framework for restarting the trade truce and easing rare earth export restrictions, boosting market sentiment.
📊Technical aspects
Oil price forecast: Bullish bias strengthens above key resistance level
If the bears regain control, $64.50 will be seen as the near-term support. A successful break above $66.75 could open up space for the next major upside target near $67.50.
Supported by geopolitical tensions, easing trade concerns and stable demand fundamentals, the outlook for crude oil remains bullish, provided that WTI can close above $66.75.
If a breakout is confirmed, it may attract new buying and push prices towards the $68 mark. However, if the current gains cannot be maintained, oil prices may fall back to the $64.50 range.
💰 Strategy Package
Long Position: 64.50-65.00,65.00-65.30

WTI(20250612)Today's AnalysisMarket news:
① The EU hopes that the trade negotiations will be extended beyond the suspension period set by Trump. ② Bessant: As long as "sincerity" is shown in the negotiations, the Trump administration is willing to extend the current 90-day tariff suspension period beyond July 9. ③ Trump will hold multiple bilateral talks during the G7 summit. ④ The total customs revenue of the United States in May reached a record high of US$23 billion, an increase of nearly four times year-on-year. ⑤ Lutnick: One deal after another will be reached.
Technical analysis:
Today's buying and selling boundaries:
66.02
Support and resistance levels:
69.56
68.23
67.38
64.66
63.80
62.47
Trading strategy:
If the price breaks through 67.38, consider buying in, and the first target price is 68.23
If the price breaks through 66.02, consider selling in, and the first target price is 64.66

Crude oil rose as expected
💡Message Strategy
OPEC’s crude output increase in May was lower than required by the OPEC+ agreement, which had planned to increase production sharply last month.
The five OPEC members that pledged to cut production in the OPEC+ agreement and are now gradually lifting the cuts had to increase production by a combined 310,000 barrels per day, but according to data from oil flow tracking companies and surveys of sources at OPEC, oil companies and consultancies, they only increased production by 180,000 barrels per day.
This was because Iraq cut production to make up for a long period of overproduction, while Saudi Arabia and the UAE increased production by less than their target levels, the survey found.
Saudi Arabia had the largest increase in May compared to April. According to the survey, OPEC's largest producer and de facto leader, as well as the leader of the OPEC+ alliance, increased production by 130,000 barrels per day.
This is also one of the driving forces accelerating gold's rise
📊Technical aspects
WTI crude oil prices finally extended their upward momentum. However, crude oil prices have risen as tensions in the US-China trade war ease and global oil demand recovers from tariff-related pressures.
From the daily chart level, crude oil's medium-term trend is hovering around the moving average system, and the medium-term objective trend is mainly fluctuating and rising. Oil prices gradually rise to the upper edge of the range. From the perspective of momentum, the MACD indicator fast and slow lines cross the zero axis upward, and the bullish momentum begins to warm up. The K line closes with a small positive line continuously. If the oil price breaks through the range resistance in the later period, the medium-term trend is expected to further rise and test the 70 line
The short-term (2H) trend of crude oil continued to rise. The oil price encountered resistance near 65.40, and the K-line crossed the moving average system, and the short-term objective upward trend changed. The second large real negative line formed the main rhythm. It is expected that the crude oil trend will further fall to around 64.50 during the day, and then restart the upward momentum.
💰 Strategy Package
Long Position: 64.50-65.00,65.00-65.30

WTI Crude Oil Stalls At Technical JunctureCrude oil has enjoyed a decent rally in recent weeks thanks to improved sentiment and OPEC+ scaling back production. Yet momentum turned against bulls on Tuesday, despite positive trade talks between the US and China. Today I discuss whether this could be a turning point for oil, or simply a bump in the road.
Matt Simpson, Market Analyst at City Index and Forex.com

USOIL Trade Setup: Watching for a Bullish Break After Pullback 📈 US OIL Trade Plan
Currently, USOIL is in a strong bullish trend 🔥 — price action has pushed into overextended territory, which opens the door for a potential pullback 🌀.
I'm watching for a WTI retracement into equilibrium, ideally aligning with the 50%–61.8% Fibonacci levels from the previous swing low to high 🔍📉. If price corrects into that zone and we find support, followed by a bullish break in market structure 💥 — that would be the confirmation I’m waiting for to consider a long position 🚀.
⚠️ Key Level to Watch: That structure break is the trigger — no confirmation, no trade 🧠.
⚠️ Disclaimer:
This content is for educational and informational purposes only and should not be considered financial advice. Always conduct your own analysis and consult a professional before making trading decisions. Trade responsibly.

The trend after the surge in crude oil prices
💡Message Strategy
Core economic data and event-driven
The US employment report boosted expectations of rate cuts. According to the US Department of Labor, the unemployment rate stabilized at 4.2% in May, and 139,000 new non-farm jobs were added (the previous value was revised down). Phil Flynn, senior analyst at Price Futures Group, pointed out: "The employment data is 'just right', neither too hot nor too cold, but it strengthens the possibility of the Fed's rate cut." The expectation of a rate cut is seen as a potential positive for the crude oil market, as loose policies may stimulate economic recovery and boost oil demand.
OPEC+ moderately increased production to balance market expectations. OPEC+ reached an agreement on Saturday to increase production by 411,000 barrels per day in July, which is lower than Saudi Arabia's proposal, but in line with market expectations. HSBC analysts believe: "Summer oil demand will peak in July-August, matching the increase in OPEC+ supply, and the market supply and demand will tend to balance in the second and third quarters." The decision did not suppress oil prices, but instead eased concerns about oversupply.
📊Technical aspects
WTI crude oil: closed at $64.73 per barrel on Friday, up 2.21% on the day and 6.55% this week. It is about to reach our strategic target of 65.00. When everyone is looking at the decline of crude oil, our strategy is firmly on the rise, and the result is consistent with our direction.
From a technical perspective, the daily chart of US crude oil (WTI) shows that the price is running in a short-term rising channel, with support at around $63, while the upper resistance is concentrated in the $64.50 area. In recent trading days, WTI has received support at the 60-day moving average and successfully broke through the 20-day moving average, indicating that the short-term bullish momentum is gradually increasing.
At the same time, the MACD indicator shows a golden cross signal, and the momentum column continues to expand, indicating that the price is expected to further test the $65 mark. If the resistance level can be effectively broken, the next target may be $67.
💰 Strategy Package
Long Position: 63.50-64.00

WTI(20250609)Today's AnalysisMarket news:
Fed Harker: Amid uncertainty, the Fed may still cut interest rates later this year. Musallem: There is a 50% chance that the trade war will lead to a sustained inflation outbreak. Tariffs may push up inflation within one or two quarters. The ECB cut three key interest rates by 25 basis points. Lagarde hinted that the rate cut cycle will end, and the market is no longer fully pricing in another 25 basis point rate cut this year.
Technical analysis:
Today's buying and selling boundaries:
63.43
Support and resistance levels:
65.29
64.60
64.14
62.71
62.26
61.56
Trading strategy:
If the price breaks through 64.14, consider buying in, with the first target price of 64.60
If the price breaks through 63.43, consider selling in, with the first target price of 62.71

Crude oil pullback bullish trend
💡Message Strategy
Saudi price cuts and OPEC+ supply adjustments affect market sentiment
Crude oil came under pressure in the middle of the week after Saudi Arabia cut its July sales price to Asia to the lowest level in nearly two months. This follows OPEC+'s decision to increase production by 411,000 barrels per day in July, indicating that major oil producers are still prioritizing market share even amid volatile demand signals. This coordinated move by Saudi Arabia and Russia is seen as an attempt to constrain overproducers and strengthen control over global supply dynamics.
Refineries drive crude stock draw, but fuel demand lacks
Weekly data from the U.S. Energy Information Administration (EIA) delivered mixed messages. U.S. crude stockpiles fell by 4.3 million barrels to 436.1 million barrels, driven by a sharp increase in refinery runs, exceeding expectations. Utilization rose to 93.4%, indicating that refineries are preparing for a seasonal peak in demand. Adding to the bullish signal from the crude stock draw.
📊Technical aspects
On the technical side, the daily chart of WTI crude oil shows that oil prices have been under pressure for three consecutive trading days and are currently trading above the 20-day and 50-day moving averages, reflecting the dominance of short-term bullish sentiment. The MACD indicator shows a dead cross and the momentum column is enlarged, indicating that the upward trend is still continuing.
In the previous post, we have pointed out that the upward target and trend of crude oil have been reached. The main theme of crude oil in the future will still be a bullish correction.
💰 Strategy Package
Long Position: 62.50-63.00

Crude oil-----Sell near 64.00, target 63.00-62.00Crude oil market analysis:
Crude oil is still bearish, and we will continue to sell on rebounds. If it does not break 65.00, it will fluctuate. The general trend is bearish. If it breaks, we will adjust our thinking. Today's crude oil is the key. Will it start to take off before the data? The previous crude oil inventory data did not allow crude oil to break the position. The crude oil fluctuation range is 60.00-65.00. If it breaks this range, we will adjust our thinking on fluctuations.
Operational suggestions
Crude oil-----Sell near 64.00, target 63.00-62.00

WTI(20250606)Today's AnalysisMarket news:
The European Central Bank cut three key interest rates by 25 basis points. Lagarde hinted that the rate cut cycle will end, and the market is no longer fully pricing in another 25 basis point rate cut this year.
Technical analysis:
Today's buying and selling boundaries:
62.58
Support and resistance levels:
63.97
63.45
63.12
62.05
61.71
61.19
Trading strategy:
If the price breaks through 63.12, consider buying, and the first target price is 63.45
If the price breaks through 62.58, consider selling, and the first target price is 62.05
