The U.S. reveals a trick up its sleeveA few weeks ago, we expressed our bewilderment at the U.S. administration and its handling of the oil stockpiles. Despite oil plummeting below $70 during the summer, officials did not take the initiative to refill the Strategic Petroleum Reserves (also canceling plans to buy oil in July 2023), prompting us to speculate about what trick the administration could have up its sleeve. Finally, last week, we might have discovered exactly what it was when news erupted that the United States lifted some of the sanctions on Venezuela, allowing it to produce and export oil to its chosen markets for the next six months without limitation.
While Venezuela’s oil production is only about 800,000 barrels per day, the news announcement is still quite a big thing as it will enable U.S. entities to buy crude oil and help alleviate rising crude oil prices (especially if the country ramps up production in the coming months and the global economy continues to slow down - presuming no broad conflict will affect oil supply in the Middle East).
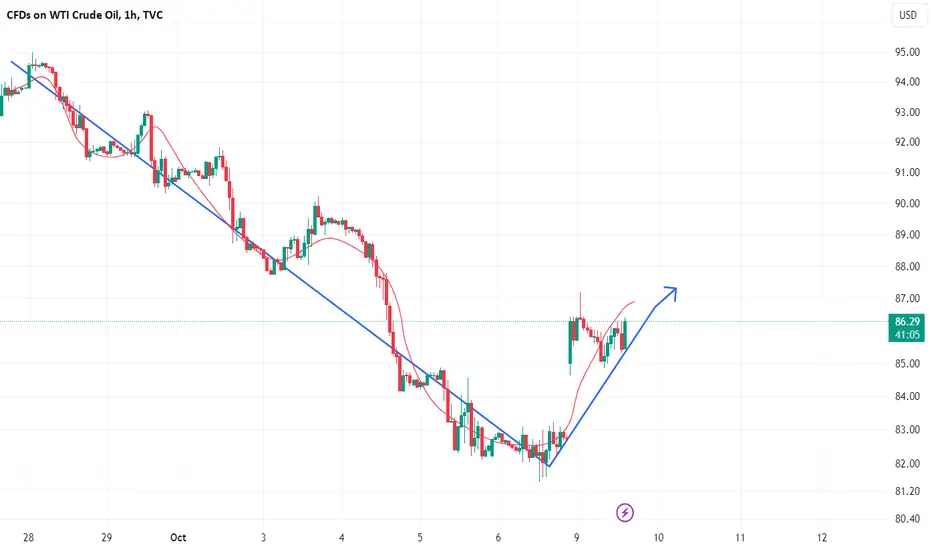
Now, on the topic of technicals, we are paying close attention to the Sloping Support/Resistance. If the price breaks back above the resistance (and holds the ground), it will be bullish. However, a failure will raise our skepticism about more upside. In addition to that, we are watching MACD, RSI, and Stochastic on the daily chart. To support a bearish case, we would want to see all of them continue declining. Contrarily, to support a bullish case, we would like to see MACD reversing and breaking above the midpoint.
Illustration 1.01
Illustration 1.01 shows the daily chart of USOIL and a simple setup with bullish prospects above the sloping support/resistance and bearish prospects below it.
Illustration 1.02
Illustration 1.02 displays the daily chart of MACD. The yellow arrow indicates a bearish breakout below the midpoint. If MACD fails to rebound back into the bullish area above zero, it will raise the odds for a continuation lower.
Illustration 1.03
Illustration 1.03 shows the daily chart of USOIL and simple moving averages. The yellow arrow indicates an impending bearish crossover between the 20-day SMA and the 50-day SMA. If successful, it will bolster a bearish case.
Technical analysis
Daily time frame = Bearish (with weak trend)
Weekly time frame = Slightly bearish
Please feel free to express your ideas and thoughts in the comment section.
DISCLAIMER: This analysis is not intended to encourage any buying or selling of any particular securities. Furthermore, it should not be a basis for taking any trade action by an individual investor. Therefore, your own due diligence is highly advised before entering a trade.
Wticrudeoil

Swing trade long for WTIWe saw the pullback into the support area we were waiting for, around the 200-dar EMA on the 4hour chart and weekly pivot point. A bullish engulfing candle also formed at the end of the session, and whilst prices have gapped lower at the open, we're now looking to enter long and target the resistance zone around $90.

WTI CRUDE OIL Buy on this Falling Support. Sell below.WTI Crude Oil hit the Falling Support, the 3rd time making contact with and turns into a short term buy. Target 89.75 (Resistance A at 89.80).
The medium term pattern is a Channel Up so id the Falling Support fails, take the small loss and wait for the bottom of the Channel Up to breaks. Sell and target 79.00 (1week MA50).
A bearish reversal is quite probable at the moment since the 4hour MACD is on a strong Bearish Cross.
Follow us, like the idea and leave a comment below!!

WTI OIL Channel Up. Short-term sell opportunity.WTI Oil (USOIL) got heavily rejected following our sell signal (see chart below) earlier this month (October 02) after failing to close above the 12-month Double Top:
This long-term bearish trade is still valid but on the short-term (4H time-frame) we see another sell opportunity in the making. The Channel Up that is emerging after the price got rejected on the 4H MA200 (orange trend-line) calls for a sell back to the bottom (Higher Lows trend-line) of the pattern. Our target is 83.50 (-5.66 bearish leg as the one before it).
The 4H MACD is about to form a Bearish Cross so if the price breaks below the (dashed) Higher Lows trend-line, we will sell the break-out and target the 1W MA50 (red trend-line) at 78.50 (just above Support 1).
-------------------------------------------------------------------------------
** Please LIKE 👍, FOLLOW ✅, SHARE 🙌 and COMMENT ✍ if you enjoy this idea! Also share your ideas and charts in the comments section below! This is best way to keep it relevant, support us, keep the content here free and allow the idea to reach as many people as possible. **
-------------------------------------------------------------------------------
💸💸💸💸💸💸
👇 👇 👇 👇 👇 👇

WTI Long Trading SignalIsrael-Hamas Conflict Fuels Uncertainty in Crude Market. Oil prices rise amid Israel-Hamas conflict, with risks of surpassing $100 and potential U.S. sanctions on Iran adding to market volatility.
1. The price closed above the Trend Magic Indicator line. Strong long signal.
2. Vortex will cross and indicates strong uptrend signal.
SL - below the Trend Magic Indicator line or Vortex indicator change trend direction signal
TP- 94.90
Keep It Simple and Always Trade With the Trend!
Please, Support Our Work with Like & Comment! Thank You!

WTI CRUDE OIL Buy SignalWTI Crude Oil hit twice the Rising Support and today is having the strongest green (1d) candle in 5 months.
This is a buy signal assuming the line holds.
Trading Plan:
1. Buy on the current market price.
2. Sell if the price closes a (1d) candle under the Rising Support.
Targets:
1. 95.00 (Resistance 1).
2. 78.00 (little over Support 2).
Tips:
1. The RSI (1d) is crossing over its MA line. If we close above, then it will be like the August 29th bullish break out.
Please like, follow and comment!!
Notes:
Past trading plan:

A new conflicts roils the oil marketOver the weekend, a new conflict broke out in the Middle East after Hamas, a designated terrorist organization, initiated an assault on Israel. This attack is already roiling the oil market, which saw oil prices rise more than 5% after the futures market opened. However, it is possible the impact has not been fully felt yet, considering the potential for further escalation amid Iran’s involvement in the preparations for the attack. Such developments could lead to broader conflict in the region responsible for producing one-third of global supply. That, in turn, could send the oil price much higher from the current levels (likely toward $100 and potentially even higher). As a result, we are closely monitoring the situation and will update our thoughts with the emergence of new events.
Illustration 1.01
Illustration 1.01 shows the daily chart of USOIL. The yellow arrow indicates an opening gap. If the gap fails to be filled, it will bolster a bullish case for oil in the short term.
Illustration 1.02
Illustration 1.02 displays the daily chart of USOIL and two simple moving averages. The yellow arrow indicates the initial return of the price in the upward-sloping channel (after the market opened). It will be bullish if the price re-enters the channel again and holds above the lower bound.
Illustration 1.03
The picture above portrays the daily chart of MACD. If it fails to break below the midpoint and starts flattening, it will be a bullish sign.
Technical analysis
Daily time frame = Slightly bearish
Weekly time frame = Neutral
Please feel free to express your ideas and thoughts in the comment section.
DISCLAIMER: This analysis is not intended to encourage any buying or selling of any particular securities. Furthermore, it should not be a basis for taking any trade action by an individual investor. Therefore, your own due diligence is highly advised before entering a trade.

WTI trade analysis
Over the past weekend, conflicts in the Middle East shook the market, and oil prices jumped on Monday (October 9). News from Israel has been dominating Asian markets, with the usual safe havens finding bids. Oil prices led the gains, with Brent and U.S. crude rising as much as 5%, at a time when oil prices retreated slightly.
It is recommended that crude oil rebounds from 86.2-86.7 and shorts in batches, with a stop loss of 87.3 and a target of 84.7-83.0; hold if the position is broken;
It is recommended to go long in batches when crude oil hits 83.5-83.0 for the first time, with a stop loss of 82.5 and a bullish target of 84.2-84.8;
WTI CRUDE OIL Important bearish breakout. Short the spike.WTI Crude Oil crossed under the 1D MA50 (and the Channel Up) for the first time since July 6th turning the 1D technical outlook bearish (RSI = 35.225, MACD = -0.060, ADX = 34.325). The short term timeframes are oversold so expect a minor spike to the 1D MA50 or near the 4H MA50. We will use that as our new sell entry and target the strong support zone consisting of the S1 level, the 1W MA50 and 1D MA200 (TP = 78.50).
Prior idea:
## If you like our free content follow our profile to get more daily ideas. ##
## Comments and likes are greatly appreciated. ##

WTI OIL Rising prices are here to stay for years to comeUnderstanding WTI Oil (USOIL) on the larger, long-term time-frames such as the 1W or 1M charts can broader your perspective and allow you to consider market dynamics that you never thought they were possible to affect the trend. From time to time we tend to make such studies in order to give you an idea of how the long-term trend may be shaped. Example of such pieces of publications include the following, where a slow down on the Oil rise allowed us to realize that inflation peaked and get a timely sell:
Or the following that got as a timely buy while the price was still at $69.20 to target $100 after a break above the 13 year Lower Highs Resistance:
** Why is Oil rising now? **
On today's study we look into the 1M time-frame and attempt to explain the current non-stop rise (completed 4 straight green 1M candles) that has taken most of the market by surprise. Let's start by acknowledging that it started on strong foundation as the 1M MA50 (blue trend-line) held on 3 separate tests. The 1M MA100 (green trend-line) that was formerly the Resistance (had 2 emphatic rejections on June and October 2018) since October 2014, has been holding as Support since the April 2021 bullish break-out.
** The MA levels, Inflation and comparison with DotCom **
At the same time it is the first time we have all three 1M MA50, 1M MA100 and 1M MA200 (orange trend-line) squeezed so close to each other since late 2001. That was during the DotCom Bubble burst. As you can see, the patterns of now and then aren't all that different. In our time the market is attempting a recovery from the Inflation Crisis, coming off a war and the generational COVID crash (that led to the inflation crisis of course). The 1M RSI fractals have started and peaked on similar oversold and overbought levels respectively, while holding on their strong corrections the 0.786 Fibonacci level. Similar situation with the 1M MACD, Oil is about to form the 2nd Bullish Cross of the fractal, placing us in relative time terms to the 2002 rise.
** Importance of MACD and conclusion **
Similar oversold 1M MACD Bullish Crosses were during the 2016 Oil crisis (May) and in the aftermath of the 2008/09 Housing Crisis (October 2009). As a result, in our humble view, if Oil completes that Bullish Cross, it will give the market a signal that the price will continue to rise for many years to come (unless of course a higher fundamental intervention takes place). In conclusion, this shouldn't surprise us, as Oil has risen along with stocks following such Bear markets.
Do you also expect rising Oil prices in the near future?
-------------------------------------------------------------------------------
** Please LIKE 👍, FOLLOW ✅, SHARE 🙌 and COMMENT ✍ if you enjoy this idea! Also share your ideas and charts in the comments section below! **
-------------------------------------------------------------------------------
💸💸💸💸💸💸
👇 👇 👇 👇 👇 👇

WTI CRUDE OIL Sharp correction to the MA50 (1d).WTI Crude Oil got rejected a little after crossing over Resistance (1) that was the double top of Nov 7th and Oct 10th 2022.
The trend remains bullish but that calls for a standard correction to the Rising Support and the MA50 (1d).
Trading Plan:
1. Sell on the current market price.
Targets:
1. 86.00 (MA50 (1d) and Rising Support).
Tips:
1. The RSI (1d) is on a Falling Resistance while the price trading under a Rising Resistance, flashing a big bearish divergence. This can be the signal that breaks the Falling Support to the downside.
Please like, follow and comment!!

WTI Bullish OutlookSince March 2020, crude oil prices have been on the rise with simple Fibonacci 38.2% pull backs along the way ... BUT nothing appears to be able to stop what's coming next.
Per barrel is currently hovering around $90 but the gas pumps and tempers will exceed the charts as we move into mid-2024 on the heels of the 2024 election.
Also included the Elliott waves 1 thru 5 showing the 38.2% retraces with the mid wave showing a perfect 61.8% retrace of it's prior price action. There's no guarantee that the 1.618% extension will occur so the 1.414% at the $180 price point appears to be more probable.
NFA DYOR ... comments welcome.

WTI prints key reversal day ahead of FOMCWhilst we retain our view that oil prices could be headed for $100 further out, the trend seems to have hit a speed bump over the near-term.
WTI broke above $90 with ease yet faltered around $95 with a shooting car candle with high volume (which makes it a potential key reversal day). A bearish divergence has also formed with the RSI (2) after it reached overbought.
With the potential for the Fed to be more hawkish than expected, it could provide the catalyst for a pullback on WTI. A break below $90 confirms the near-term reversal is underway, with $87 making an initial target around the volume node from its preceding leg higher. $85 could also provide support around the August highs, which might tempt dip buyers more focussed on the fundamentals currently supporting higher oil prices.

WTI CRUDE OIL: Long term target hit. Reversal to 1D MA50 imminenAfter WTI Crude Oil hit our long term target it managed to close a 1D candle under the 4H MA50 and on prior displays inside the three month Channel Up, that was a sell signal. The 1D timeframe has been normalized from the previous overbought technical state (RSI = 67.378, MACD = 2.060, ADX = 37.892), the 1D MACD is past a Bearish Cross, which makes a complete sell opportunity. We are short, targeting the bottom of the Channel Up and potentially the 1D MA50 as well (TP = 85.00).
We are on an early long trade, targeting the course of the 4H MA50 (TP = 1.2275), even though a Channel Down top extension can even reach as high as 1.2425.
Prior idea:
## If you like our free content follow our profile to get more daily ideas. ##
## Comments and likes are greatly appreciated. ##

Waiting for the bulls’ counterattack
Oil prices fell back below the 10-day moving average, but the market is still bullish.
The main reasons for the fall in crude oil prices may include the fact that the Saudi energy minister defended the production cut and claimed that extending the production cut was not to push up oil prices; the Federal Reserve kept interest rates unchanged.
If the support level of crude oil does not break 87.6 and the resistance level does not break 90, it will continue to rise slowly in range trading.

WTI CRUDE OIL Why it has most likely topped.WTI Crude Oil got rejected a little before it hit Resistance (1) at 93.80, which is a 11 month long level.
The trading pattern since the mid April shows a good deal of correlation with October 20th 2021 - March 7th 2022. That was the peak of the Ukraine-Russia War.
In order to get such an immense price spike, a heavy fundamental catalyst needs to blast out, something that we don't currently have on the horizon.
As a result it is highly likely that Oil has topped and will turn bearish/sideways for the rest of the year.
Trading Plan:
1. Sell every rise below Resistance (1).
Targets:
1. The MA50 (1d) until eventually the MA200 (1d) gets hit around end of November - start of December.
Tips:
1. The RSI (1d) also shows high symmetry between the fractals. It started on the 30.00 oversold mark and peaked outside the Rectangle around the overbought 80.00 mark.
Please like, follow and comment!!

WTI CRUDE OIL Channel Up top and 11month Resistance rejection.WTI Crude Oil / USOIL has completed 2 red 1day candles for the first time since August 23rd.
This is after the formation of a new Higher High on the three month Channel Up pattern.
In the meantime that High was very close to the 93.80 Resistance A level, which was a Double Top on November 7th 2022.
With the 1day MACD about to close a Sell Cross, we couldn't have a steadier sell combination than that.
Sell and target 85.00 (bottom of Channel Up and expected contact with the 1day MA50).
Follow us, like the idea and leave a comment below!!

WTI CRUDE OIL: Double Buy entry on this Channel Up.WTI Crude Oil hit the HL trendline inside the 1H Channel Up pattern, which was enough to turn the 1H technical outlook bearish (RSI = 37.852, MACD = 0.140, ADX = 31.002). A 1H RSI that low has previously been a buy entry two days ago. The lowest it has been during this Channel Up was 35.400.
In response to the above, we deem the HL hold good enough to make a first buy attempt and target the top of the Channel (TP = 92.00) on another +3.21% increase. If the price crosses under the HL we will make a second buy attempt at the bottom of the Channel Up (assuming the 1H MA200 holds) and target the 0.382 - 0.236 Fibonacci range on R1 (TP = 91.10)
## If you like our free content follow our profile to get more daily ideas. ##
## Comments and likes are greatly appreciated. ##

WTI Target breaks through 90
The overall trend of crude oil rose and fell back yesterday. After a slight rise, the bulls were unable to come out of the decline, but the bullish direction remained unchanged. After all, the bullish form on the daily line was good, and the moving averages were also arranged by bulls. If there is an unexpected second bottom, the bullish trend can continue. . Therefore, it is recommended to be directly bullish on 88.7, add positions to 88.3, lose 87.8, and look at 90-91. As long as the daily MA10 position does not break, the bullish idea remains unchanged. If it breaks below, it will face adjustments. We can then watch for a pullback. It may be a slow rising trend during the day!

WTI OIL Pull-back and final buy opportunity before +$93.00.WTI Oil (USOIL) is trading within a Channel Up pattern since early June with the 1D MA50 (red trend-line) supporting since July 06. Based on the 4H MACD, the price is pulling back at the moment to test the 4H MA50 (blue trend-line) as Support, similar to July 17. If it holds, it will be the final bullish sequence to test the 93.75 Resistance (October 10 & November 07 2022 Double Top), so we will buy and target 93.00. If not, the last opportunity will remain at the bottom of the Channel Up and on the 1D MA50.
-------------------------------------------------------------------------------
** Please LIKE 👍, FOLLOW ✅, SHARE 🙌 and COMMENT ✍ if you enjoy this idea! Also share your ideas and charts in the comments section below! **
-------------------------------------------------------------------------------
💸💸💸💸💸💸
👇 👇 👇 👇 👇 👇

WTI CRUDE OIL Potential Double Top rejection.WTI Crude Oil / USOIL has made a Double Top on the 88.00 mark and crossed today under the Channel Up that was in effect for 2 weeks.
The current 4hour MACD and RSI pattern looks like the reversal sequence of August 10th. The decline that followed targeted the 4hour MA200.
Sell now and target 82.80 (Fibonacci 0.5 as well as potential contact with the 4hour MA200).
Previous chart:
Follow us, like the idea and leave a comment below!!

XTIUSD( US OIL )LONG term Trade AnalysisHello Traders
In This Chart XTIUSD HOURLY Forex Forecast By Forex Planet
today XNGUSD analysis 👆
🟢This Chart includes_ (XTIUSD market update)
🟢What is The Next Opportunity on XTIUSD Market
🟢how to Enter to the Valid Entry With Assurance Profit
This Video is For Trader's that Want to Improve Their Technical Analysis Skills and Their Trading By Understanding How To Analyze The Market Using Multiple Timeframes and Understanding The Bigger Picture on the Charts.

WTI CRUDE OIL: First 1D Golden Cross in 3 years targets $93.WTI Crude Oil resumed the bullish trend after a short pullback in mid August and again turned overbought on the 1D timeframe (RSI = 71.691, MACD = 2.030, ADX = 28.614). On any other occasion that would be a signal to expect a new technical pullback, but given the fact that the 1D MACD just formed a new Bullish Cross, we can expect a continuation of this rise to the R1 (our TP = 93.00).
As you can see, rises of such magnitude have been common in the past 12 months (green shapes). Additionally, the market has formed the first 1D Golden Cross since September 1st 2020, a strong bullish pattern indeed.
## If you like our free content follow our profile to get more daily ideas. ##
## Comments and likes are greatly appreciated. ##
