Crude oil shock trend direction
💡Message Strategy
During the European trading session on Monday, the West Texas Intermediate (WTI) crude oil futures on the New York Mercantile Exchange recovered the previous losses and rebounded to around $67.50 per barrel. Although OPEC+ confirmed that the increase in oil production in August will be higher than expected, oil prices still rebounded.
From the daily chart level, the medium-term trend of crude oil fluctuated upward and tested around 78. The K-line closed with a large real negative line, which has not yet destroyed the moving average system and is still supported. The medium-term objective upward trend remains unchanged. However, from the perspective of momentum, the MACD indicator crosses downward above the zero axis, indicating that the bullish momentum is weakening. It is expected that the medium-term trend of crude oil will fall into a high-level oscillating upward pattern.
📊Technical aspects
The short-term (1H) trend of crude oil failed to continue to hit a new low and showed a rebound rhythm. The oil price crossed the moving average system, and the short-term objective trend entered a transition period. From the perspective of momentum, the MACD indicator crossed the zero axis, and the red column indicated that the bullish momentum was sufficient. At present, the price is running in a wide range, with a range of 65.50-67.80. It is expected that the trend of crude oil will repeatedly test the upper edge of the range within the range.
💰Strategy Package
Long Position:67.00-67.50,SL:65.50,Target:70.00
Wticrudeoil

Crude oil continues to fluctuate upward
💡Message Strategy
OPEC+, led by Asian countries, announced on Saturday that it would increase production by an additional 548,000 barrels per day from next month, more than 30% higher than market expectations of 411,000 barrels per day, accelerating the pace of resumption of production after the production cuts in 2023.
In addition to supply-side factors, demand prospects are also affected by trade concerns. U.S. Commerce Secretary Howard Lutnick said that the country-specific tariffs that the Trump administration intends to implement will officially take effect on August 1, later than the previously scheduled July 9, leaving trading partners with a short breathing space.
Market concerns about the impact of this policy on crude oil consumption have intensified, especially among importing countries, mainly Asian countries.
Confidence in the Asian market remains, and Saudi Arabia raises prices to Asia
Despite the increase in supply, OPEC+ still emphasized in its statement that "the global economic outlook is stable and the market fundamentals are healthy." As a signal of confidence, Saudi Arabia has raised the prices of major crude oil varieties for Asian customers, indicating that it believes that the Asian market has the ability to absorb additional supply.
According to OPEC+ representatives, the alliance will consider whether to increase supply by another 548,000 barrels per day in September at its next meeting on August 3, thereby fully restoring the 2.2 million barrels per day quota cut last year.
📊Technical aspects
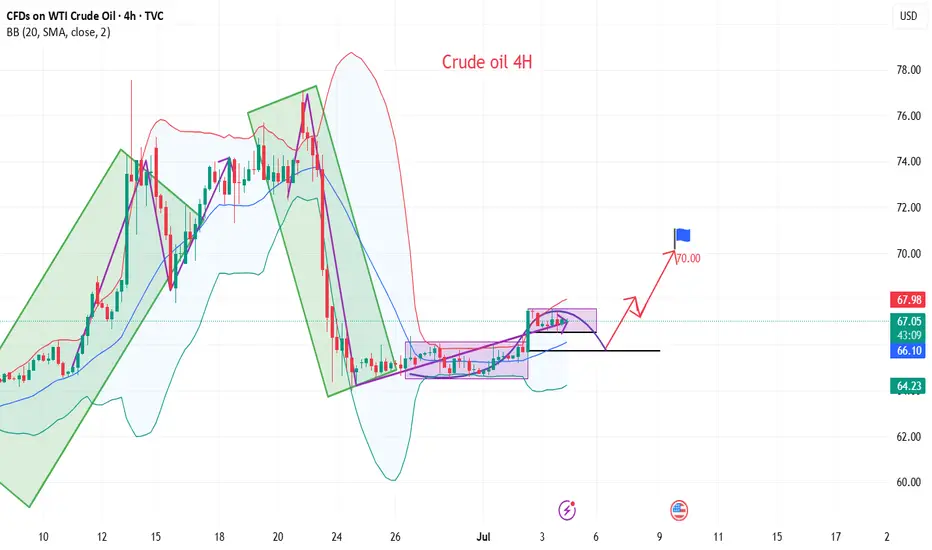
From the daily chart level, crude oil fluctuates upward and tests around 75 in the medium term. The K-line closes with a large real negative line, which has not yet destroyed the moving average system and is still supported. The medium-term objective trend remains upward. However, from the perspective of momentum, the MACD indicator crosses downward above the zero axis, indicating that the bullish momentum is weakened. It is expected that the medium-term trend of crude oil will fall into a high-level oscillation pattern.
After the short-term (4H) trend of crude oil fluctuates and consolidates, it turns into an upward rhythm. The moving average system is arranged in short positions, and the short-term objective trend is upward. The MACD indicator fast and slow lines cross the zero axis, and the bullish momentum is full. It is expected that the crude oil trend will continue to rise after a slight rebound during the day.
💰Strategy Package
Long Position:66.00-67.00,SL:65.00,Target:69.00-70.00

Crude oil moves up alternately during the day
💡Message Strategy
WTI crude oil prices snapped a three-day winning streak and were trading around $66.00 a barrel in early European trading Thursday. Crude oil prices fell as rising U.S. crude inventories heightened concerns about weak demand in the United States, the world's largest oil consumer.
📊Technical aspects
From the daily chart level, crude oil fluctuates upward in the medium term and tests around 78. The K-line closes with a large real negative line, which has not yet destroyed the moving average system and is still supported. The medium-term objective upward trend remains unchanged.
However, from the perspective of momentum, the MACD indicator crosses downward above the zero axis, indicating that the bullish momentum is weakening. It is expected that the medium-term trend of crude oil will fall into a high-level oscillation pattern.
The short-term trend of crude oil (4H) fluctuated and consolidated for two trading days. The oil price repeatedly crossed the moving average system, and the objective trend direction fluctuated. From the perspective of the primary and secondary rhythms, the current rhythm is a secondary oscillation rhythm. According to the law of primary and secondary alternation, the subjective trend still maintains an upward direction. In terms of momentum, there are signs of weakening upward momentum, and it is expected that the crude oil trend will continue to be mainly upward.
💰Strategy Package
Long Position:65.50-66.00,SL:64.50,Target:69.00-70.00
WTI Crude Oil sideways consolidation support at 6460Crude oil prices remain under pressure as easing geopolitical tensions between Iran and Israel reduce fears of supply disruptions in the Middle East. Adding to the bearish tone, the anticipated output increase by OPEC+—expected to raise August production by 411,000 bpd—acts as a supply-side headwind. Meanwhile, a modest rebound in the US Dollar from multi-year lows also weighs on oil demand, given its inverse relationship with USD-denominated commodities.
However, expectations that the Federal Reserve may soon resume rate cuts could limit USD upside, offering some support to oil prices. Traders are likely to stay cautious ahead of key US economic data, including Wednesday’s ADP report and Thursday’s Nonfarm Payrolls, which will shape Fed policy expectations. Additionally, the latest EIA stockpile data will be closely watched for immediate supply signals.
Conclusion:
WTI Crude Oil is likely to trade with a neutral-to-bearish bias in the near term, pressured by rising supply and a firmer dollar. However, Fed rate cut expectations and upcoming US labor and inventory data may help cushion the downside. Traders may remain on the sidelines until clearer direction emerges post-NFP and OPEC+ decisions.
Key Support and Resistance Levels
Resistance Level 1: 6925
Resistance Level 2: 7080
Resistance Level 3: 7230
Support Level 1: 6460
Support Level 2: 6300
Support Level 3: 6100
This communication is for informational purposes only and should not be viewed as any form of recommendation as to a particular course of action or as investment advice. It is not intended as an offer or solicitation for the purchase or sale of any financial instrument or as an official confirmation of any transaction. Opinions, estimates and assumptions expressed herein are made as of the date of this communication and are subject to change without notice. This communication has been prepared based upon information, including market prices, data and other information, believed to be reliable; however, Trade Nation does not warrant its completeness or accuracy. All market prices and market data contained in or attached to this communication are indicative and subject to change without notice.

Oil Went Back to 'Pre-conflict' Level on Israel-Iran Ceasefire The Israel-Iran ceasefire has triggered a sharp reversal in global oil markets, sending prices tumbling back to levels seen before the recent conflict. Brent crude ICEEUR:BRN1! fell below $70 per barrel and West Texas Intermediate NYMEX:CL1! dropped to around $65, erasing the risk premium that had built up during nearly two weeks of hostilities. This rapid decline—nearly 17% from the conflict’s peak—reflects investor relief that the threat of major supply disruptions, especially through the vital Strait of Hormuz, has receded for now.
However, the outlook remains uncertain. While the ceasefire has calmed immediate fears, the truce is fragile, with both sides accusing each other of violations within hours of its announcement. Shipping activity through the Strait of Hormuz is still subdued, insurance costs for tankers remain elevated, and some shipowners are steering clear of the region, indicating persistent caution in energy logistics.
If the ceasefire holds, markets may stabilize further, supporting global economic recovery and easing inflationary pressures.
But any renewed escalation or disruption in the Strait of Hormuz could quickly reverse these gains, keeping energy markets on alert for further geopolitical shocks.
The main technical graph for Dec'25 WTI Futures NYMEX:CLZ2025 indicates on 'cup and handle' technical structure with the nearest support around $62 per bll, and further 'double top' price action in upcoming development.
--
Best wishes,
@PandorraResearch Team 😎

Market Analysis: Oil Slides — Traders Eye Macro TriggersMarket Analysis: Oil Slides — Traders Eye Macro Triggers
WTI Crude oil is down over 15% and remains at risk of more losses.
Important Takeaways for WTI Crude Oil Price Analysis Today
- WTI Crude oil extended losses below the $68.00 support zone.
- A major bearish trend line is forming with resistance near $65.60 on the hourly chart of XTI/USD at FXOpen.
Technical Analysis of WTI Crude Oil Price
On the hourly chart of WTI Crude Oil at FXOpen, the price struggled to continue higher above $77.00 against the US Dollar. The price formed a short-term top and started a fresh decline below $72.00.
There was a steady decline below the $70.00 pivot level. The bears even pushed the price below $68.00 and the 50-hour simple moving average. Finally, the price tested the $63.70 zone. The recent swing low was formed near $63.69, and the price is now consolidating losses.
On the upside, immediate resistance is near the $65.60 zone. There is also a major bearish trend line forming with resistance near $65.60. The next resistance is near the $66.80 level or the 23.6% Fib retracement level of the downward move from the $76.93 swing high to the $63.69 low.
The main resistance is $70.30 and the 50% Fib retracement level. A clear move above the $70.30 zone could send the price toward $71.90.
The next key resistance is near $76.90. If the price climbs further higher, it could face resistance near $78.00. Any more gains might send the price toward the $80.00 level.
Immediate support is near the $63.70 level. The next major support on the WTI Crude Oil chart is near $62.00. If there is a downside break, the price might decline toward $60.00. Any more losses may perhaps open the doors for a move toward the $55.00 support zone.
This article represents the opinion of the Companies operating under the FXOpen brand only. It is not to be construed as an offer, solicitation, or recommendation with respect to products and services provided by the Companies operating under the FXOpen brand, nor is it to be considered financial advice.

Bulls on the Loose: US Oil Spot/WTI Heist Strategy! 🚨💰 THE OIL VAULT HEIST: US OIL SPOT/WTI TRADING STRATEGY 💸🔫
🌟Hi! Hola! Ola! Bonjour! Hallo! Marhaba!🌟
Dear Money Makers & Robbers 🤑💰💸✈️
Based on our 🔥Thief Trading style analysis🔥 (both technical and fundamental), here’s the master plan to heist the US Oil Spot/WTI Energy Market. Follow the blueprint carefully—this strategy focuses on long entries, with a daring escape planned near the high-risk Red ATR line Zone where bearish robbers and consolidation traps await. 🏆💸 Take your profit and treat yourself, fellow traders—you earned it! 💪🏆🎉
🕵️♂️ Entry 📈
💥 The vault is wide open! Time to swipe that bullish loot—heist is on!
Place buy limit orders within the 15 or 30-minute timeframe, near swing lows/highs for pullback entries.
🛑 Stop Loss 🛑
📍 Thief’s SL—recent swing low and below the moving average (4H timeframe) for day/swing trades.
📍 Adjust SL based on risk, lot size, and number of orders.
🎯 Target
🏴☠️💥 69.000 (Aim for the big loot!) OR escape before the target
🔥 Market Heist Overview
The UK Oil Spot/Brent market is currently showing bullishness 🐂, driven by key factors—perfect for a day/scalping trade robbery! ☝☝☝
📰 Additional Tools & Analysis
📊 Get the Fundamental, Macro, COT Report, Quantitative Analysis, Sentiment Outlook, Intermarket Analysis, Future Targets—check our bi0 liinks 👉👉👉🔗🔗
⚠️ Trading Alert: News Releases & Position Management
📰 News can rattle the vault! 💥
✅ Avoid new trades during news releases.
✅ Use trailing stop-loss orders to protect profits.
💖 Supporting our heist plan?
💥 Smash the Boost Button 💥 to empower the robbery team.
Let’s make money every day in this market with the Thief Trading Style! 🏆💪🤝❤️🎉🚀
👀 Stay tuned for the next robbery plan, thieves! 🤑🐱👤🤗🤩
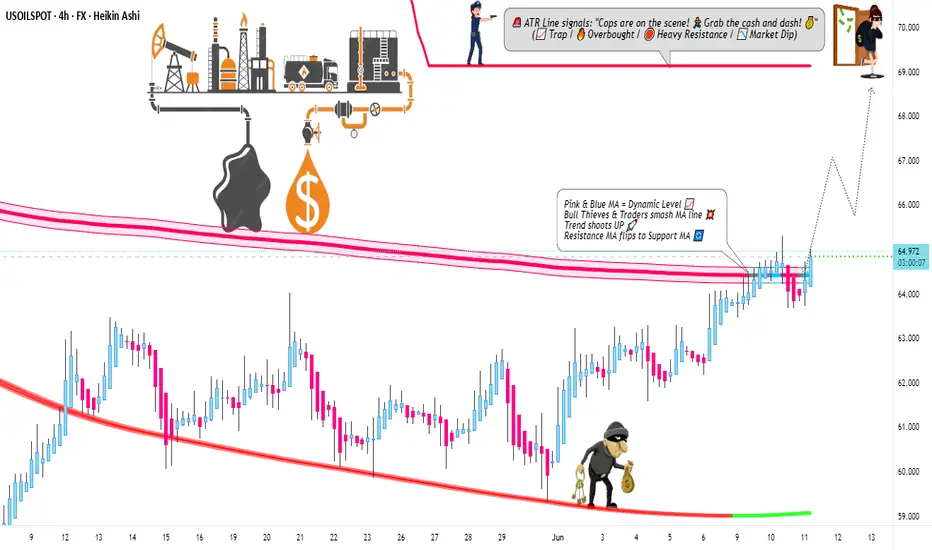
USOIL HEIST ALERT: Thief Entry Loaded – Target Locked!🚨 The Ultimate US OIL / WTI Heist Plan – Thief Trading Style 🎯💸
Hey Money Makers, Hustlers, Market Bandits! 🌍
Hola, Ola, Bonjour, Hallo, Marhaba! 👋🌟
We’re back with a slick WTI energy market heist based on our 🔥Thief Trading Style🔥—powered by a mix of technical & fundamental strategies. The vault is wide open and the bullish loot awaits!
🗺️ Strategy Brief:
We’re aiming for a clean bullish getaway near the high-risk MA zone—where traps are set and bearish robbers lurk. Watch out for overbought zones, trend reversals, and consolidation ambushes.
📈 Entry Point:
“The vault is open! Enter the bullish heist at will.”
Look to place Buy Limit Orders around swing highs/lows or pullback levels on the 15m–30m timeframe.
🛑 Stop Loss:
Set your Thief SL around the recent swing low using the 3H timeframe (example: 60.300).
Adjust based on your risk appetite, lot size, and number of entries.
🎯 Target: 65.200
That's where we celebrate the score, traders! 🥂💸
📊 Heist Justification (Fundamentals + Sentiment):
The WTI market is currently bullish, fueled by a mix of:
✅ Macro economics
✅ COT data
✅ Seasonal trends
✅ Intermarket signals
✅ Inventory & storage dynamics
📌 For full analysis and future target breakdowns, check the linkk in our profilee 🔗👀
⚠️ Important Alert – Manage Your Risk During News:
🚫 Avoid fresh entries during major news releases
✅ Use trailing stops to protect running gains
Stay sharp, stay safe.
💥 Hit the Boost Button if you support the Thief Strategy!
Join the crew, ride the wave, and let’s rob the market like pros 💼🕶️💰
📅 Stay tuned for the next master plan. Another heist is always around the corner.
Until then – steal smart, win big! 🐱👤🔥

WTI Crude oversold rally support at 6400WTI crude oil is trading just above a two-week low of 6400, as demand concerns continue to weigh on prices.
The pressure comes from uncertainty around President Trump’s tariff policy, which could worsen when the current 90-day pause ends on July 9. So far, only a minor trade deal with the UK has been reached, adding to fears of a global slowdown and weaker oil demand.
Earlier this week, oil prices also dropped after Trump announced a ceasefire between Israel and Iran, easing fears about disruptions through the Strait of Hormuz, a major oil shipping route.
On the positive side, expectations for Federal Reserve rate cuts are rising. If Trump replaces Fed Chair Jerome Powell with someone more supportive of rate cuts, it could help lift oil prices slightly by boosting the economic outlook.
Overall, oil remains under pressure with limited upside unless demand outlook improves or further supportive policy measures emerge.
Key Support and Resistance Levels
Resistance Level 1: 6925
Resistance Level 2: 7080
Resistance Level 3: 7230
Support Level 1: 6460
Support Level 2: 6300
Support Level 3: 6100
This communication is for informational purposes only and should not be viewed as any form of recommendation as to a particular course of action or as investment advice. It is not intended as an offer or solicitation for the purchase or sale of any financial instrument or as an official confirmation of any transaction. Opinions, estimates and assumptions expressed herein are made as of the date of this communication and are subject to change without notice. This communication has been prepared based upon information, including market prices, data and other information, believed to be reliable; however, Trade Nation does not warrant its completeness or accuracy. All market prices and market data contained in or attached to this communication are indicative and subject to change without notice.

The idea of oscillating crude oil
💡Message Strategy
Asia's crude oil imports hit a record high in recent years
In the first half of 2025, Asia's crude oil imports showed a significant increase. The average daily import volume in Asia reached 27.36 million barrels, an increase of 620,000 barrels from 26.74 million barrels in the same period last year, an increase of about 2.3%. The highlight of this growth was concentrated in June, when Asia's crude oil arrivals soared to 28.65 million barrels/day, setting a record high since January 2023, far exceeding 27.3 million barrels/day in May and 26.42 million barrels/day in June last year.
Import boom driven by price
What drove the surge in Asian crude oil imports in June? The answer has a lot to do with price. China and India are known to be extremely sensitive to crude oil price fluctuations, usually increasing imports when prices are low and choosing to shrink when prices are high. Crude oil arriving in June is usually scheduled six to eight weeks in advance of delivery, which means that these cargoes were purchased when oil prices were low in April and May.
Geopolitics and market uncertainty
The sharp fluctuations in oil prices in June are inseparable from the fueling of geopolitics. Israel's military action against Iran and the subsequent intervention of the United States once pushed crude oil prices to a five-month high. After Trump announced the ceasefire agreement, the market risk premium quickly subsided, but geopolitical uncertainty is still an important variable affecting oil prices. In the future, any new geopolitical events may push up oil prices again, which will further pressure Asia's import demand.
📊Technical aspects
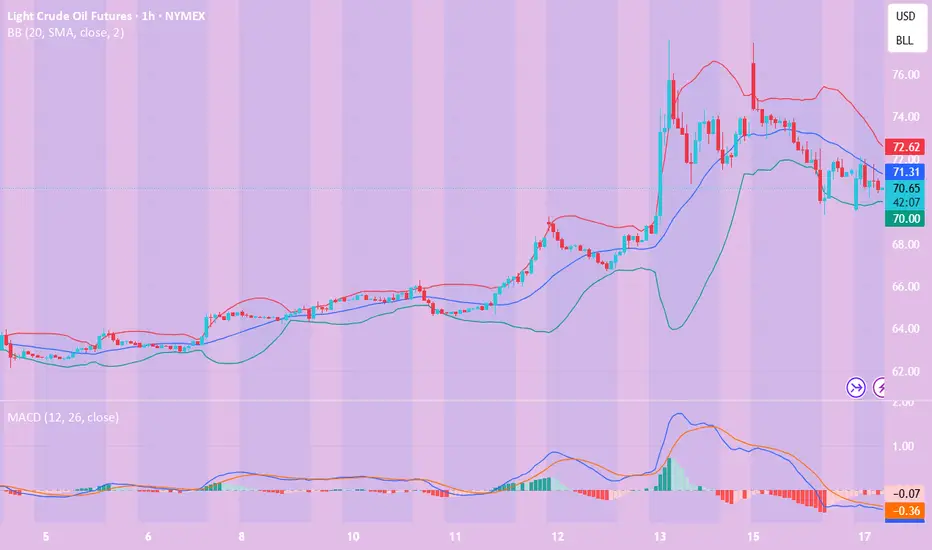
The short-term trend of crude oil (1H) continues to fluctuate in a narrow range, with a small fluctuation. The oil price repeatedly crosses the moving average system, and the short-term objective trend direction fluctuates. The momentum is stalemate between long and short positions, and it is expected that the trend of crude oil will maintain a fluctuating consolidation pattern during the day.
However, crude oil is never that simple. It is greatly affected by international trends. At present, crude oil is still waiting for direction. So how can we obtain greater future returns in a volatile market?
The answer is simple. At this time, what we need to do is to use a small stop loss to leverage large returns within the pressure and support range.
💰Strategy Package
Short Position:67.00-67.20,SL:67.80,Target: 64.50-63.50/60.00
Long Position:64.00-64.20,SL:63.50,Target: 65.50-66.50/70.00

Crude oil fluctuates in a narrow range, waiting for direction
💡Message Strategy
Middle East ceasefire eases supply concerns, but risk premium remains
Oil prices rose more than 1% on the day as investors weighed the status of the ceasefire between Iran and Israel. Although both sides have announced an end to hostilities, US intelligence reports show that Iran's nuclear capabilities have only been temporarily damaged. ING analysts pointed out that although immediate concerns about supply disruptions have subsided, potential risks remain, a factor that may support spot prices in the short term.
Previously, crude oil prices soared after the US military action on Iranian infrastructure, but prices have retreated as the ceasefire continues. Although the geopolitical premium has been reduced, it has not been fully digested.
API shows a sharp drop in inventories, traders await EIA report
Industry data from the American Petroleum Institute (API) showed that US crude oil inventories fell sharply by 4.23 million barrels in the week ending June 20, far higher than the expected drop of 800,000 barrels. Gasoline and distillate inventories increased by 400,000 barrels each.
Market focus now turns to the US Energy Information Administration (EIA) report scheduled for release on Wednesday. Traders were expecting a 1.2 million-barrel draw in inventories, and confirmation of that figure by the EIA, widely viewed as an industry benchmark, would reinforce expectations of tighter supply.
📊Technical aspects
From the daily chart level, crude oil fluctuates upward in the medium term and tests around 67. The K-line closes with a large real negative line, which has not yet destroyed the moving average system and is still supported. The medium-term objective upward trend remains unchanged.
However, from the perspective of momentum, the MACD indicator crosses downward above the zero axis, indicating that the bullish momentum is weakening. It is expected that the medium-term trend of crude oil will fall into a high-level oscillation pattern.
The short-term trend of crude oil (1H) is in a narrow range of consolidation, with a small fluctuation. The oil price repeatedly crosses the moving average system, and the short-term objective trend direction fluctuates. In terms of momentum, the MACD indicator fast and slow lines slowly rise below the zero axis, and the long and short positions are in a stalemate, with no obvious advantage on one side. It is expected that the trend of crude oil will maintain a consolidation pattern during the day.
💰Strategy Package
Short Position:67.00-67.20,SL:67.80,Target: 65.50-64.50
Long Position:64.00-64.20,SL:63.50,Target: 65.50-66.50

Tariff Panic = Opportunity | WTI Long SetupWTI Oil has finally dipped into my long-watched buy zone, driven by macro fear and an aggressive tariff agenda. The current drop aligned perfectly with my long-term execution plan. I’ve placed this trade based on key historical demand levels with my stop-loss and take-profit clearly defined. I’m prepared for deeper drawdown, but this area remains high-conviction for me. Execution > Prediction.
Technicals:
• Key Level: Price tapped into a major demand zone dating back to 2021 lows, which had been protected ever since.
• Liquidity Sweep: This drop mitigated every low formed post-2021 — clearing out late longs and stop hunts.
• Trendline Break Anticipation: I expect a potential trendline breakout from the long-term descending structure.
• SL/TP Defined: This trade has structure. It’s not a hope-based setup, it’s pre-planned and managed.
• Consolidation + Accumulation: This is where strong hands prepare, and I’m joining in.
Fundamentals:
• Tight supply, rising global demand, and structural underinvestment in oil exploration.
• Chinese reopening + Russian ban tighten market availability.
• Central banks expected to support demand via easing cycles.
• Oil Bearish Catalyst (Short-Term):
• US tariff wave: Trump announced a total 54% tariff on China and baseline tariffs on all trading partners.
• Escalating fears of global economic slowdown pushed prices to $58.80, a 4-year low.
The bearish panic gave bulls like us a gift. This is how real trades are born - not in euphoria, but in blood.
Note: Please remember to adjust this trade idea according to your individual trading conditions, including position size, broker-specific price variations, and any relevant external factors. Every trader’s situation is unique, so it’s crucial to tailor your approach to your own risk tolerance and market environment.

WTI Crude Oil lower ahead of US weekly inventoriesGeopolitics: The de-escalation between Israel and Iran removes near-term supply shock risks, reducing bullish pressure on oil.
Monetary Policy: Powell’s hawkish tone implies tighter financial conditions for longer, which can dampen global growth expectations and, in turn, oil demand.
Overall Bias for Traders:
Near-term pullback in WTI is possible if geopolitical risk continues to fade.
Upside may be capped unless new supply disruptions emerge or economic data justifies looser Fed policy.
Watch for inventory data and fresh comments from Fed officials or Middle East developments as catalysts for direction.
Trading Outlook: Neutral-to-Bearish near-term bias unless fresh geopolitical tension reignites risk premium.
Key Support and Resistance Levels
Resistance Level 1: 6925
Resistance Level 2: 7080
Resistance Level 3: 7230
Support Level 1: 6460
Support Level 2: 6300
Support Level 3: 6100
This communication is for informational purposes only and should not be viewed as any form of recommendation as to a particular course of action or as investment advice. It is not intended as an offer or solicitation for the purchase or sale of any financial instrument or as an official confirmation of any transaction. Opinions, estimates and assumptions expressed herein are made as of the date of this communication and are subject to change without notice. This communication has been prepared based upon information, including market prices, data and other information, believed to be reliable; however, Trade Nation does not warrant its completeness or accuracy. All market prices and market data contained in or attached to this communication are indicative and subject to change without notice.

Trump’s “ambiguous” statement, where will oil prices go?
💡Message Strategy
Trump's remarks are repeated, and the geopolitical premium still limits the downward space of oil prices
Trump said that the United States "may or may not" join Israel's actions against Iran. Analysts pointed out that if the United States is officially involved in the conflict, oil prices may rise by $5; if peace talks are launched, they may fall by the same amount.
The geopolitical focus is still on the Strait of Hormuz
Iran produces 3.3 million barrels of oil per day, but more importantly, about 19 million barrels of crude oil are transported through the Strait of Hormuz. The escalation of the conflict may threaten the safety of the waterway.
The Fed's policy turn to dovish failed to effectively support oil prices
Although the Fed hinted that it may cut interest rates twice this year, Chairman Powell emphasized that the decision still depends on inflation data, and Trump's upcoming new round of import tariffs may push up prices and limit the boost in oil demand brought about by loose policies.
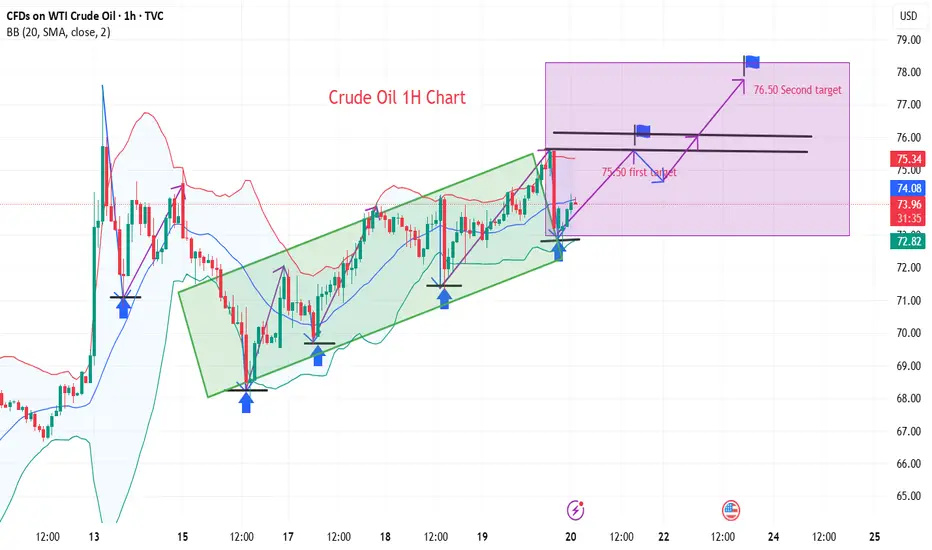
📊Technical aspects
From the daily chart level, crude oil prices in the medium term broke through the upper resistance of the range and tested a new high of 75.50. The moving average system is in a bullish arrangement, and the medium-term objective trend is in the direction.
The current trend is in the upward rhythm of the main trend. The MACD indicator fast and slow lines overlap with the bullish column above the zero axis, indicating that the bullish momentum is currently full, and it is expected that the medium-term trend is expected to usher in a wave of rising rhythm.
💰Strategy Package
Long Position:73.00-73.50,SL:72.50
The first target is around 75.50
The second target is around 76.50
If the situation in the Middle East escalates, the room for crude oil to rise will be enlarged
WTI Short PositionBelieve stability within the Middle East market will bring the price down so it could rebound back up once liquidity has been cleared

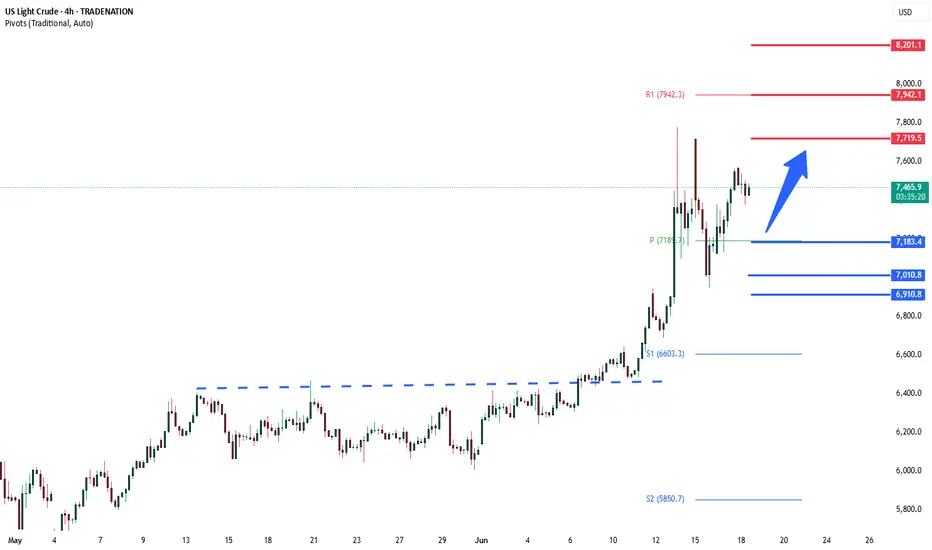
$100 a barrel coming soon for Crude oil futures In this video we focus on the current accumulation in the oil chart and the prospect of higher prices ahead .
I highlight how the respect of the previous quinquennial pivots gave us a 45% move to the upside in the past 8 weeks .
Looking ahead on the monthly timeframe we have the following confluences above the current price of $75 .
Above the current pa we have the point of control at $ 88 and the avwap at $97, if we can reclaim the poc I think we will continue to push up to the fib levels that I have mentioned in the video.
In addition to the above we also have the decennial pivots at $107/$112 alongside the value area high .
All of this validates for me why oil will be pushing back up throughout the course of the year .
Tools used in the video
Tr pocket , pivots , fived range volume profile and fib expansion

WTI(20250620)Today's AnalysisMarket news:
The Bank of England kept interest rates unchanged at 4.25%, and the voting ratio showed that internal differences were increasing. Traders expect the bank to cut interest rates by another 50 basis points this year.
Technical analysis:
Today's buying and selling boundaries:
74.33
Support and resistance levels:
77.40
76.25
75.51
73.15
72.40
71.26
Trading strategy:
If it breaks through 73.15, consider buying, and the first target price is 75.00
If it breaks through 72.40, consider selling, and the first target price is 71.26

The wealth code of crude oil is: low and long
💡Message Strategy
According to market research, Iran's crude oil export infrastructure has not been directly hit yet, and most of the impact is still concentrated on shipping. However, analysts pointed out that once the conflict spreads to the entire region, oil prices are likely to rise further.
The Strait of Hormuz has become the market's biggest concern. It is the throat of about one-fifth of the world's crude oil supply. Although there is no sign that Iran is trying to block the channel, any escalation of the situation may pose a serious threat to the global energy supply chain.
"Trump's threat to Iran's supreme leader shows that diplomatic channels are no longer effective," said Charu Chanana, chief investment strategist at Saxo Financial Markets Ltd. in Singapore. "If Iran's exports are interrupted, or even in the worst case scenario such as the Hormuz blockade, oil prices may soar rapidly."
The rise in geopolitical risks has also triggered turmoil in financial markets, with investors turning to safe-haven assets such as gold, and the volatility of the crude oil market has hit a three-year high. At the same time, crude oil producers have stepped up hedging operations, and futures and options trading volumes have surged.
The latest API crude oil inventory data showed that U.S. crude oil inventories fell sharply last week, further reinforcing market expectations of tight supply. According to data released by the American Petroleum Institute (API) in the early hours of June 18, U.S. crude oil inventories fell by 11 million barrels in the week ending June 14, far exceeding market expectations of a decline of 2.5 million barrels, marking the largest weekly drop since August last year.
📊Technical aspects
From a technical perspective, the daily chart of US crude oil (WTI) shows a clear bullish trend. After breaking through the previous high of $72, the price quickly rose and stabilized above $75, showing strong upward momentum. The current K-line has closed with long positive lines, and the red column of the MACD indicator has expanded, and the fast and slow lines have crossed, indicating that the bullish momentum continues to increase.
At the same time, the price has moved away from the 20-day and 50-day moving averages. There is a possibility of a technical correction in the short term, but the overall trend is still upward. If the geopolitical situation continues to be tense, the target may be raised to $77.5 or even the integer mark of $80, and the support will focus on the vicinity of $72.50.
💰 Strategy Package
Crude oil has reached our upward target of 74.00 yesterday and fell back. The current upward pressure on crude oil is around 75.50. If it breaks through upward, it will soon reach our second target of 77.50.
rend: Upward trend
Support: Around 72.50
Resistance: Around 75.50
Long Position:72.00-72.50,SL:71.50
The first target is around 75.00
The second target is around 77.50

WTI CRUDE OIL: There is no better time to sell that this.WTI Crude Oil has turned overbought on its 1D technical outlook (RSI = 71.048, MACD = 2.830, ADX = 41.529) and this is technically the most efficient level to sell on the long term. Not only is that the top of the dotted Channel Down but last week the price got very close to the 1W MA200, which has produced the last 3 major rejections since the week of August 12th 2024. Technically the market still has some room to move upwards and test it but since it rose purely on the latest Middle East conflict, it is more likely than not to see an equally quick price deflation and rebalancing. The earlier bearish waves (September 2023 onwards), initially targeted the 0.786 Fibonacci level and then bounced. That translates to TP = 61.00 (at least) towards the end of the year.
See how our prior idea has worked out:
## If you like our free content follow our profile to get more daily ideas. ##
## Comments and likes are greatly appreciated. ##

WTI(20250618)Today's AnalysisMarket news:
World Gold Council: 95% of central banks expect gold reserves to rise in the next 12 months.
Technical analysis:
Today's buying and selling boundaries:
72.29
Support and resistance levels:
76.53
74.95
73.92
70.66
69.63
68.04
Trading strategy:
If the price breaks through 73.92, consider buying, the first target price is 74.95
If the price breaks through 72.29, consider selling, the first target price is 70.66

WTI Crude Oil bullish on geopolitical riskWTI Price: Trading around $74.60, extending gains in European trading hours.
Key Drivers Today:
Geopolitical Risk:
Tensions between Israel and Iran are rising.
Trump called for Iran’s “unconditional surrender,” increasing fears of US involvement.
Iran may shut the Strait of Hormuz — a key oil shipping route — which could disrupt supply and push prices higher.
Bullish API Inventory Data:
US crude stockpiles dropped by 10.1 million barrels last week (vs. -0.6M expected).
Signals strong demand or tighter supply, adding bullish pressure to WTI.
Trading Implication:
Geopolitical risk + surprise inventory draw = bullish bias for WTI.
Watch for momentum toward $77.20 resistance, with support near $71.80.
Eyes now on EIA data for confirmation and any new Middle East headlines for further upside.
Key Support and Resistance Levels
Resistance Level 1: 77.20
Resistance Level 2: 7940
Resistance Level 3: 82.00
Support Level 1: 71.80
Support Level 2: 70.00
Support Level 3: 69.00
This communication is for informational purposes only and should not be viewed as any form of recommendation as to a particular course of action or as investment advice. It is not intended as an offer or solicitation for the purchase or sale of any financial instrument or as an official confirmation of any transaction. Opinions, estimates and assumptions expressed herein are made as of the date of this communication and are subject to change without notice. This communication has been prepared based upon information, including market prices, data and other information, believed to be reliable; however, Trade Nation does not warrant its completeness or accuracy. All market prices and market data contained in or attached to this communication are indicative and subject to change without notice.
The best opportunity is when crude oil falls
💡Message Strategy
Crude oil futures fell in the European session on Monday (June 16), giving up earlier gains, as a new round of hostilities between Israel and Iran had limited impact on oil production and exports.
WTI briefly rebounded to $77.49, close to last week's high, which was also our second profit target, but failed to break through the key resistance level near $78.09.
Oil prices surged 7% on Friday, driven by geopolitical risks, pushing crude to its highest level since January. However, Monday's reversal reflected the lack of immediate threats to supply routes, especially the strategically important Strait of Hormuz.
If Iran's production drops sharply due to the conflict, the global oil supply buffer will be quickly exhausted and oil prices may usher in a new round of surges. Faced with this complex situation, investors, oil-producing countries and consumers need to be prepared to meet the possible energy storm.
This is also the reason why we repeatedly emphasize that crude oil should be long when it falls. We can foresee its upward momentum, and the pullback is only in a moment without any signs.
📊Technical aspects
The short-term (1H) trend of crude oil continued to fluctuate upward, and the price near 74 was tested. The moving average system relies on the bullish arrangement of oil prices, and the short-term objective trend direction remains upward.
In the morning, the oil price hit a new high near 75.30, and then fell back and closed with a negative real candlestick. The short-term momentum is still bullish, and it is expected that the trend of crude oil will continue to maintain a high-level oscillating upward rhythm.
💰 Strategy Package
Long Position:69.50-70.50
The first target is around 73.00
The second target is around 75.00

WTI(20250617)Today's AnalysisMarket news:
Revised version of the Republican tax cut bill in the US Senate: It is planned to raise the debt ceiling to 5 trillion, and the overall framework is consistent with the House version.
Technical analysis:
Today's buying and selling boundaries:
70.41
Support and resistance levels:
75.98
73.90
72.55
68.27
66.92
64.84
Trading strategy:
If the price breaks through 72.55, consider buying, and the first target price is 73.90
If the price breaks through 70.41, consider selling, and the first target price is 68.27