WTI BEARISH OUTLOOKCrude Oil benchmark WTI broke its previous established support at 81.75 and continued its downtrend through Wednesday after G7 talk for implementing a price cap on Russian supply. The mark cap of 65-70 USD per barrel was higher than the market expected, which elevate some of the fears of supply distribution of the oil. Another positive news for the global oil supply is that Chervon Corp. might expand operations in Venezuela.
Both MACD and RSI technical indicators are confirming the downtrend with MACD histogram below the 0 line and RSI below the 50 neutral line.
If the trend continues the price might try to reach levels of 73.65 or even 70.47 In the opposite scenario, the price might revert and test its resistance at 81.75
Risk Disclosure: Trading Foreign Exchange (Forex) and Contracts of Difference (CFD's) carries a high level of risk. By registering and signing up, any client affirms their understanding of their own personal accountability for all transactions performed within their account and recognizes the risks associated with trading on such markets and on such sites. Furthermore, one understands that the company carries zero influence over transactions, markets, and trading signals, therefore, cannot be held liable nor guarantee any profits or losses.
Wticrudeoil

CRUDE OIL Bullish entering DecemberWTI Crude Oil made a remarkable rebound yesterday marginally below the 76.30 Support (the Support Zone is now 76.30 - 75.30) and turned the 4H RSI around, approaching the 4H MA50 (yellow line).
This is the first Resistance (short term) with the initial target of this late September/October-like rebound being the 1D MA50 (blue line). If then the price breaks above the 1D MA100 (green line), we can continue buying and aim the 93.75 Resistance, which happens to be on the 0.382 Fibonacci level of the June 14 Top. Being so symmetrical, is why we consider the 0.236 Fibonacci to also be a medium term Resistance as well. A break above the 93.75 Resistance targets the 1D MA200 (orange line), the long term bearish barrier.
Follow us, like the idea and leave a comment below!!

WTI CRUDE OIL BUY SAVE NOW
AronnoFX will not accept any liability for loss or damage as a result of
reliance on the information contained within this channel including
data, quotes, charts and buy/sell signals.
If you like this idea, do not forget to support with a like and follow.
Traders, if you like this idea or have your own opinion about it,
write in the comments. I will be glad.

WTI OIL: Trapped between the 1W MA50 and MA100The WTI Crude Oil has been giving the best set-up to swing traders as it has been ranging within the 1W MA50 (blue) and 1W MA100 (green) since August 31st. Great low risk high return opportunities exist within for as long as it lasts.
On the longer term, the September 26th bounce on the 1W MA100 was on the rising Support (Higher Lows) that has been in effect since March 2021. In fact even the 1W RSIhit and rebounded on its declining (Lower Lows) Support, with the previous two times (December 6th 2021 and August 23rd 2021) matching Oil's last two bottoms. The MACD needs to complete its bullish cross to confirm a new sustainable rise though, which will most likely be if Oil breaks above the 1W MA50. That would target the dashed rising Resistance (Higher Highs) that was the technical Resistance before the Ukraine/ Russia war distorted the price action.
On a different occasion, if the price breaks below the March 2021 rising Support, Oil could target the 1W MA200 (orange) for the first time since February 01 2021.
## If you like our free content follow our profile to get more daily ideas. ##
## Comments and likes are greatly appreciated. ##
## Also DONATIONS through TradingView coins help our cause of increasing the daily ideas put here for free and reach out more traders like you. ##

WTI CRUDE OIL WAITE FOR CONFARMANATION...
Hello Traders, here is the full analysis for this pair,
let me know in the comment section below if you have any questions,
the entry will be taken only if all rules of the strategies will be
satisfied. I suggest you keep this pair on your watch list and see if
the rules of your strategy are satisfied.
Dear Traders,
If you like this idea, do not forget to support with a like and follow.
PLZ! LIKE COMMAND AND SUBSCRIBE.

WTI CRUDE OIL SEEM SELL CORRECTION THEN BUY....
Hello Traders, here is the full analysis for this pair,
let me know in the comment section below if you have any questions,
the entry will be taken only if all rules of the strategies will be
satisfied. I suggest you keep this pair on your watch list and see if
the rules of your strategy are satisfied.
Dear Traders,
If you like this idea, do not forget to support with a like and follow.
PLZ! LIKE COMMAND AND SUBSCRIBE.

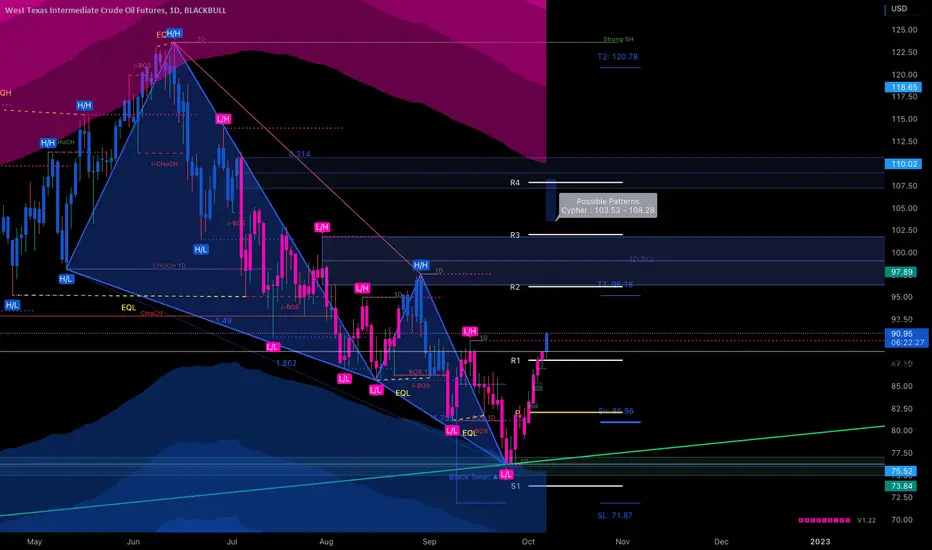
WTI CRUDE OIL Neutral for now, 1D MA100 is the keyWTI Crude Oil has made a break above the June Channel Down but still this isn't a long-term signal to buy. The key here is the 1D MA100, which has been keeping the price below it since July 05. If it breaks, we will target the 97.65 Resistance. Then the 1D MA200 will decide if we enter the bullish trend on the long-term again, or pull back towards the bottom of a newly formed blue Channel Up.
A break below that Channel would keep the long-term bearish trend intact, targeting the 76.20 Support. Best signal to sell this would be the STOCH RSI making a Sell Cross.
## If you like our free content follow our profile to get more daily ideas. ##
## Comments and likes are greatly appreciated. ##
## Also DONATIONS through TradingView coins help our cause of increasing the daily ideas put here for free and reach out more traders like you. ##

USOIL 1st NOVEMBER 2022US President Joe Biden will ask oil and gas companies to invest some of their record profits in lowering the cost of living in the country. Biden will ask Congress to consider requiring oil companies to pay a tax penalty. Biden has previously encouraged oil companies to increase production rather than use profits for share buybacks and dividends. The government is also relying on releasing supplies from the Strategic Petroleum Reserve (SPR) to ease the supply crisis.

Long WTI & Short Brent as price differential tightens?Oil Brent continues to trade at a premium of more than $8 per barrel to WTI oil , with the price difference between the two oil benchmarks increasing significantly and well above its historical average this year.
One of the primary drivers of the widening Brent/WTI price spread has been a significant increase in the availability of North American crude, which has created more downward price pressure on the WTI market.
The US government has injected180 million barrels of crude into the market through scheduled Strategic Petroleum Reserve (SPR) releases as of October 18, 2022, to help resolve the market supply disruption created by Russia's full-scale invasion of Ukraine and to help cut energy costs.
U.S. SPR releases are now complete, and crude oil reserves in the United States are at their lowest point since 1983, according to the latest estimates from EIA.
The possibility that the Democrats would suffer a loss in the midterm elections in two weeks might rule out the possibility of more SPR releases being made at a later stage.
In this scenario, the forces that pushed the price of WTI below that of Brent would diminish significantly. As a result, the price spread between the two oil benchmarks may return to tighter levels. Going long on WTI and short on Brent is one way to reflect the idea of closing this oil price gap.
Throughout 2021, the difference between WTI and Brent was on average about -$2/bbl and ranged from -$4.5/bbl to parity levels.
A mean reversion to the period prior to US SPR releases would suggest an increase from current prices of about $6.5/bbl. If, on the other side, the spread widens again and breaks through the -$10/bbl threshold, the strategy will be proven incorrect.

CRUDE OIL TRADE ENTRYIn the crude oil we have strong level of resistance where price close on friday and sort of rejecting from 84.87 level and we also have 200 ema at 87.91 so this zone is very strong and oil need high volume to break this area and after this we have a strong trend line resistance to upside and price rejecting multiple time from this level also so i am looking selling entry from the current price if oil break its support to downside than we expect price come to yellow zone to fill the gap area and if price break to upside than we looking short from the selling close from the trend line for the target of yellow zone becoz crude oil have a very big gap and price need to fill this gap must/


WTI: StretchingWTI is done recovering and has finished wave b in blue. Already, it is stretching upwards, striving to work on our primary scenario. We expect the marker crude to climb above the resistance at $97.66 and into the turquoise zone between $99.97 and $113.53, where it should complete wave b in turquoise. After this feat, WTI should relax once more and fall into the green zone between $70.12 and $35.77 to conclude the overarching downwards movement. There is a 35% chance, though, that WTI could tackle this task directly, dropping below the support at $76.25 earlier already.

LONG WTI OILWTI is ready to start another bullish move after break bearish trend line.
This zone is cluster of 0.786% fibo ret, 100% exp and 200% ext.
Trade safe guys.
Good luck.

WTI oil - Deteriorating demand to weight on the higher oil priceSince our short-term price target of 80 USD was taken out a few weeks ago, we abstained from setting short and medium-term price targets because of very high volatility in the oil market. Despite that, we stuck to the long-term price target of 70 USD, to which we remain committed.
Our views are based mainly on fundamental factors concerning the deteriorating global demand for oil, with the OPEC slashing demand for 2023 and China maintaining its zero covid policy for longer.
Technical analysis - daily time frame
RSI and Stochastic are bearish. MACD is neutral. DM+ and DM- strive to perform a bearish crossover. Overall, the daily time frame is neutral/slightly bearish.
Illustration 1.01
Illustration 1.01 shows the daily chart of USOIL and two simple moving averages. Yellow arrows hint at bullish breakouts (above SMAs) and subsequent invalidation.
Technical analysis - weekly time frame
RSI and MACD are bearish. Stochastic is bullish. DM+ and DM- are bearish. Overall, the weekly time frame is bearish.
Illustration 1.02
The picture shows the weekly chart of USOIL and two moving averages. The yellow arrow points to the impending bearish crossover between two SMAs; if successful, it will bolster the bearish case.
Please feel free to express your ideas and thoughts in the comment section.
DISCLAIMER: This analysis is not intended to encourage any buying or selling of any particular securities. Furthermore, it should not be a basis for taking any trade action by an individual investor. Therefore, your own due diligence is highly advised before entering a trade.

As the price broke above the downtrend and retested with a HummeAs the price broke above the downtrend and retested with a Hummer candle

WTI CRUDE OIL POSSIBLE TO BUY....
Hello Traders, here is the full analysis for this pair,
let me know in the comment section below if you have any questions,
the entry will be taken only if all rules of the strategies will be
satisfied. I suggest you keep this pair on your watch list and see if
the rules of your strategy are satisfied.
Dear Traders,
If you like this idea, do not forget to support with a like and follow.
PLZ! LIKE COMMAND AND SUBSCRIBE.

WTI CRUDE OIL WAITE FOR BREAKOUT THEN BUY....
AronnoFX will not accept any liability for loss or damage as a result of
reliance on the information contained within this channel including
data, quotes, charts and buy/sell signals.
If you like this idea, do not forget to support with a like and follow.
Traders, if you like this idea or have your own opinion about it,
write in the comments. I will be glad.

WTI CRUDE OIL SEEM SELL CORRECTION THEN BUY....
AronnoFX will not accept any liability for loss or damage as a result of
reliance on the information contained within this channel including
data, quotes, charts and buy/sell signals.
If you like this idea, do not forget to support with a like and follow.
Traders, if you like this idea or have your own opinion about it,
write in the comments. I will be glad.

WTI LONGstill holding this trade weeked.. wti going trend will turn. look for the numbers.. number will tell you everything,, auction, values, really matter..


OIL oil has been on a tear despite dollar strength right now theres some things going on with opec and siding with russia that may be pushing it up since they rasied the prices on usa
either way this bad boy not stopping if we get a close above this level we pushing towards that 96$ handle soon
Macro and TA is making Oil look ripe for an upward moveMacroeconomic trends with a rough heating season for Europe, the continued war in Ukraine, the internal troubles in Iran, and the most recent OPEC+ meeting makes the macro position for Oil look bullish.
Looking at the charts it looks likely that oil will challenge the downward trend that has persisted recent months and coming two days let us know if it'll begin a bullish upwards trend.

WTI analysis: Will OPEC+ cuts boost crude to $100?OPEC+ has taken a tough stance, slashing output by 2 million barrels per day (bpd) beginning in November 2022, the largest reduction in crude oil production since March 2020.
In addition to production extending the agreement through 2023, oil producers have agreed to hold semiannual rather than monthly meetings.
WTI oil briefly spiked to $87/bbl following the OPEC+ announcement. It then broke through that level in response to disappointing US crude oil inventory data (-1.36 million barrels vs. 2.05 expected) and a strong US ISM Services PMI, which delayed recessionary warning signs following the weak ISM Manufacturing PMI earlier this week.
The move by OPEC+ risks putting renewed pressure on crude oil’s global supply-demand balance in the coming months, potentially resulting in a price floor at pre-OPEC+ meeting levels.
On a technical level, WTI crude and (also Brent) prices are currently testing a key resistance area, defined by the 50-day moving average and the 23.6% Fibonacci retracement level of the range between September lows and June highs.
A sharp break above this resistance zone and then the $90/bbl level (September highs) could put additional upward pressure on an extension towards the 50% of the Fibonacci level ($98.6/bbl) and then $100/bbl.
Idea written by Piero Cingari, forex and commodity analyst at Capital.com
