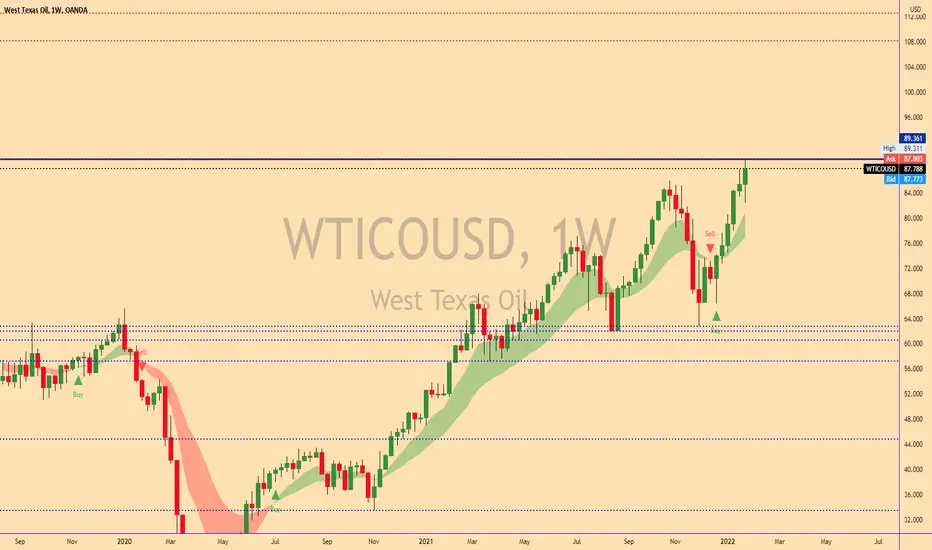
Technical analysis update: WTI oil (19th January 2022)Today WTI oil reached 87.90 USD per barrel which coincides with a new high in price that has not been seen since 2014 and which confirms the continuation of the uptrend. We continue to maintain a bullish outlook on WTI oil in the medium-term and long-term. However, in the short term we are becoming very cautious as some technical indicators reached an overbought condition which suggests that the price of USOIL might be ripe for correction before continuing higher. We will watch the support level at 85.39 USD (previous high from 25th October 2021) and its ability to hold selling pressure in case it occurs. Our long-term price target remains 90 USD per barrel.
Technical analysis - daily time frame
MACD and Stochastic remain bullish. RSI reached overbought territory which suggests that USOIL might retrace lower before continuing higher. DM+ and DM- continue to show bullish conditions. Additionally, ADX increases which suggests that the bullish trend is gaining momentum. Overall, the daily time frame remains bullish while it signals possible correction in price.
Technical analysis - weekly time frame
RSI, MACD and Stochastic are all bullish. DM+ and DM- performed the bullish crossover recently. ADX undergoes reset. Overall, the weekly time frame is bullish.
Support and resistance
Immediate resistance sits at 87.90 USD. Support 1 is at 85.39 USD while Support 2 lies at 80.81 USD. 61.76 USD. Support 3 is then at 78.28 USD while major support is at 61.76 USD.
Please feel free to express your own ideas and thoughts in the comment section.
DISCLAIMER: This analysis is not intended to encourage any buying or selling of any particular securities. Furthermore, it should not serve as a basis for taking any trade action by an individual investor. Your own due diligence is highly advised before entering trade.
Wticrudeoil

Technical analysis update: WTI oil (17th January 2022)WTI oil continues to march higher and we continue to maintain a bullish outlook on oil. Our view is supported by a combination of bullish technical and fundamental factors. Currently, we will observe whether USOIL will manage to break above the major resistance at 85.39 USD which will further bolster the bullish case for WTI oil. We would like to set a new short-term price target for USOIL to 85 USD per barrel. Our long-term price target is 90 USD per barrel.
Technical analysis - daily time frame
RSI is very bullish and due to perform crossover above 70 points (into overbought zone). We expect such a phenomenon to be accompanied by further rise in price. However, after completion of crossover we think it is likely that price will retrace lower before continuing towards a price tag of 90 USD per barrel. MACD and Stochastic are also bullish. DM+ and DM- signal bullish trend. Additionally, ADX exhibits growth which suggests that the prevailing bullish trend is gaining strength. Overall, the daily time frame is bullish.
Technical analysis - weekly time frame
RSI is bullish. Same applies to MACD and Stochastic. DM+ and DM- performed bullish crossover recently. ADX undergoes reset as it declines. Overall, the weekly time frame is bullish.
Support and resistance
Major resistance sits at 85.39 USD while major support lies at 61.76 USD. Support 1 sits at 80.81 USD and Support 2 at 78.28 USD.
Please feel free to express your own ideas and thoughts in the comment section.
DISCLAIMER: This analysis is not intended to encourage any buying or selling of any particular securities. Furthermore, it should not serve as a basis for taking any trade action by an individual investor. Your own due diligence is highly advised before entering trade.

WTI CRUDE OILWTI Crude Oil
For the fourth week running, WTI Crude Oil made its highest weekly close in 7 years last week and printed a relatively large bullish candlestick which looks healthy. The price closed within the top quarter of the candlestick’s range, suggesting a further rise to come despite OPEC’s continued production increases. There are bullish signs, and I continue to see WTI Crude Oil as an interesting buy.


WTI CRUDE OILFor the third week running, WTI Crude Oil made its highest weekly close in 7 years last week and printed a bullish outside bar which looks healthy and suggests a further rise to come. There are bullish signs, and I continue to see WTI Crude Oil as an interesting buy.
Oil looking to make big rise in 2022Crude oil just broke out of long time falling wedge pattern at around the $60.00 area as seem on chart. With inflation at 20 - 30 year highs, war looming, and talks of strikes at the refineries the target of $162.95 area could easily happen. This will cause sky high gasoline prices going into Q2/summer and continuing throughout fall/Q3, I am assuming.

wti crude oil currently running down sell and hold the Wii crude oil global update as well as down fall is erected ...........

WTI OIL is on track for the October $85.00 high.We have been following this bullish sequence on WTI Oil closely since the December 02 2021 bottom and so far is following our projection to a great extent:
As you see, the most recent pull-back (red arrow) was successfully made on the yellow Lower Highs trend-line and after the price recovered, it re-tested (green arrow) the line as a Support, which is so far giving a very strong green 1D candle today. As explained on my previous analyses, this is following the late August - late October bullish wave sequence to the Higher Highs trend-line of the long-term pattern.
You don't need to target all the way to the Higher Highs trend-line, the previous high of $85.00 is good enough to take profit as we've been mentioning since December. However if you wish to seek more risk, an potential indicator that may signal the next top, is the Ichimoku Cloud. During the last bullish wave of August - October, the market top was formed exactly on the Ichimoku squeeze. Currently the new squeeze is on February 10. Can this mean that we still have another month of uptrend? Possibly but always manage the risk carefully especially in the energy sector.
--------------------------------------------------------------------------------------------------------
** Please support this idea with your likes and comments, it is the best way to keep it relevant and support me. **
--------------------------------------------------------------------------------------------------------

WTI USD SHORT entryplease note i made two scenario as per the resistance and trend line and there is a weak in the up trend rsi in 4 hrs and 1hrs as well hopeing for a good trade
already shorted the WTI-USD

Technical analysis update: WTI oil (4th January 2022)Today WTI oil reached our short-term price target of 77 USD per barrel. Furthermore, USOIL broke above the short-term support for a short period of time. Fundamentals remain bullish as OPEC agreed to proceed with a planned production boost of 400 000 bpd in February 2022. This signals OPEC's confidence in the oil market. Additionally, our bullish view is supported by a combination of bullish technical factors. Because of that we would like to raise our short-term price target for USOIL to 78 USD per barrel. We would also like to set a medium-term price target for USOIL to 80 USD per barrel.
Technical analysis - daily time frame
RSI is bullish. We will observe it in the following days and we'll watch out for a crossover above 0 points. We expect such an occurrence to further bolster the bullish case for oil. Stochastic is also bullish. Recently, MACD performed a bullish crossover above 0 points which is very bullish. DM+ and DM- show mixed conditions. ADX signals that the prevailing trend is relatively weak.
Technical analysis - weekly time frame
Weekly time frame remains unchanged from our latest update on USOIL. RSI points to the upside which is bullish. Stochastic is bullish too and MACD started to flatten (still in the bullish zone). We will observe MACD in the following weeks and we will watch out whether it manages to stay within the bullish zone and reverse back to the upside. DM+ and DM- show bearish conditions while ADX continues to decline. Though, ADX's value is a little bit higher than the value of ADX on a daily time frame.
Illustration 1.01
Picture above shows the weekly chart of USOIL. It also shows setup for head and shoulders being formed. We will observe whether this pattern will continue to develop further. However, at the moment, we believe this pattern will get distorted and price will continue higher.
Support and resistance
Following support and resistance levels are derived from the peaks and troughs in price of USOIL. Short-term support sits at 73.30 USD and short-term resistance lies at 77.41 USD. Next closest resistance appears at 79.20 USD and then at 81.78 USD. Major resistance lies at 85.39 USD. Major support level can be found at 61.76 USD.
DISCLAIMER: This analysis is not intended to encourage any buying or selling of any particular securities. Furthermore, it should not serve as a basis for taking any trade action by an individual investor. Your own due diligence is highly advised before entering trade.

WTI Crude Oil Forecast: Price Breaks Short-Term ResistanceThe West Texas Intermediate Crude Oil market rallied a bit on Tuesday to show signs of life and break through a very short-term resistance barrier. We have not been able to sustain the move significantly, but it still looks as if we are going to get more bullish pressure. When you look at the chart, it does not take a lot of imagination to suggest that we have just broken above the top of a bullish flag, which is a very bullish sign and could send this market towards the most recent highs near the $85 level.
To the downside, we have the 50 day EMA turning towards the upside and showing signs of positivity. That should be support, and I think that any short-term pullback will more than likely offer a nice opportunity to get long. However, if we were to break down below there, then it is likely that we will go challenging the $73 level underneath. The $73 level was an area of significant resistance previously, but I do not think that it will be as important this time if we get down to that area.
On the other hand, if we break above the top of the candlestick for the trading session on Tuesday, then it is likely that we could go looking towards the $79 level, an area where we had sold off from previously. If we can break above there and the $80 level, then it is likely that we could go much higher. Ultimately, this is a market that I do think continues to see plenty of buyers, and this will be especially true if we continue to see plenty of pressure. The market has been rallying for the last couple weeks, and the noisy behavior that we have seen over the last week or so is simply the market trying to build up enough momentum to continue what we had seen previously. I have no interest in shorting this market, but if we broke down below the $73 level, then we might see a little bit more of a correction, but that is about as negative as I plan on getting in this market anytime soon. This is a market that looks as if it is building up plenty of upward pressure.

Technical analysis update: WTI oil (3rd January 2022)WTI oil rose over 20% since its low at 61.46 USD on 2nd December 2021. We previously noted that weakness in the general stock market posed a threat for further rise of the price of USOIL in the short-term. However, since then the general stock market seems to stabilize. Because of that we regained our bullish view; additionally, we would like to set a short-term price target for USOIL to 77 USD.
Technical analysis - daily time frame
RSI continues to develop bullish structure. Stochastic is also bullish and MACD performed a bullish crossover above 0 points which further bolsters the bullish case for USOIL. DM+ and DM- show mixed conditions; and ADX declined substantially which suggests that the prevailing trend lost strength.
Technical analysis - weekly time frame
RSI points to the upside which is bullish. Stochastic is bullish too and MACD started to flatten (still in the bullish zone). We will observe MACD in the following weeks and we will watch out whether it manages to stay within the bullish zone and reverse back to the upside. DM+ and DM- show bearish conditions while ADX continues to decline. Though, ADX's value is a little bit higher than the value of ADX on a daily time frame.
Illustration 1.01
Picture above shows the weekly chart of USOIL. It also shows setup for head and shoulders being formed. We will observe whether this pattern will continue to develop further. However, at the moment, we believe this pattern will get distorted and price will continue higher.
Support and resistance
Following support and resistance levels are derived from the peaks and troughs in price of USOIL. Short-term support sits at 73.30 USD and short-term resistance lies at 77.41 USD. Next closest resistance appears at 79.20 USD and then at 81.78 USD. Major resistance lies at 85.39 USD. Major support level can be found at 61.76 USD.
DISCLAIMER: This analysis is not intended to encourage any buying or selling of any particular securities. Furthermore, it should not serve as a basis for taking any trade action by an individual investor. Your own due diligence is highly advised before entering trade.

WTI Crude Oil ForecastAs we get back to work, traders will have to put money back on their books in order to take risk on, and crude oil certainly looks like it is a great candidate for something like that. With the 50 day EMA sitting just below the $75 level, that means that the $75 level has little bit more psychology attached to it than usual. Nonetheless, you can see that we have skyrocketed over the last couple of weeks and I think it has become obvious as to which direction traders are starting to trade this market now that massive lockdowns due to the omicron seem to be off the table. That was one of the biggest concerns that most traders had, that economies would have to shut down and thereby kill the idea of demand for energy.
Now that traders have to get back to work, they will find alpha to generate, and crude oil is one of the best places to do so. While we did not completely wipe out the massive selloff from about a month ago, we got awfully close to it and that does suggest that perhaps we will eventually make that attempt once traders start to put full positions back on. Another thing to pay attention to is the jobs numbers coming on Friday, and that will also give us a big “heads up” as to potential energy demand, so it could be yet another reason to think that the market may go higher over the intermediate term. I have no interest in shorting this market right now, as I believe it is well supported all the way down to at least $70.

WTI Crude Oil Forecast: January 2022WTI Crude Oil Outlook for January
Speculative price range for WTI Crude Oil is 67.00 to 89.00 USD.
If WTI falters below the 73.00 level and begins to challenge prices below 70.00 this may be perceived as a bearish sign in the market. Having touched the 66.00 level in the middle of December, some traders may feel the urge to test downward momentum of WTI Crude Oil believing it can retest those lows. However, traders shorting the commodity should not get too ambitious.
The current direction of WTI may prove to be a solid bullish signal. If lows are tested, they may provide a solid position to ignite buying positions.
If WTI Crude Oil is able to penetrate the 77.00 price level and sustain its momentum, the price of 78.00 should be watched carefully. Technically, there is reason to suspect if late November prices are challenged with upwards price action that the 80.00 juncture could become a speculative playground for WTI like it was able to display in October and November.
While some skeptics may believe WTI Crude Oil has been overbought in the short term, the price is actually still under levels displayed a month and a half ago. If positive market sentiment continues to build into the global economic picture, traders may believe WTI could begin to challenge marks above 80.00 and aim for the 82.00 to 84.00 ratios without too many hurdles. Bullish traders who are optimistic may believe there is another leg higher that can be demonstrated in January for WTI Crude Oil.
WTI Crude Oil looks set to begin January within the higher realms of it one-month chart. That is a simple enough perception. But the fight for higher values has not been easy. Essentially from the second week of October until the middle of November, WTI Crude Oil was trading above the 80.00 USD level. Highs on the 25th of October saw the 85.00 mark challenged and this was nearly duplicated on the 10th of November.
On the 25th of November WTI Crude Oil was trading near 77.00, two days later it was challenging the 67.00 ratio. On the 2nd of December the 62.00 mark came within sight for the commodity. A price recovery ensued with choppy conditions prevailing, but on the 16th of December WTI was near 73.00, when a reversal lower abruptly took place again and a low of nearly 66.00 USD per barrel was demonstrated on the 20th. However since that recent low WTI Crude Oil has been a buyers’ market and as of this writing the commodity is approaching 77.00 USD.
Technically WTI has certainly confronted speculators with choppy conditions and risk management has proven an important tool. However, the swift movement in value has also provided traders an opportunity to take advantage of volatility and test their perceptions as global conditions move because of headline ‘noise’ and speculative nervousness.
While Crude Oil certainly saw its value erode in late November due to a new onslaught of fears caused by the Omicron variant, the past couple of weeks have seen an incremental climb. WTI Crude Oil now appears ready to begin January near values which could be ready to test marks last seen before the new coronavirus fears struck the marketplace in late November.
Technical traders may be somewhat skeptical of the move higher seen the past week because they may believe this has something to do with light holiday trading. While it may prove to be an important facet of the actual market regarding volumes, the ability of WTI Crude Oil to fight off of lows seen in early December and go into January almost having recovered it total price seen in late November is intriguing.

Us Oil distribution. Sell zone in red, target in green.Hello my beauties.
All you need for this trade setup is on the chart.
If you find this idea to be helpful like, follow, and drop a comment below if you'd want me to analyse a different pair.
Consider supporting me if you think I am providing you with value.
Peace.
Luca, TrickleDownFX

WTI Crude Oil Forecast: Price Captures 50-Day EMAThe West Texas Intermediate Crude Oil market rallied on Friday to capture the 50-day EMA. That is a very good sign and it looks as if we are ready to break out. That being said, we will have to see how this plays out due to the fact that there are a lot of questions as to whether or not the lockdowns are going to be an issue. At this point, it does not seem to be as big of an issue, so the question now is did we see the massive selloff due to fears of the omicron variant, or are there are concerns about slowing growth in general?
When you look at the chart, you can see that the $73 level had offered quite a bit of resistance, and now that we have broken above there, it does suggest that we are ready to continue going higher. At this point, I would anticipate a move towards the $79 level, which is where the wipeout candle came into play several weeks ago. Getting to the top of that would be a very bullish turn of events for the crude oil market, and it certainly looks as if we could make that move based upon the fact that there really is not much in the way of resistance between here and there other than the 50 day EMA where we are currently sitting. That is only psychological at best, so it is very likely that we are going to continue grinding away to the upside.
If we do pull back from here, I think that the $73 level should offer a certain amount of support as it had been previous resistance, so “market memory” could come into play. If we turn around and break down below the $73 level, then we may have to reset at much lower levels, but right now that does not look like it is the most likely of outcomes. Looking at this chart, it looks to me like the recovery has been very strong, and I think the momentum will continue to pick up. Over the next couple of days, I would anticipate more of a back-and-forth type of situation, but by the time we get back to work in January, we could go much higher.

WTI OIL The important 1D MA50 testWell I've been tracking and trading the pattern you see on this chart for over a month and the very last formations have played out particularly well:
Right now WTI is ahead of the first important test of this uptrend, the 1D MA50 (blue trend-line) which is currently posing as a Resistance. If that breaks, we have a strong case of a bullish continuation. However, this the current wave is repeating that of August - September quite closely, the (yellow) Lower Highs trend-line will be critical as well, and what I am particularly looking as confirmation is a rejection there, hold on the 1D MA50 and the red Ichimoku area and then a strong bullish break-out. The RSI is so far on course for its Symmetrical Resistance of those Lower Highs. If that breaks, our next target will be $85.00.
--------------------------------------------------------------------------------------------------------
** Please support this idea with your likes and comments, it is the best way to keep it relevant and support me. **
--------------------------------------------------------------------------------------------------------

WTI Crude Oil Forecast: Crude Oil Approaching 50 Day EMAThe West Texas Intermediate Crude Oil market has initially dipped a bit during the day on Thursday, only to turn around and show signs of life again. By doing so, it appears that we are threatening the 50 day EMA just above. This of course is an important technical indicator that a lot of people pay attention to, so do not be surprised at all to see a bit of a reaction. You should also keep in mind that the Friday session is a shortened futures session due to the holiday, so therefore you need to be early to the market. Once we hit noon in New York, things will suddenly drift off.
Crude does look like it is trying to take out the 50 day EMA and whether or not it can do it on Friday is a completely different question. However, it certainly looks as if we are building up pressure to do just that. If we do take out the 50 day EMA, then my next target would be the $70.40 level, where we had sold off from previously. If we were to take out that big wipeout candle, that would of course be a very bullish turn of events for the market.
That being said, I am hesitant to put on big positions this time year anyway, and especially a market like oil which shuts down. The 200 day EMA underneath at the $69.43 level is the “floor the market” from what I see, so as long as we stay above there, I think we still have a good shot at rallying, but if we were to take that out to the downside, then I would anticipate a move down to the $65 level.
There is a lot of push and pull when it comes to the idea of demand for crude oil, as omicron variant has not been as bad as people had anticipated. With that in mind, I think people are starting to step out into the risk curve a little bit and buy oil. Ultimately, a lot of this will be settled in January, but it certainly looks as if we are going to end the year on the right foot when it comes to crude oil prices and therefore the buyers will probably feel pretty good going into January.

TODAY UP SMELL, US BEARING, OIL ROARINGI’ve been watching the market shifting from yesterday to today’s movements, all pair are gaining against the US dollar. One of the is USDCAD, that pair made me smell the Oil rally. IMHO this is only the start of a morning where the press talks about it. Oil will rise and US will. Be red today. If you are there and believe my theory for today give me a thumbs up and a like!

USOIL Price TargetIf you haven`s shorted the top here:
Then you should know that USOIL seems to be heading to its major support at 60.40usd.

Brent is ready to Sell off AGAIN!Hey guys
The number of case new version of Covid 19 (Omicron ) is increasing in EU and UK this week so and the demand of Oil is decreased every week . I believe that the oil price is going down again

Wyckoff distribution schematics for USOIL!Hello my beauties.
I think oil has been clearly showing signs of a distribution, with a price target measured on the basis of the range volatility, identified by the green area underneath.
If you find this idea to be helpful like, follow, and drop a comment below if you'd want me to analyse a different pair.
Consider supporting me if you think I am providing you with value.
Peace.
Luca, TrickleDownFX

Elliott Wave count for OILHello everyone hope you spending a good weekend, Here's the update for WTI Crude Oil in H1 timeframe, In the last count in H1 timeframe I expected to see an impulse for the first leg of wave X but seems the first leg is done already with 3 waves. You can see the details in the chart, If you have any idea or question about this scenario please share with us in comment. I will provide more Elliott wave count daily if you are interested follow us to receive updates.
📣 Attention 📣
⚠️ 1. We publish this trading idea to help analysts, so if you have an idea that you think is right, do not be influenced by this idea.
⚠️ 2. All our analysis and signals are provided free of charge, so we have no obligation to make any profit or loss on our signals and analysis.
⚠️ 3. If you have an idea, write to us in the comments section, we will be happy to use your idea in our analysis
