USOILThat's a bottom for me on crude, possible downside to $58 as daily stoch rsi looks overbought but the bulls can easily keep the LTF overbought long enough to make a stronger push back up to ATH, then allow for a higher high on the LTF b4 finally capitulating up to the W5 1.618 fib extension target $108.
Wticrudeoil

WTI Crude Oil Forecast: Crude Oil Looks Set to Pull BackThe West Texas Intermediate Crude Oil market has initially tried to rally during the trading session on Thursday, only to break down rather significantly and show signs of extreme weakness. By doing so, the market looks as if it is probably going to test the 200 day EMA underneath, which currently sits at the $69.21 level. Whether or not we break down below there is a completely different question, but it is worth noting that the $73 level has been a bit like a brick wall, and therefore I think at the very least we have a pullback coming.
The 200 day EMA will obviously attract a lot of attention, but whether or not it holds will remain to be seen. If we break down below there, then it is likely we go looking towards the $65 region, where we had a major uptrend line and a hammer form and bounced from. The market is more than likely going to respect that area, but if we break down below the $65 level, then it is very likely that crude oil will break significantly lower.
A lot of this is going to be interesting to watch over the next couple of weeks, because part of what we are seeing here is the fact that liquidity will start to dry up towards the end of the year and therefore you need to pay close attention to your position size. After all, you may get the occasional spike that causes havoc for your account. If we can break above that $73 level finally, then I think the market goes looking towards the $75 level, which also happened to be where the 50 day EMA is. The question now is whether or not the markets are going to start pricing in a massive slow down economically or are they going to start looking towards the fact that demand for crude oil could continue to go higher based upon the reopening trade. Omicron did cause quite a bit of wreckage in risk appetite around the world, but it does look as if the variant is not going to be as dangerous as some of the others. However, if governments continue to try to shut everything down, that obviously has a very negative effect on crude oil.

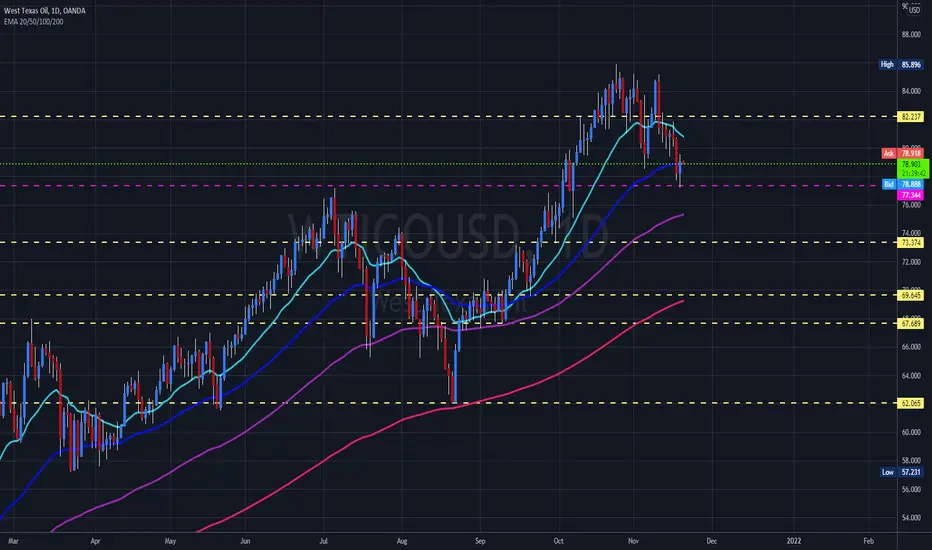
WTI Oil can rise above 80 (again)From 25th October's high at around 85, Oil has started to correct and dropped to strong demand zone between 62 and 65.
Now, this correction seems to be over and we can have a leg up above 80 again.
I'm bullish as long as the price is above 65 and, in my opinion, dips should be bought


WTI OIL approaching a medium-term ResistanceThis is an update to my WTI Oil outlook made over a week ago:
Despite breaking below the 0.786 Fibonacci retracement level and the Higher Lows trend-line of the multi-month Bullish Megaphone pattern, the price managed to close all 1D candles within the pattern and formed a Support. It has come very close to my first 73.50 Target which is near the 0.5 Fibonacci level and the 1D MA100 (green trend-line). I consider this a strong Resistance, in fact the whole zone as high as the 1D MA50 (blue trend-line), where we can see a weekly consolidation and sideways trading in a similar way as in late August - early September.
Short-term traders may buy if the price breaks above the 1D MA100 and target 76.30 and engage for a more long-term trade only if the 1D MA50 breaks (TP 85.00 in that case).
--------------------------------------------------------------------------------------------------------
** Please support this idea with your likes and comments, it is the best way to keep it relevant and support me. **
--------------------------------------------------------------------------------------------------------

WTI Oil analysis | 1D - BullishOur buying position will be active for the next 2 months and the oil price will be $ 100.
- oil price can be 100$ for this winter !

"WTI Crude Oil" Resistance and support zonesDue to the end of the cold season, we have a pandemic and an increase in the supply of OPEC, we have an adjustment in oil prices. But now due to the strength of the dollar the right area sales are slightly higher

CRUDE OIL / Seeking higher highsTVC:USOIL
Let's say this first - I'm no expert and probably wrong . My trading experience is very limited . However I have followed the market fairly closely over the last couple years and today I had too much time to stare at charts. Let's look at the above chart that I haven't been able to look away from today.
First chart in question is of WTI Crude Oil since the start of this year. Sentiment has been very bullish during this time with smaller dips developing into larger movements as we've moved towards the end of the year. These white trend lines however have held very well during this period. Volume profile (emphasis highlighted) would seem like there would be less resistance to go up than down.
If there would be a sharp move down towards 58 or lower that would be a level where I would start to be more cautious and probably close most of my own positions at least for a while.
This recent price movement has been very sharp and would implicate in my view either a significant risk for another lockdown/recessionary period (less demand) or a release of reserves / supply increase (more supply), both of which I think are possible but not that probable in my opinion. China real estate market would be the most obvious and likely source for a longer downtrend in all markets including crude oil, but it seems to be contained for now.
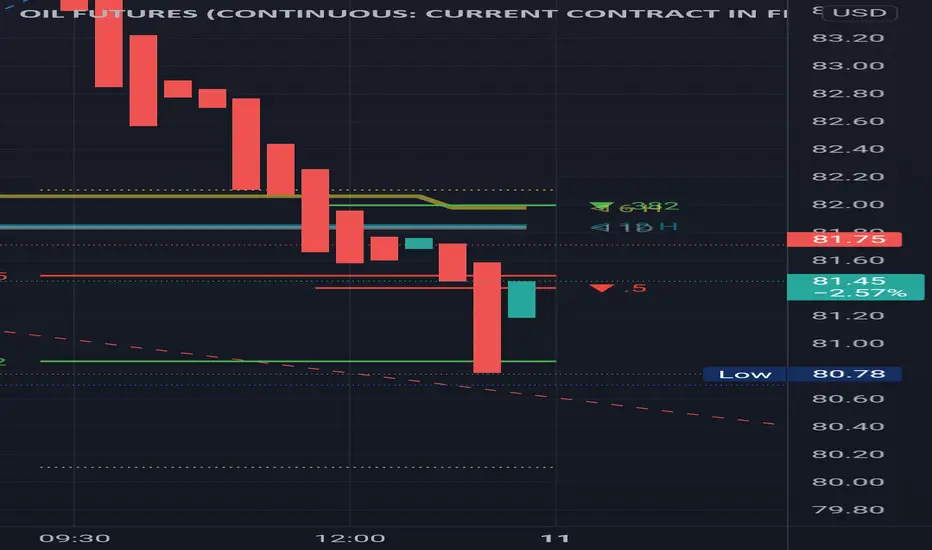
Taking a closer look, overall there seems to be good amount of support around the price of this writing at around $66.4. Price action during the last 12 hours also seems supportive in my view, which I followed during the day. As a curiosity, the movement for the second period pictured has been pretty similar to the first one that started on 30th Nov.
Again I have very little trading experience but this seems like a good time to be bullish on oil. Long-term I think that under-investment in oil production and infrastructure will prove to be a significant factor in driving crude oil price higher.
Feel free to comment what you think. Trade safe.

Crude Oil Plummets on OPEC DecisionOPEC Agrees January 2022 Supply Hike
Less than one month ago, WTI Crude Oil was trading at about $85 per barrel, which was a multi-year high price. Over the past three weeks the price descended rapidly from that high, and today extended that trend to approach the 6-month low price at $61.76. The pace of this downwards trend accelerated a few days ago with the news of the discovery of the omicron coronavirus variant. As there are fears that this variant may be dealt with by lockdowns and trade shutdowns or delays, if its potency is revealed to be high, we can expect a drop in demand, which will inevitably mean a drop in the price of WTI Crude Oil.
It was against this backdrop that the Organisation of Petroleum Exporting Countries (OPEC) agreed a short while ago to extend the supply of January 2022 Crude Oil by 400,000 barrels per day. There are initial reports that the members are also agreed to review this decision if demand does drop rapidly over the coming weeks.
WTI Crude Oil Price Action
The price of WTI Crude Oil has fallen strongly over the past few days. It has fallen by more than 25% in value since reaching a multi-year high of $85.39 on 25th October 2021. The pace of the fall has quickened recently. The drop is showing what might be initial signs of exhaustion as it approaches the key support level at $61.89 which represents the lowest price seen since May 2021.
What Does This Mean for Traders?
Traders should be aware that if the omicron coronavirus variant is resistant to existing vaccines and can also cause serious illness to vaccinated people, governments may well react by initiating another round of shutdowns for a while, as they did in March and April 2020 when the disease really began to spread worldwide.
The lockdowns, shutdowns, and trade restrictions that were put in place in the spring of 2020 did a great deal of economic damage, although most economies rebounded strongly after this period as restrictions were eased.
The panic of March 2020 saw huge and very rapid directional movements in the markets, but nothing was as spectacular as the price action in WTI Crude Oil, with futures actually going into negative territory for a while. This and the subsequent strong rebound gave traders and speculators some incredible trade opportunities, first short, then long.
If history is going to repeat itself, even if on a smaller scale, the price of WTI Crude Oil has good reasons to fall further, in line with the long-term trend. How far it might fall is anyone’s guess, but if omicron is economically destructive, it is very likely to.

US oil short position Bears are always welcome in the oil market, we have seen a huge rally for oil in April 2020, some producers have made a big reserve of production.
we always see that the market has always to correct the direction allowing some associated to collect their profits, bulls out bears in. for the next period we find bearish news looming on the horizon,
-Omicron is snappily getting the dominant COVID-19 variant in South Africa lower than four weeks after it was first discovered in the country, with
theU.S. reporting its first case on Wednesday.
-Some had speculated that OPEC+ could pause those additions in an attempt to slow supply growth, now expected to yield a surplus of 3.8 million
BPD by March 2022, according to an internal report seen by Reuters. OPEC+ is likely to make its decision on Thursday.
-The United States, in tandem with several other nations, announced plans in November to release 50 million barrels of its reserves into the market
to try to cool energy prices. Retail gasoline prices have barely changed even as unfinished gasoline futures known as RBOB have dropped sharply.
News resource
-----------------------
theoilsellers.com
reuters.com
Our position
----------------------
Sell position on 63 $-64 $
----------------------------
73.20 $ -74.40 $ sell limit just in case the price reverses against our position before it continues falling
----------------------------
Targeting : 55 $-56 $ support area

WTIUSD Pattern on H1Here's my idea for WTTIUSD. It should be going bullish. When reaching Order Block, it's your area to look out for. You can take 10R. Safe Trade!

WTI OIL Rejection on the 1D MA50Pattern: Megaphone on the 1D time-frame.
Signal: Sell as the price has been rejected on the 1D MA50 (blue trend-line) and buy before it touches the 1D MA200 (orange trend-line) or when the RSI hits the Support Zone.
Target: 85.40 (the October 23 High).
--------------------------------------------------------------------------------------------------------
** Please support this idea with your likes and comments, it is the best way to keep it relevant and support me. **
--------------------------------------------------------------------------------------------------------

Is it possible for OIL prices to fall below $ 40?After falling from $ 107 to $ 26, the price stopped at $ 76 in a bullish wave. After falling price below $ 12, it was able to cross the $ 76 area in the next uptrend. We are currently waiting for the price correction. The ranges $ 46-43 or $ 36-33 could push the price towards the $ 103-108 .

WTI Crude Oil Forecast: Crude Oil Trying to RecoverThe West Texas Intermediate Crude Oil market has broken down a bit during the course of the session on Thursday but has seen a bit of buying pressure to test the 50 day EMA. The market is forming a bit of a hammer, and now that we have had a nice pullback, it does make a certain amount of sense that we would see this market continue to go higher. At that point, it is likely that the market would go looking towards the $85 level, which is where we had recently formed a bit of a “double top” previously. I think the $85 level is more likely than not going to be the target, and I do not think that it will be easy to break above.
On the other hand, if we were to break down below the bottom of the hammer for the trading session on Thursday, then it opens up a move down to the $75 level. That is an area that I think has a lot of psychology attached to it, and therefore I think I would be a bit surprised to see this market break down below there. Even if it did, the 200 day EMA is reaching towards the $70 level as well, so I think that is your “floor the market” going forward. Nonetheless, we have formed a nice hammer for the day, and this does suggest that the buyers are trying to step up and pick this market up. If that is going to be the case, then it is probably only a matter of time, or we turn around and go looking towards the $85 level above.
Looking at this chart, this is a market that will continue to be very noisy, but you should keep in mind that we are in an uptrend . That is probably the most important thing here to pay attention to, so because of this you need to keep the “buy on the dips” type of set up in mind, as trying to short a market that has been so strong for months on end would be rather foolish and probably a great way to lose money. If we can somehow break above the $85 level, then it is likely that we could go much higher, perhaps filling the idea of a $100 target.

WTI OIL can go much lower based on this patternIt was exactly one month ago (October 19) when I reversed my bullish thesis on WTI Crude Oil, calling for a top and a reversal:
As you see, the top got priced exactly on the March Higher Highs trend-line and the rejection successfully took place. Even early into November, the Lower Highs peak formation was clear:
Back to today. In my firm's outlook, since the 1D MA50 (blue trend-line) broke, the only level that may support Oil is the 1D MA100 (green trend-line) and that only temporarily. Why? Because this is what happened last time on July 20, a short-term hold there followed by a dead-cat bounce above the 1D MA50 again only to serve as a new rejection towards the 1D MA200 (orange trend-line) where the price eventually made the bottom.
As you see, the major pattern since March is a Bullish Megaphone which besides the Higher Highs, has also a Higher Lows trend-line that Supports. A new contact with that trend-line would be on the 0.786 Fibonacci retracement level, which was where the bottom was formed last time on the Higher Lows trend-line in August 20. Corrections of -15% are common within this Megaphone pattern and another such correction would make a low right above the 1D MA200, which I believe will be the bottom and will prevail over a deeper contact on the Higher Lows trend-line.
--------------------------------------------------------------------------------------------------------
** Please support this idea with your likes and comments, it is the best way to keep it relevant and support me. **
--------------------------------------------------------------------------------------------------------

WTICOUSD-Testing 50-Day EMAThe West Texas Intermediate Crude Oil market fell on Wednesday to reach down towards the crucial 50-day EMA. The 50-day EMA is an area that will continue to cause a certain amount of attention, but it should be noted that we have sliced through the $80 level rather easily. We are closing towards the bottom of the range for the day, so now the question is whether or not we will have follow-through. That typically is the case that when you close towards the bottom of the range; quite often you will see a bit of follow-through in the next session.
There are a lot of concerns out there that the Biden administration may release the Strategic Petroleum Reserve, which could bring down pricing for a short-term move, but longer-term it tends to have a very limited effect on the markets. Because of this, I think that we will eventually have a nice buying opportunity, but it is a scenario where we need to pay close attention to the idea of value as it occurs, because there is no reason that I can see for a longer-term trend change. The market looking at the consolidation area could probably see it as a bullish flag being formed.
This is a market that I think continues to offer plenty of value, so it is likely that we could eventually find quite a bit of buying pressure. Keep in mind that the inventory numbers coming out of the United States will continue to dictate where we go, and we have those over the next 24 hours. Underneath, I think the $75 level is going to end up being a bit of a floorin the market, unless of course there is some type of huge negative attitude out there, something that I have not seen much of recently. In fact, one could make an argument for the recent action forming a little bit of a big “potential double bottom” in what would be a continuation longer term. We will have to wait and see, but that is one potential set up if we can break above the highs of the day, extensively recapturing the $80 level. I do not like shorting oil right now, but that does not necessarily mean you need to jump in with both feet.
This is a market that I think continues to offer plenty of value, so it is likely that we could eventually find quite a bit of buying pressure.
Technical analysis update: WTI oil (2nd November 2021)USOIL ceased its decline at 80.62 USD per barrel just three days ago. Since then USOIL reversed to the upside and now it trades around 84.25 USD per barrel. In our previous two ideas we noted that despite correction in price we would remain bullish on oil in medium-term and long-term. In addition to that, we noted correction in price could serve as good (re)entry opportunity for long position. Demand continues to pick up while recovery progresses further; and we continue to maintain bullish stance as we expect price to climb even higher. We would like to set new short-term price target to 85 USD per barrel. Our medium-term price target is 87.50 USD while our long-term price target remains 90 USD.
Technical analysis
RSI is bullish as it strives to penetrate 70 points into overbought territory. If it manages to do so, then we expect such occurence to be accompanied by further rise in price. Stochastic is also bullish, however, MACD is bearish. DM+ and DM- remain bullish. Although, ADX started to decline slightly which suggests that trend is weakening. Overall we are bullish on USOIL.
Support and resistance
Major resistance sits at 85.39 USD. Short-term support sits at 82.50 USD and Support 1 lies at 80 USD. Support 2 appears at 76.95 USD while Support 2 lies at 74.21 USD. Then major support level sits at 61.58 USD.
Our latest idea on USOIL from 28th October 2021:
Disclaimer: This analysis is not intended to encourage any buying or selling of any particular securities. Furthermore, it should not serve as basis for taking any trade action by individual investor. Your own due dilligence is highly advised before entering trade.

Technical analysis update: WTI oil (18th November 2021)We abandoned short-term price target of 85 USD in our previous idea (as correction resumed). In addition to that, we noted that it was very likely that price would drop towards 78 USD. Currently, USOIL trades slightly below that level. We will observe WTI oil in the following days and we will look for more weakness or possible end of correction. Though, at the moment, we think it is likely correction will continue little further towards 76 USD. Because of that we will watch support level at 76.95 USD; and we will observe whether this support will be able to hold further selling pressure. Technical analysis on daily time frame suggests more weakness for oil. Despite that, we think current price is very attractive to start considering (re)entry of long position in WTI oil, however, with big cautiousness.
Picture below shows USOIL on daily time frame.
It also shows possibility of bearish breakout below crucial support level at 76.95 USD. If this support is broken then we expect price to drop even further.
Technical analysis - daily time frame
RSI and Stochastic are very bearish as they continue to move downward. MACD is also very bearish. Indeed, MACD nears crossover into bearish area. If MACD manages to perform crossover then we expect such occurence to be accompanied by more selling pressure. ADX contains low value which suggests that trend is either neutral or very weak. Technicals are overall bearish and suggest more trouble ahead for USOIL.
Technical analysis - weekly time frame
RSI has bearish structure. MACD remains in bullish territory, however, it strives to reverse into downside. Similarly, Stochastic is in bullish area but it already reversed its direction into downside. DM+ and DM- still suggest that bullish trend is present but ADX continues to decline which reflects that this trend is weakening.
Support and resistance
Major resistance sits at 85.39 USD while major support lies at 61.58 USD. Short-term support level sits at 76.95 USD. Another (closest) important support appears at 75 USD (as psychological support).
Disclaimer: This analysis is not intended to encourage any buying or selling of any particular securities. Furthermore, it should not serve as basis for taking any trade action by individual investor. Your own due dilligence is highly advised before entering trade.

WTI starting to recover from inflation driven plungeHello everyone, as we all know the market action discounts everything :)
_________________________________Make sure to Like and Follow if you like the idea_________________________________
Oil prices surged above $83 per barrel in volatile trading on Thursday, recovering from significant drops caused by concerns about rising US inflation, as OPEC reduced its 2021 oil demand prediction owing to high energy prices.
In a monthly report, the Organization of Petroleum Exporting Countries (OPEC) stated that it expected oil consumption to average 99.49 million barrels per day (bpd) in the fourth quarter of 2021, a 330,000 bpd decrease from last month's prediction.
Possible Scenario for the market :
The market is currently trading at $81.26 and looks like it going to the support line located at $80.17 where a battle will happen between the Bears and the Bulls over control, the outcome will probably be in favor of the bulls which will cause the market to increase in value reaching the first resistance at $84.08.
in case the demand for oil increases even more then we will most likely see a further push that could reach the $88.00 level by the end of the week.
Technical Analysis show :
1) The market is below the 5 10 20 MA and EMA indicating a Bearish Short-term movement, but still above the 50 100 and 200 MA and EMA indicating a Bullish Long-term trend
2) The RSI is at 51.61 showing good strength in the market with a small Bullish divergence that could be a sign of a Bearish short-term trend.
3) The MACD is above the 0 line still indicating a Bullish market, but it has a Negative crossover between the MACD line and the Signal line indicating a small Bearish movement.
Support & Resistance points :
support Resistance
1) 80.17 1) 84.08
2) 78.63 2) 86.45
3) 76.26 3) 87.99
Fundamental point of view :
OPEC expects global consumption to hit 100 million bpd in the third quarter of 2022, three months later than predicted last month.
On Wednesday, data indicated that inflation in the United States surged by 6.2 percent, the quickest rate in 30 years, owing primarily to increasing energy prices, which pushed the dollar higher while sending Brent and WTI oil down by 2.5 % and 3.3 %, respectively.
A surge in US oil supplies following the government's release of some critical reserves pushed up prices even further.
In reaction to rising inflation, US President Joe Biden stated he directed the National Economic Council to concentrate on lowering energy costs and the Federal Trade Commission to crack down on market manipulation in the energy industry in order to reverse inflation.
This is my personal opinion done with technical analysis of the market price and research online from Fundamental Analysts and News for The Fundamental point of view, not financial advice.
If you have any questions please ask and have a great day !!
Thank you for reading.

WTI OIL FUTURES TEXASThis is the current sentiment in this current time/space. The Law of Propetual Motioin...

WTI Cude (OIL) SELL TRADE IDEA
💹WTI Crude Oil ⏬ SELL @ 80.99
✅TP-1# 80.09
✅TP-2# 79.10
✅TP-3# 78.10
⛔️SL 82.00
N.B- If have small balance to trade. Plz avoid OIL trade now.
Because market highly volatile.
AronnoFX will not accept any liability for loss or damage as a result of
reliance on the information contained within this channel including
data, quotes, charts and buy/sell signals
If you like this idea, do not forget to support with a like and follow.
Traders, if you like this idea or have your own opinion about it,
write in the comments. I will be glad.

WTI Oil analysis 1D | SIGNALOur buying position will be active for the next 2 months and the oil price will be $ 100.
- oil price can be 100$ for this winter !
