Wticrudeoil
WTI Oil : Stop Hunt /HH to 67.80 -68.20 handle possibleAfter the stop hunt /HL around 61.65 ,Price returned to the old daily range 63.50-67 indicating it will continue to trade inside the range or an upside break out since the SSI is around 25% and every dip is bought strongly .
Trend : Range
Signal : Sell Limit 67.80-68.20
Stop Loss : 68.75
Target : 65-63.75

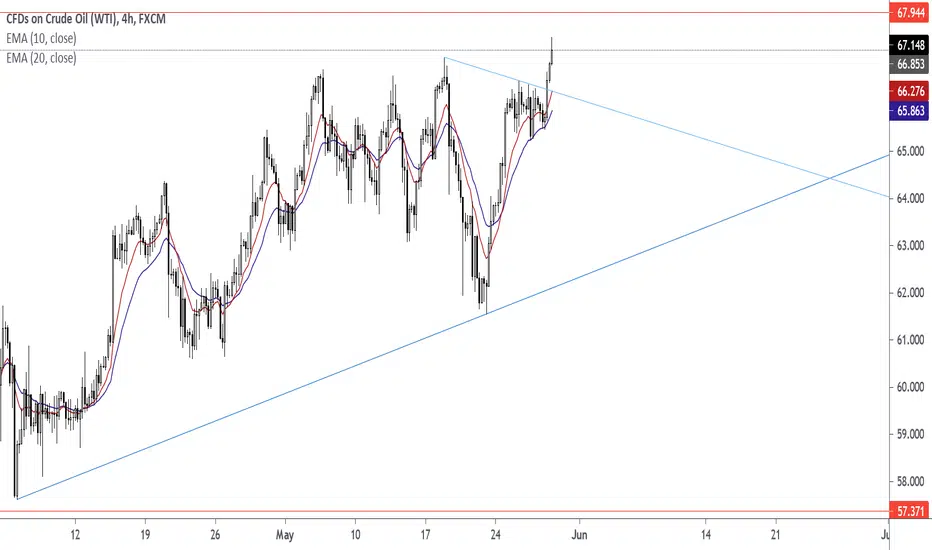
WTI OIL Resistance Zone being tested. Action plan.Pattern: Descending Triangle on 4H.
Signal: As long as the Resistance Zone stays intact, sell (A). If broken buy (B).
Target: (A) 62.50 (the 0.382 Fibonacci retracement level), (B) 68.30 (the 1.618 Fibonacci extension level).
** Please support this idea with your likes and comments, it is the best way to keep it relevant and support me. **
--------------------------------------------------------------------------------------------------------
!! Donations via TradingView coins also help me a great deal at posting more free trading content and signals here !!
🎉 👍 Shout-out to TradingShot's 💰 top TradingView Coin donor 💰 this week ==> NMOTION29
--------------------------------------------------------------------------------------------------------

Crude Oil to 75???? Looks like it...After the recent drop under 60, bulls took control and drove the price to 66 resistance again.
The bullish sentiment for Oil is obvious and a break above this resistance looks imminent
The next technical target is 75

USOIL Can Go Ballistic If This Happens...Traders, USOIL Can Go Ballistic If This Happens:
1. It is right now in an FCP zone which acted as resistance we found good short trades.
2. If this FCP zone is violated and the price action confirms it, we can look for upwards FCP zones that we found in the previous analysis.
3. The first FCP (Fibonacci Confluence Zone) is at good round number USD 70.
4. If expect a move down or some reaction to that zone to the downside
5. If that's broken, we are looking at 74-75 FCP zone.
Beware, this market is over stretched and can have large sudden corrections to the downside.
Rules:
1. Never trade too much
2. Never trade without a confirmation
3. Never rely on signals, do your own analysis and research too
✅ If you found this idea useful, hit the like button, subscribe and share it in other trading forums.
✅ Follow me for future ideas, trade set ups and the updates of this analysis
✅ Don't hesitate to share your ideas, comments, opinions and questions.
Take care and trade well
-Vik
____________________________________________________
📌 DISCLAIMER
The content on this analysis is subject to change at any time without notice, and is provided for the sole purpose of education only.
Not a financial advice or signal. Please make your own independent investment decisions.
____________________________________________________


WTI - MUST GO UP ! Fluctuating stocks, Iran on the horizon, yet oil must rise. primarily because we have an increase in consumption. Then because commodity inflation is increasingly visible. And last but not least, because he is still needed. Long oil!

Technical analysis update: WTI oil (28th April 2021)West Texas Intermediate oil is consolidating in neutral trend since 8th March 2021. Since then, price action took WTI back to its 20-day moving average and 50-day moving average which suggests that consolidation might be near its end and upward movement can be anticipated. This is further supported by reversal in RSI. Our price target for short term is 65 USD per barrel.
Disclaimer: This analysis is not intended to encourage buying or selling of any particular securities. Furthermore, it should not serve as basis for taking any trade action by individual investor. Your own due dilligence is highly advised before entering trade.

WTI Crude Oil.. Analysis..Crude oil is one of the most in-demand commodities, with the two most popularly traded grades of oil being Brent Crude and West Texas Intermediate (WTI). Crude oil prices reflect the market’s volatile and liquid nature, as well as oil being a benchmark for global economic activity. The oil price charts offer live data and comprehensive price action on WTI Crude and Brent Crude patterns. Get information on key pivot points, support and resistance and crude oil news.
Daily Classical Pivot Points. Last Updated: Apr 25, 2021

WTI OIL First 4H Golden Cross since November!WTI Crude Oil has just formed a Golden Cross on the 4H chart (MA50 (blue trend-line) crossing above the MA200 (orange trend-line)), the first since November 12, 2020. The price action since March 12 is quite similar to late October - early November. After the Death Cross on October 27, 2020, a bottom was formed a few days later. Once the Golden Cross was formed on November 12, 2020, the very aggressive rally of December - March was initiated. We are on a similar situation right now. The March 26 Death Cross may have priced the Bottom and if so, then today's Golden Cross may kick-start a new rally. I expect a value above $70.00 before June.
Most recent WTI signal:
** Please support this idea with your likes and comments, it is the best way to keep it relevant and support me. **
--------------------------------------------------------------------------------------------------------
!! Donations via TradingView coins also help me a great deal at posting more free trading content and signals here !!
🎉 👍 Shout-out to TradingShot's 💰 top TradingView Coin donor 💰 this week ==> kylevd23
--------------------------------------------------------------------------------------------------------


WTI Crude Oil..Wait for sell..Trade At Your Own Risk (TAYOR)Decending triangle.. Wait untill break below triangle..

Chart of the day: The chop in WTI continues...The chop in WTI continues but bullish factors outweigh the negatives.
Oil prices has been through rough couple of sessions after suffering a more than 10% drop on the 18 of March. The biggest "challenge" to the bull case for oil has been the rise in virus cases, more recently from India which is the world's third largest oil importer.
However, the fact that Saudi Arabia was confident enough to raise supply going into June is a positive factor. Aramco (state owned oil company) receives orders from global refiners two months in advance.
Thus, if they were comfortable to raise output in May and June, it means they are comfortable with what they are seeing under the hood in terms of demand.
Apart from that, despite the rise in cases in certain parts of the world, the global vaccination roll out is gathering a lot of pace with close to 700 million vaccinations administered. If we can keep up this pace, the reopening narrative that drove a lot of oil demand expectations is still intact.
Inflation is the other point to consider. Commodities, and more specifically oil, shares a positive correlation to inflation expectations. Thus, the rise in inflation expectations, with the anticipation of higher actual inflation going into Q2's easy base effects is another positive factor for commodities.
Techically, the support are between $57 and $59 has acted as a very important barometer, as long as that holds, and as long as OVX (oil volatility index) continues its recent downward trending move, the short term and med term bias for WTI remains tilted higher.

WTI before decisionThe short-term downward trend, since the movement high of 8 March, continues to hold the black gold of the global economy in check. As can be seen impressively, US WTI oil has already been clearly rejected from this trend line several times and especially just yesterday at the start of the week. Monday's setback almost took it back to support at USD 57.40. Accordingly, the tension could not be greater. A defence of this level still allows a quick upward reaction to 62.00 USD. If there is further buying interest, a reaction to the level of 66.00 USD is possible, before the round 70.00 USD mark could be put on the agenda again. However, the dominance on the long side should come into play immediately.
If, on the other hand, the support level of USD 57.40 is abandoned, one would have to take into account an extension of the price weakness to the next support level at USD 52.00. A dip below this level would be a serious threat to the price. A dip below this level would be critical for the further course.

Crude Oil - Thoughts for 5 April 20218 hr chart with monthly view
Possible flag forming starting 23 March with last leg under development
50% retrace from 23rd low is 62.5x
Volume profile from March is outside of February which could be indicating a sideways month
April S1 is 55.1x and R1 is 65.8x and could possibly form the trading range for the month
Short term looking for a setup to take price first to S1 and then to R1 toward end of April
4hr Chart with weekly view
Looking at flag on chart with last leg under development
Volume profile for coming week inside last week's indicating a possible breakout week
Pivots compressing week over week with previous week compress 41% and this past week an additional 28%
Looking for fill of flag then larger correction down to April S1 (55.1x). Not sure how fast correct will occur or if this week consolidates more.
Weekly R1 is 62.71 and potential target for top of flag
100 tick renko
DEMA flipped negative signaling more down to come
looking for red brick with long wick high for trigger to buy June Puts
{/list]
50 tick renko
Flag developing. looking for completion to find a signal or trigger

Crude oil. LongOil price rises as Suez Canal developments offset by Russia’s crude output curbs.
Buying wti above the triangle for beautiful swing trade.
Entry @ 61.35
Tp 67.50
Sl 59.00

NYMEX LIGHT CRUDE FUTURE MAY FALL IN APRILThe chart give you all details of ELLIOT wave count for NYMEX light sweet crude futures.
I noticed that his commodity recovered in 'V' shape from ABYSS(3rd of3of wave5) and erased all its losses to $60
But this recovery has one more test for final wave C5v, I assume that this will finish nextmonth (april)for 0.618 times of c5i at $46
comments are welcome

The chop in WTI continues...The chop in WTI continues as volatility & supply give mixed signals.
Yesterday we highlighted the importance of keeping track of the move in OVX (oil volatility) after the big spike into the close on Wednesday. At the open yesterday, we saw OVX come down sharply but failed to take out the prior low and confirmed the recent upward trending move in volatility is still in place (negative for the underlying asset).
Thus, from a pure volatility point of view the probability if higher for further downside for WTI. However, the issue with the Suez Canal being blocked, and reports out earlier during Asia-Pac that the efforts to unblock the ship might take another week saw some relief for Oil prices.
So, where to from here? The med-term bias remains tilted to the upside, but we've had very violent moves in volatility over the past few sessions which is a warning sign.
For now, the best option is to wait and see how volatility behaves in today's session. If the Suez concerns are enough to keep price elevated and we see OVX taking out recent lows, that could be setting up for a long opportunity.
However, if we see OVX maintain it's upward trending move despite the more constructive price action, it might be best to stay on the side lines in the short-term.

WTI on the verge of a reversal?The rally of black gold in the form of the oil price, especially the WTI grade, peaked at the beginning of the month in the direction of the USD 70.00 mark. The appreciation, which became increasingly pronounced with the breakout at the end of 2020, ended just before this. The support level around USD 59.00 per barrel was fiercely contested these days. However, with yesterday's price weakness, after the impulse recovery from the talk, WTI oil is again at a stalemate. If new lows can be prevented, there could be a rapid upward movement to USD 62.00 and beyond to USD 66.00 as part of the defence of the upward trend line since December. The USD 70.00 mark would be within reach again.
Below USD 57.40, on the other hand, a further downward wave to the next support at USD 52.00 would have to be expected. A dip below this would be critical. Contrary to the actually bullish seasonality, there could then be further declines to 48.00 and 46.00 USD.
If you liked the analysis, we would be pleased if you liked or subscribed to it. You will be supporting our work enormously!
Notice:
Despite careful analysis, Global Investa assumes no responsibility for the content, timeliness, accuracy or completeness of the information provided. In particular, the information provided does not constitute investment advice, a recommendation to buy or investment brokerage and can in no way replace investor- and investment-appropriate advice from a professional investment advisor who takes into account the client's individual economic circumstances and level of experience.

What does yesterday meteoric spike in OVX mean for WTI?We don't know yet. OVX shot up to 64.91 into yesterday's close. It is unclear whether this might be a glitch on CBOE's side, or whether it might be month-end or quarter-end related, but it was a meteoric jump.
To put the size of the move into context, very recently in Septmeber and November when we had similar spike, it came as a result of a 16% and 14% drop in WTI. Compared to yesterday where prices barely moved 2% from the close to the Asia-Pac lows.
The challenges at the Suez Canal might have led to an abnormal increase in implied volatility, but if that os the case it would be a major "over-reaction" on the options side of the market. The other possibility is that the recent drop in prices led to a surge hedging with holders of underlying oil longs potentially buying up downside protection.
Whatever the reason, it's too early to tell how this might affect prices. Usually, this type of move would suggest a push lower in prices, but WTI has remained very calm, for now at least. In the meantime, with the warnings of a potential messy month-end and quarter-end rebalancing for equities and fixed income, we do want to tread carefully here.
