Oil Gets Back Above The $45 Level As Crude Inventories DeclineOil made an attempt to settle below $44.00 but failed to gain sufficient downside momentum and returned back to the $45 level. The current technical picture looks rather bullish for oil, but it needs to get above the resistance at $45.80 to confirm that it is ready to gain more upside momentum.
In this case, it will head towards the next resistance level at the recent highs at $46.25.
On the support side, oil has mostly ignored support levels at $44.75 and $44.45 but the support at $43.75 should be strong enough in case oil gains some downside momentum. A move below $43.75 will push oil towards the next support at $43.00.
Wticrudeoil

Oil Moves Below $45 While Traders Wait For OPEC+ DecisionOil managed to settle below the $45 level and is currently testing the support at $44.40. If oil settles below this level, it will head towards the next support which is located at the previous resistance at August highs at $43.75. A move below this level will push oil towards the next support at $43.00.
On the upside, the previous support at $44.75 will likely serve as the first resistance level for oil. A move above this level will push oil above the $45 level. The next resistance is located at $45.80. If oil gets above this level, it will head towards recent highs at $46.20.

Oil Stays Near The $45 Level Ahead Of OPEC+ DecisionOil made an attempt to settle below the $45 level but received strong support at $44.45. The nearest support level for oil is still located at $44.75. If oil declines below this level, it will head towards the recent lows at $44.45.
A successful test of this level will open the way to the test of the next support level at $43.75.
On the upside, the nearest resistance level for oil is located at $45.80. A move above this level will push oil towards the next resistance at the recent highs at $46.25. If oil manages to settle above this level, it will head towards the $47 level.

M15 Comparative Analysis : US Oil ↔ UK Oil (with 4 indicators)Here, a comparative analysis of US Oil (West Texas Intermediate)
and UK Oil (Brent) on a 15-minute chart (M15).
US Oil on the left and UK Oil on the right.
The four indicators are the main indicators used at ADX-BRIEFING.
- Top indicator (directly below price window): modified MACD
- 2nd indicator: modified ADX
- 3rd and 4th indicators: modified momentum indicators.
The modified MACD indicator (on both markets) has been in the BUY zone
since November 16, 2020 and is still in the BUY zone as of now.
The modified ADX indicator is in a downtrend and this means that right now,
we have a consolidation.
We are waiting for a turn-around on this indicator which would indicate
that we have a new significant move on the way.
As of now, this is a waiting period, when considering this higher 15-min time-frame.
Indicator #3 on both markets, is still in the BUY zone
and now is a risky time for a long-term short trade.
Indicator #4 is in the neutral zone between the BUY zone and the SELL zone.
Conclusion:
On the 15-minute time-frame, there is no clear signal for either a BUY trade or a SELL trade.
I will add, in the comments section, more detailed analysis, related to the time-frame we are actually using for trades.
François Normandeau
Institutional Research Director
ADX-BRIEFING
This post can also be found on:
www.adx-briefing.com

WTI- Can it reach 50?After a few days of consolidation between 39 and 42, Oil broke above resistance and also above the recent 43 high and looks determined to continue higher.
The chart looks very constructive and with this new "vaccine" and wave of optimism crude oil could find strong bids that can drive the price to 50 old support now resistance.
As long as the price is above 43 on a daily close basis I'm bullish


WTI outlookAlthough the price of Oil remains elevated, it doesn't convince me...
Rises are very well capped around 42.50-43 zone and I expect the price to tumble sooner or later.
A daily close under 41 would be the signal for bears and, considering the economic outlook, 35usd/Baril would not surprise me at all
WTI- Drop after confirmationAs I said last week, I'm bearish WTI and, as expected, Oild dropped under the trend line support.
Now the price came and test the last support and confirmed it like new resistance and I expect a drop in the near future.
My target for short is 37 with 39 as interim support.
A daily close above 43 would negate this scenario

Oil- Time to SELL againOil has risen early this week but we see major resistance being checked and possible drop in the next few hours.
We are going short again, now.

WTI- I maintain my 37 targetWTI had a short-lived spike above resistance and this rise proved to be a false break.
Now Oil is trading just in rising trendline support and a break here should accelerate losses towards at least 37.

OIL- We called the drop nicely TP levels on chartSo we called the drop nicely, now let's take a look at our targeted take-profit levels

USOIL IDEA IMPORTANT LEVELS TO TRADE 4H CHART - WTIOIL CRUDE OILUSOIL IMPORTANT LEVELS TO TRADE 4H CHART - WTIOIL CRUDE OIL
These levles and trend line will help you to keep SL and to book profit ..Safe and Happy trading..!!!

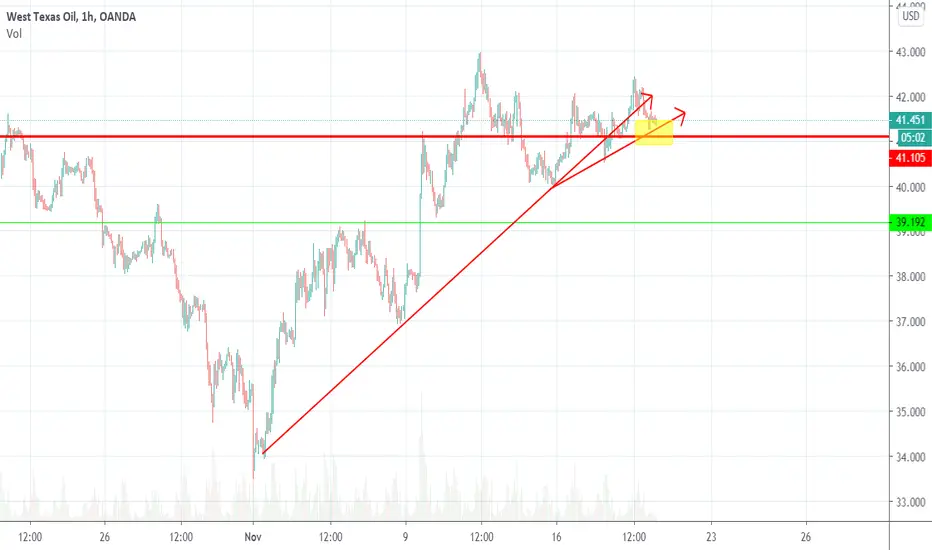
zptaflooking for something like this by EOY guys. I think we r in for a dip back to .17c B4 another leg higher tho.

OIL made 2 month highs! What is the ceiling for the market?WTI Oil broke above the 2 month Resistance zone of 41.50 - 41.90 and is fast approaching the 43.80 High of August 26 (chart on the left). Needless to say, it broke above the bearish channel and reached the 43.00 Target as I discussed two days ago on the idea below:
How far can this go for the short-term? As the left chart shows (4H time-frame), the MACD hasn't yet rolled over (as it did on September 20), so the uptrend can extend a little further on the short-term before buyers book profits and cause a minor pull-back.
On the long-term though we have to look at the 1D time-frame (right chart), which shows an interesting development. The sequence since the November 02 low, is similar to the one following the late April bottom. The MACD pattenrs are identical. I don't need to remind you that it was the rescue package along with OPEC's production cuts that supported this insane recovery rally back then. This week we had the very encouraging vaccine news.
Can Oil start a similar rally based on such positive news? Is $47 again a realistic number? Feel free to share your work and let me know in the comments section!
Please like, subscribe and share your ideas and charts with the community!
--------------------------------------------------------------------------------------------------------
!! Donations via TradingView coins also help me a great deal at posting more free trading content and signals here !!
🎉 👍 Shout-out to TradingShot's 💰 top TradingView Coin donor 💰 this week ==> seba26-77
--------------------------------------------------------------------------------------------------------

WTI- Looking to sellFrom 34 recent low Oil has risen 20% to 41 resistance zone.
Now the price is just under this important resistance and I expect Oil to remain in this 35-41 range in the medium term
That being said I will look to sell rallies above 41 with a target on the lower part of the range

WTIOIL USOIL CRUDE INTRADAY 39.30 Expected - 30MIN CHARTWTIOIL USOIL CRUDE INTRADAY 39.30 Expected - 30MIN CHART

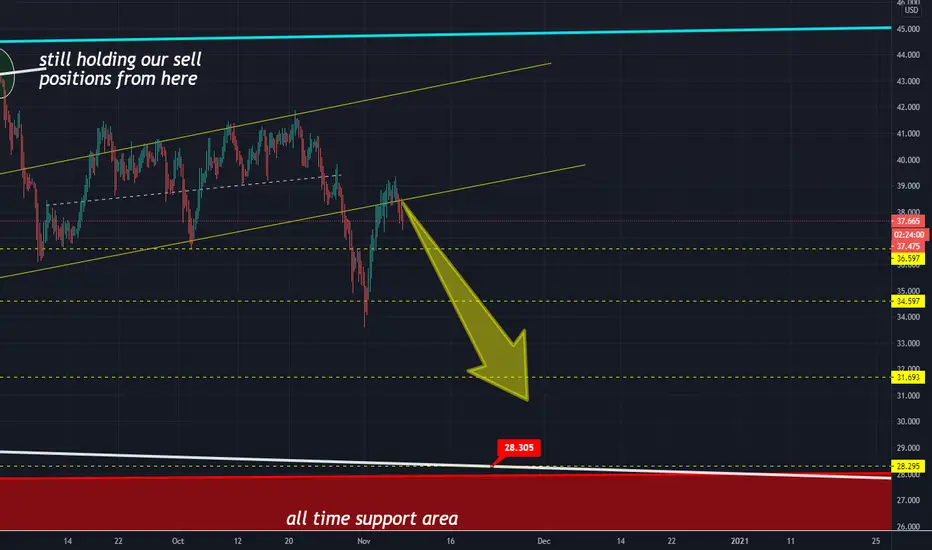
OIL Updated - We keep on SellingFurther to yesterday's idea, price has dropped at resistance and dropping :
Already in profits and managing our positions accordingly. Closing our 3 Buy positions and also closing 3 of our sell positions.
4 sell positions in profits and remaining open. 1 is cashed out so profit guaranteed, 3 open with take profit levels at 36.60, 34,60 and 31,70.
VICTORY
yesterday:
Our technical analysis on Oil with the major key price levels.
Fundamentally and technically we see a drop , sooner or later, below 30 usd
At this stage there is a 60% drop , or a 40% rise to 42.50 resistance and a possible drop from there at 90% (10% only to break that level)
HOW WE TRADE THIS:
We have SELL and BUY positions at a rate of 7 (buy) to 3 (sell) (70%-30%)
If the price drops then we have a profit from 40% of the positions
If the price rises we will close all BUY positions at the major resistance of 42.5usd and hold our SELL positions for a drop back to where the price is now and the key take profit levels of 36.60, 34.60 , 31.70 and even the all time support of 30$ and 28.50$.
If all goes well we will consider Buying again at that level.
Take a look at how we perfectly sold in September s idea predicting perfectly the beginning of the drop ,
our tutorial on Oil analysis

US OIL BUY ON DIPOil has recently hit its new low. It has been following its support trend line the last 2 times. The resurgence of new highs of Covid cases has brought it down. Though this same news has happened in the past, we can infer that this time will not be as worse as the last couple of months in terms of the effect on the commodity.
Expect it to consolidate a bit longer, then buy on the breakout.
If you allot more risk, then an anticipatory trade is also an option.
TP 1: 39.9
TP 2: 40.9
SL: 36.5
Good luck, I'd love to hear your thoughts on this.

Us crude Oil ( WTIUSD) ANALYSIS 27 OCT 2020Hi Assalam-o-Alaikum , Dear GooD Afternoon Hope you are well and enjoing your trading , i'm here with my new analysis of WTIUSD
US Crude Oil (WTIUSD ) Current price is 3921.7
Current Resistence level is 3927.4
Current Support level is 3843.3
If Market Breaksout the Resistence level and Close on above this level we can enter in Buy Trade as Case 1 in Chart , Alternatively if Market Breaksout the Support level we can enter in sell here as case 2 in Chart
I hope my analysis will help you in your trading best of luck
share your point of view about WTIUSD in comments , Thanks

WTI- Sell rallies above 40From the beginning of September, WTI is trading in a range between 36 support and 41.50 resistance.
At this point, Oil is trading on the upper side of the range and we have a nice opportunity to enter short for a 400 pips profit target.
In my opinion prices above 40 should be sold and only a daily close above 42 would change my bearish opinion

OIL Trading PlanPattern: Channel Up on 4H (inner/ blue and outer/ black lines).
Signal: (A) Buy as long as the 4H MA200 is holding, (B) Sell if the 4H MA200 breaks.
Target: (A) 42.00 (just under the Higher High trend-lines of both Channels), (B) 37.50 (just above the Higher Low trend-line of the inner (blue) Channel Up).
Most recent Oil trade:
** Please support this idea with your likes and comments, it is the best way to keep it relevant and support me. **
--------------------------------------------------------------------------------------------------------
!! Donations via TradingView coins also help me a great deal at posting more free trading content and signals here !!
🎉 👍 Shout-out to TradingShot's 💰 top TradingView Coin donor 💰 this week ==> TradingView
--------------------------------------------------------------------------------------------------------

Crude - Monthly Fib speed resistance fan Crude is ready to technically take off. Next week OPEC news and reports.
