US OIL: Weakness In Bullish MomentumHi Traders,
WTI is showing signs of slowing bullish momentum and will likely make a case for downside in the coming sessions. We are currently looking at a 5 wave ending diagonal, and this structure is a reversal pattern. Don't miss this move and look for short entries only when price confirms.
Regards
Wave Theorist
Wticrudeoil

USOIL 40.10 +0.79 IDEA Good Day Everyone
Here's an idea on USOIL that has been trading in an uptrend inside an ascending channel and saw a good day yesterday seems it could still climb higher to test resistance level 42.50 as the S&P500 future pointed higher after positive chinese manufacturing PMI data, but also looking at a scenario of bears coming into play and pushing oil down as we wait for the canadian GDP data and fundamentals on oil today.
will look for significant moves to the downside unless the channel holds....
_________________________________________________________________________________________________________________________
If you like the idea kindly leave a like and a follow will definitely follow back and leave your idea & Comment on the pair in the comment section. APPRECIATE IT

US Oil short to 35 maybe lowerHere we can see an awful two bar reversal pattern on the daily with strong divergence on the MACDH. It seems that no sooner did oil fill the long term gap to 41.5 that it immediately sold off. I've been day trading it short since 41, here we can see the full horrible daily picture now.
Looks like a lot more bearishness to come, even more so perhaps once the 4 and 1 hr moving averages have turned properly negative.

WTI Crude Oil: Bullish on the short-term.WTI is trading within a Channel Up on the 4H chart (RSI = 56.026, MACD = 0.100, ADX = 22.319) having successfully crossed the 4H MA50. This has been typically a bullish extension sign since May 28th. We are bullish aiming at 41.50 - 42.00.
** If you like our free content follow our profile to get more daily ideas. **
Comments and likes are greatly appreciated.

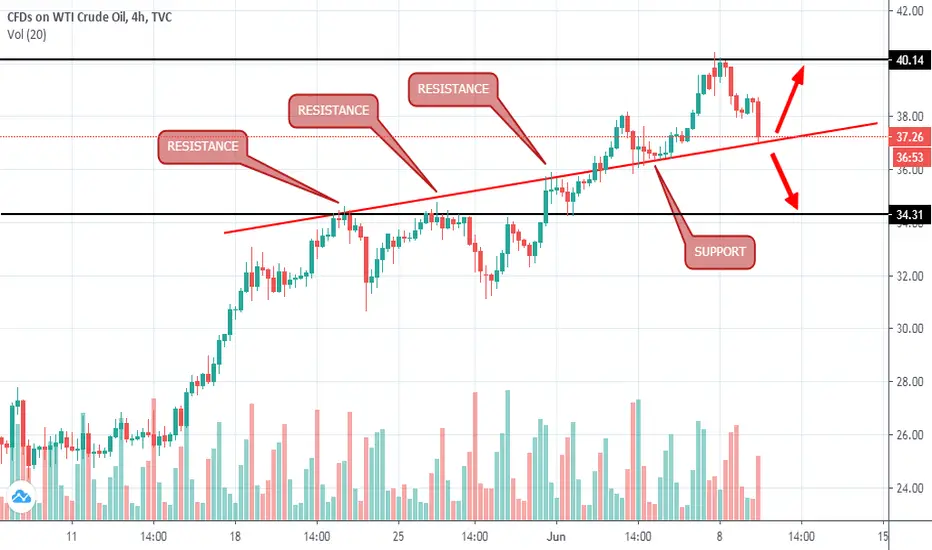
What I'm seeing on USOIL!If my long term trend line holds as support then we should see the US OIL rally. If it however breaks, then south we all go. Which i'll prefer cos of a favorable Risk to Reward Ratio. For the mean time, price moves and we follow suite.

A ROLLERCOASTER WEEK FOR THE CRUDE OIL MARKETOil prices started this week controlled by the bulls in a positive note, being able to test 41.61$ per barrel recording a fresh high for the month, only to finally drop after the risk sentiment saw a late knockdown in Asia and increase in new cases in the United States of America, as market hefts in an incoming fresh virus update.
However, the WTI benchmark was able to "U" turns yesterday from 37.17$ low and claim back almost 6% of lost ground in the pullback. From a broader look, the market will continue to trade sideways, containing prices by technicalities. From the fundamental point of view, there is no sign of bullishness but the opposite. This week an increase in the inventories reported by EIA, newly infected citizens reported in different states in North America, the second wave in Asia and critical situation in Latin America, will continue to shadow the crude oil demand.
Technical reading in the intraday charts at the H4 realm, price held its grounds right above the golden Fibonacci level 6.18, saved by the critical support zone follow by the confluence of a demand zone and descending trendline, as the last line of defense to avoiding the re-test of the 34$ handle. MACD is still showing some uptrend preference and is about to form a golden cross for bullish confirmation with RSI hovering in nobody's land.
Oil prices edged higher in a volatile session on Thursday, finding some support after declining earlier, attaining support from signs of a minimal improvement in the US economy, but rising cases of COVID-19 in some states capped these gains. The same day the US Department of Commerce said in its advance estimate exports of industrial supplies, which include crude oil and petroleum products, dropped by 11.8 percent month on month in May to US$29.9 billion.
Now in the far east, according to Reuter, China is set to import 0.8-1.3 Mb/d less in August and September than it did in May. Higher oil prices, higher inventories, and worries about the second wave of coronavirus infections discourage purchases from Chinese refiners.
Indisputably, the Coronavirus will continue to damper the world economy, where central banks have unleashed trillions of dollars in stimulus while investors are still waiting for any confirmation from OPEC+ and further plan to cut production beyond July. With a grey horizon for the black commodity, see you all next week.
--
*** If you like the idea, don't be shy, click on like and comment. If you do not agree, just comment ;-) | Thanks for your support!!! ***

WTIStill seeing this massive IH&S forming and crude oil. I am watching WLL & OAS and few others bottoming today and looking ready for another push higher.
But part of me thinks the next push will be a LH on HTFs B4 crude slams down to $20.
Weekly RSI on many stocks r in overbought territory and that will probably be the final shake out.
Hourly RSI up to daily r way oversold, meaning there is a nice bounce coming B4 the weekly RSI resets all indicators.


WTI H4 SHORT PRICE ACTION FORECAST WTI under sellers pressure, breaking trendline and retesting it after consolidation, together with MACD showing diminished bullish momentum, for a bearish bias confirmation.
The order:
Type: sell-limit
S/L: 84 pips - R:R | 1:2 -
T/P: aiming at the key support level by Fib
--
*** If you like the idea, don't be shy, click on like and comment. If you do not agree, just comment ;-) | Thanks for your support!!! ***

Divergence extension part 1. R:R2 15% profitHello everyone,
In updates and comments below this chart I would like to focus on the Divergences extensions
Tip: With longer extension on divergence comes bigger and faster reversal (Work both ways)
I personally would add more on leveraged shorts during breakdown of blue line (uptrend)
as I see Oil finishing W5, filling gap, forming bearish divergence and possibly breaking the uptrend
The minimum price to correct should be the yellow line range (Where the first point of bearish divergence formed)
ChaChain
-------------
Disclaimer:
I´m not registered or licensed in any jurisdiction whatsoever to provide investing advice or anything of an advisory or consultancy nature, and therefore I´m unqualified to give investment recommendations. Always do your own research and consult with a licensed investment professional before investing. This communication is never to be used as the basis of making investment decisions, and it is for entertainment purposes only.

OIL Bearish Short SellIf price breaks the blue trend line we wait for it to close below 39.00, then we take a sell with 37.48 as first TP and 34.59 final TP.

OIL WEEKLY FORECAST 22/6/2020IN OIL WE ARE EXPECTING BEARISH MOMENTUM IN THIS WEEK NOW 40.5/41$ LEVEL IS IMPORTANT FOR DOWN SIDE TARGET 37/34$.
THANKS

WTI best analysisWatch carefully because is the key.
A lot of mysterious symbols on chart.
So... buy/ sell as you wish this suggestion give you a full of prosperity dish.

Bullish Trend on USOILRecently, we have been observing a lot of fundamental events related to oil, such as the urgent meeting of OPEC /+ and the news of a cut of 9.7 million barrels per day. I will not expound the entire chronicle of events since it is very easy to find it on the Internet. In my opinion, oil this year should reach a level of $ 65 per barrel.
The Russians and the Saudis played a great game in a time of chaos, now the time has come to restore balance.
The only negative factor is that due to the epidemic, borders are closed and oil demand is reduced. But in anyways oil should not be sold at the same cost as its own.
Our group transmits information without forcing anyone to trade, any transactions that you open are at your own risk.
Stay Home and Stay Safe!

US Oil :Correction likely to complete around 32.50 - 31.25 April 2020 low to the short term high around the 40 handle , Us oil likely to complete its correction around the 50 day exponential moving average around 32.50 or slightly below it . As of now , its testing the 100 day exponential moving average around 35.50 and price likely to consolidate until Thursday as the investors waiting for output from the JMMC/OPEC meetings . World stock indices and crude oil gave up the invincible gain since the crash as investors saw the domination of risk aversion/Powell comments on the last FED meeting.
Major levels to consider are :
35.50 - EMA 100 , breaking this level will let the price to drop further towards the 50 day EMA around 32.50 on the other side if this 35.50 short term supports holds then we can expect another leg up towards the 200 day EMA around 42.50

Urgent! WTI has successfully tested the broken support on D1As we've seen in our previous post, we succeeded to expect what will happen and we successfully had reached our target of 37$.
Please note that our game now is on the daily chart as the price could successfully break the 37$ level which was a very important historical support, and then retested it on the H4 chart by making a bullish channel to touch the point and then to fall down, then it made a double-top formation on the h1 chart and RSI warning us that it's time to short.
But on the D1 chart, why did it break the support then retested it? where it's going to?
If you have a good eye, you'd see a double-bottom formation with a broken neckline on the 28$ level, but we haven't tested this line yet, so we need a confirmation between the area of 28$ - 32$. Yeah, a wide area, but it's because we have some strong resistances on 32.5$ (Fibo 23% of the bullish wave that started from 6.5$ + a historical resistance), 31$ (historical resistance, then 28$ (the neckline resistance). So, those should be our main targets in the long-term.
When to sell on the H4 chart?
As I've just said, it broke the 37$ level then went down to 34.4$, and from that point, it started to make a bullish channel and went to test our broken support. So, we need a H4 candle to close below the down-trend of the bullish channel, and we are about to have this right now, although it may go up a bit to close the gap that was made when the market opened today.
And here we go, we are about to start shorting with so nice opportunity to have nice profits. Our target as I've said are 32.5$ (main target), 31$ (normal target), and 28$ (main target). We should put our stop loss above the right shoulder on 39.1$ and wait for H4 candle to close above it to make sure that it's time to close the 41$ gap.
Don't forget to tell me your opinion and how you see OIL in comments! I'm waiting for you ideas
Chiao!

MARKET BULLS SAVED BY TECHNICAL CONFLUENCEThe recovery in the oil market has been driven mostly by fundamental forces. Bulls took the stairs directly to the 40th floor, then a lack of support, changes in the market sentiments, inventories building up, and the potential threat by a second wave hitting the leading economies have finally paid off.
The OPEC+ meeting has done little for the oil prices; the extension of the production cuts by another month won't help much when the real problem is based on demand. Lockdowns, quarantines, and lack of a vaccine would drive the sentiment on the market for the time being.
Now in the realm of the charts, the price was able to register a fresh high last Monday at 40$ handle. However, today Friday is recording a sell-off of about 11%. Price action was able to find support in a confluence area, holding prices by an ascending trendline, the exponential moving average (EMA) in confluence with Fibonacci level 61.8, and the 34.5$ handle. This mentioned area was able to contain the market. However, technical indicators as MACD has crossed to inform the bearish bias with a sell signal along with the RSI dropping sharply from the overbought zone where it has been since last Friday. In case the price action breakthrough the current area, the market could quickly drop to below 30$ handle.
With the renewed concern about the market revisiting prices from last March, bears are lining up in high hopes, while bulls' only option is to rely on the technicality of the market seeking a clear break above 40$ to dive in. Enjoy your Friday and weekend ahead. See you all next week.

US OIL : Break above 39.30 required for Bullish ContinuationOIL has started the downward correction and reached around 34.60 which is the Fibo Extn. 1.61
Usually, if the price extends above 100% on Fibo, it's a sign of trend formation; one can expect the pullback and continuation of the move in the same direction.
Therefore, I remain bearish for OIL until it closes above the falling trendline and breaks resistance at 39.30
GOOD LUCK FOR YOUR TRADES !!! PLEASE SHOW YOUR SUPPORT IF YOU LIKED THE IDEA

What I'm seeing on USOIL!Price is currently on my long term Trendline. if it does holds as a support, then im looking forward to going long. if it breaks, then south we go
WTI Crude US Oil- Long Opportunity On The Bounce Of The 50 EMA!- A very decent buy opportunity on the bounce of the 50 EMA.
-Price is was acting as support of the EMA which indicates that there is still strong bullish momentum.
-The 23.6% fib level also adds another confluence that price will have a strong move to the upside.
-Another confluence is the supply turned demand zone which price has retraced from.
This is a very good opportunity to enter a long position and set a good risk to reward ratio for this trade.
Let's see what happens this week and make sure to comment your ideas and opinions on oil!


WLLUpdate on my #WLL long, my buy triggered at .74c I am looking for something similar to #OAS the top of this range to be tested B4 a pull back then a break into a new higher range

