Wtilong


USOIL POSSIBLE SHORTS - WAIT FOR CANDLESTICK FORMATIONUSOIL POSSIBLE SHORTS - WAIT FOR CANDLESTICK FORMATION


WTIOIL - all the way upstairsTo find reversal points of a market is not easy but still possible, as we have found out using the example of WTI oil.
Analysis "WTI ÖL - Again 61,8% - Only short-term long entry?" from the 07th of June 2019
or
Analysis "WTI oil - Is the trend change for halving?" from April 12, 2019
or
Analysis "WTI - till$ 45, no major trend reversal." from 13th Nov. 2018
Every market has its peculiarities and with time you may be lucky enough to find a pattern. This works as long as some ghostly good, until the diva "StockMarket" flips, new patterns emerge and you can start all over again.
So I have no access to the Pentagon or the CIA and do not know in advance of which tankers in the Persian Gulf accidentally (after the US fleet was back) could be attacked :-).
However, the indicators are already overheating so that the profits must definitely be hedged. It should be considered that at first some profits should be taken. If oil come bake, we are looking for the new entry, but not necessarily come, as you can see in the Dax.
Analysis "Waiting for the bullrun": from May 30, 2019


WTICOUSD before 16% increase... The exchange rate can now build the structure of the second fractal wave. In this fractal structure I look forward to building a wave structure. Later, I expect an upward outbreak. The target of the current motion is 69 usd.


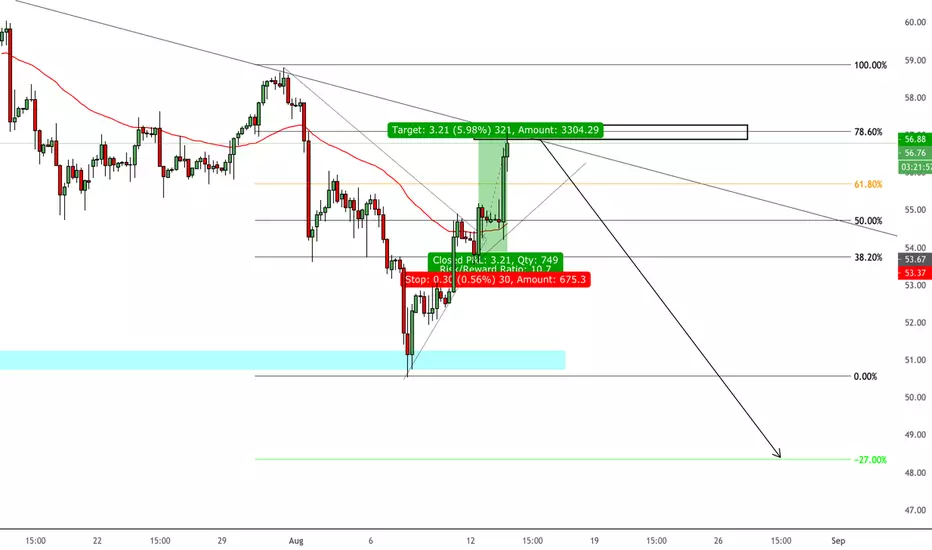
WTI approaching support, potential bounce!WTI is approaching our first support at 51.29 (horizontal swing low support, 100% Fibonacci extension , 78.6% Fibonacci retracement ) where a strong bounce might occur above this level pushing price up to our major resistance at 54.02 (horizontal swing high resistance, 61.8% Fibonacci retracement ).
Stochastic (21,5,3) is also approaching support where we might see a bounce in price.

WTI appraoching support, potential bounce! WTI is approaching our first support at 51.29 (horizontal swing low support, 100% Fibonacci extension, 78.6% Fibonacci retracement) where a strong bounce might occur above this level pushing price up to our major resistance at 54.02 (horizontal swing high resistance, 61.8% Fibonacci retracement).
Stochastic (21,5,3) is also approaching support where we might see a bounce in price.


WTI Crude Oil I H&S patternHere is a trade on crude oil. Very simple, an inverted H&S pattern with a bullish divergence on the RSI and Stoch.
Will wait for the right shoulder to fully form.
Have a buy order set in at $50.4 with another buy order set in at $49.8. Once the neckline is broken (54.6) I will then buy even more.
TP targets:
1 - 58.10
2 - 63.8
3 - 65.7
Stop loss at: 49.5


4 - January Trades - Crude Oil (WTI) - Bullish Impulse - Minor 3USOIL (WTI) could start a bullish sequence in an impulsive manner.

WTI trade to $51, 3Day RT Bottom, Inverse HnS 1D QRsiWTI paints some impressive bullish signals on Heffae Clouds + QuantRsi longer timeframes. The idea of this trade is driven purely by technicals, I am not in the loop on fundamentals whatsoever.
Daily chart shows inverse HnS on the QuantRsi as well as a new trend developing that shows upside potential:
As warning, The last time Qrsi ran -7 on the 3Day QRsi, there was a small bounce, but there was significant continuation to the downside.
Compared to our current levels, the potential for a further slide is possible:
Regardless of this, I think a long trade has decent risk / reward as long as best practices are used when setting stops and take-profit.

buy around 42.30 and tp around 45.xx with trailing stopi expect a pullback on Usoil who face a weekly resistance after falled too much this last weeks/month so before end of years or new years is a legit rebound as people who have be in short will taker them profit
pUt a stop loss at you entry point when Usoil go around 42.8-43.00 put the stop at 42.40 for secure yourself and at least secure few pis in gains we never know market like to exagerate

WTI Short Term Up - long way to go to get higher pricesCrude Oil has taken a beating all the way from $75 - a mix of geopolitical issues and plain old too much supply and lower demand for the commodity. Short term we are seeing some relief for the producers while the users hope for continued lower prices :).

WTI Oil waiting for reportHi,
In 23 minutes, we will have report about Oil stock. Chart is telling us that price should rise. Level 70.50 become strong support.
We have two brown swing look like we should have third rising swing in order to create matrix.
I am ready to trade. Are you?
Good Luck,
Jim

WTI LONGS. 12.10.18WTIUSD
WTI Holding previous structure highs. Trend line hold bounce. Looking for longs up to 80.

WTI CRUDE OILHi,
Price just completed another matrix. Now we are looking on market vibration getting weaker and we should expect to end triangle. Momentum remain very strong in upside.
Look like we should experience price rising higher.
Tomorrow pay attention to the price going higher over 0.66 retracement level, this will be indication that uptrend will continue.
Let’s wait and see.
Cheers
Jim

WTI Oil Hi
I have become interesting with WTI Oil chart.
Similar situation you can observe on Bitcoin chart but on the opposite site of the chart.
According to GWT (shown analysis are based on it) price must make three swing: first primary swing, secondary swing and second primary swing. But what we see on the chart are formations of only two swing.
They become smaller and smaller. Trough of each swing is higher from the previous one and peaks are lower from the previous. We should expect huge price explosion on the end of this strange cycle.
The next SR level 69.32 is at 50% of the long candle. Momentum is sliding to the down side with reasonable strength.
Momentum Support line (on RSI) should give hard time to changing direction momentum. Price remains inside brown channel. last peak almost reaches upper line of rising brown channel.
Let’s monitor this market, it will be interesting to see what this unique swing configuration will bring at the end.
please write any comments if you have one.
cheers,
Jim
