WTI OIL heavily bearish eyeing a level untouched since Dec 2021!WTI CRUDE OIL (USOIL) eventually followed the rough projection we made three weeks ago and made a Lower Low as it failed to break above the 1D MA50 (blue trend-line) again:
This has created a new Channel Down on the medium-term, which after closing below the 1D MA200 (orange trend-line), it is now eyeing the 1D MA300 (red trend-line) for the first time since December 02 2021! As we outlined in our previous analysis though, the downtrend is unlikely to stop there and most likely will hit the November 2020 Higher Lows trend-line around 82.00 - 83.00 before giving a relief (at least) rally.
--------------------------------------------------------------------------------------------------------
Please like, subscribe and share your ideas and charts with the community!
--------------------------------------------------------------------------------------------------------
Wtioil


WTI Cude (OIL) POSSIBLE TO BUY ......
AronnoFX will not accept any liability for loss or damage as a result of
reliance on the information contained within this channel including
data, quotes, charts and buy/sell signals.
If you like this idea, do not forget to support with a like and follow.
Traders, if you like this idea or have your own opinion about it,
write in the comments. I will be glad.

WTI Oil Trend Analysis for todayWTI oil is following its upward trend from past weekend. Now looking in a Buy mode from here.

OIL showing that inflation has peaked.Another inflation (red trend-line) cross study, this time against the WTI Oil (USOIL). It is evident that the correlation between the two is very tight and every time the Oil market started forming a top pattern (circles), the Inflation Rate followed it lower shortly.
I will not get into much detail as the chart is pretty self-explanatory. Oil has been on Lower Highs and Lower Lows since the March "war" peak, which is a bearish formation and if it wasn't for that "war" peak, the pattern would have been a Head and Shoulders, which is also a peak formation. With the 1M RSI back below the 70.00 overbought level after breaking above it for the first time since April 2011 and the only the 5th since 2000, it is more likely to have a market top on Oil. As a result, if a correction starts then Inflation which is still on Higher Highs lagging behind, is more likely to peak as well and finally correct back to sustainable levels in the coming months.
--------------------------------------------------------------------------------------------------------
** Please support this idea with your likes and comments, it is the best way to keep it relevant and support me. **
--------------------------------------------------------------------------------------------------------

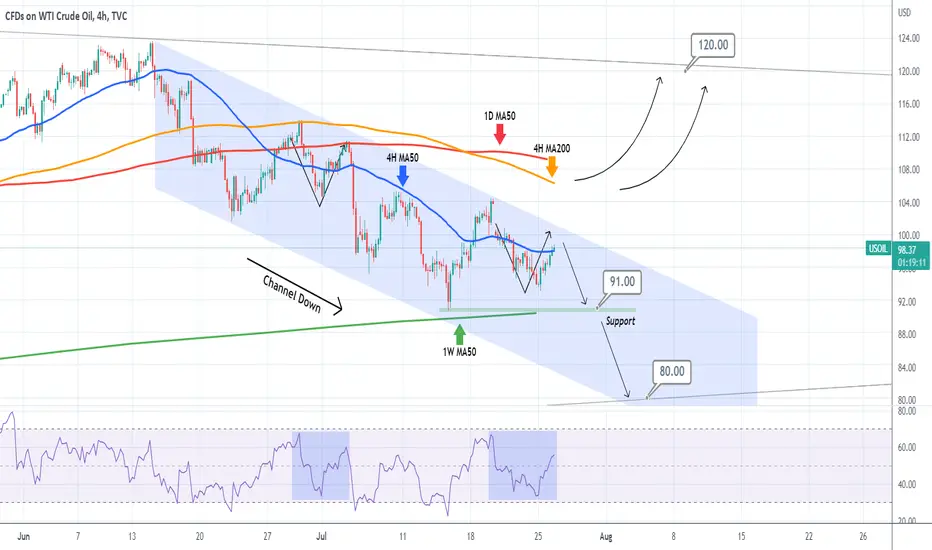
WTI OIL testing the top of its 1 month Channel Down.WTI Oil (USOIL) broke today above the 4H MA50 (blue trend-line) again after a three day stay below it and is approaching the Lower Highs (top) trend-line of the Channel Down it started after the June 14 High. On 4H RSI terms as well, it looks like the V-shaped Lower Highs test of June 29 - July 05 that ultimately led to a sharp sell-off towards the bottom of the Channel. As a result our strategy is to take this favorable R/R sell trade as long as the top of the Channel holds and target the Support (also the 1W MA50 (green trend-line)) at 91.00 and if we get a 1D candle closing below it, then target the multi-year Higher Lows trend-line (dotted line) at 80.00.
This pattern is invalidated if the price breaks above the Channel Down and a buy signal will be waiting above the 4H MA200 (orange trend-line), targeting the March 2022 (war) Lower Highs trend-line at 120.00.
--------------------------------------------------------------------------------------------------------
** Please support this idea with your likes and comments, it is the best way to keep it relevant and support me. **
--------------------------------------------------------------------------------------------------------
WTI oil - Oil continues to drift lowerOver the past four months, we repeated that oil prices were peaking and the downside was looming over the oil market. Despite the excess of bullish calls forecasting new ATH for oil prices, we stuck to our bearish bias. Indeed, a few months ago, we set price targets of 100 USD, 95 USD, and 90 USD for USOIL. After hitting the first two price targets, we still remain bearish and maintain a price target of 90 USD for WTI oil. Our views are based upon technical and fundamental factors.
Illustration 1.01
The picture above shows the daily chart of USOIL. Two moving averages, 20-day SMA and 50-day SMA, reflect the downtrend.
Technical analysis - daily time frame
RSI, MACD, Stochastic, DM+, and DM- are all bearish. Overall, the daily time frame is bearish.
Illustration 1.02
The weekly chart of USOIL shows 20-week SMA and 50-week SMA. The 20-week SMA appears to be reversing to the downside, which is bearish.
Technical analysis - weekly time frame
RSI, MACD, Stochastic, DM+, and DM- are all bearish. Overall, the weekly time frame is bearish.
Please feel free to express your ideas and thoughts in the comment section.
DISCLAIMER: This analysis is not intended to encourage any buying or selling of any particular securities. Furthermore, it should not be a basis for taking any trade action by an individual investor. Therefore, your own due diligence is highly advised before entering a trade.

WTI Cude (OIL) POSSIBLE TO BUY ......
Hello Traders, here is the full analysis for this pair,
let me know in the comment section below if you have any questions,
the entry will be taken only if all rules of the strategies will be
satisfied. I suggest you keep this pair on your watch list and see if
the rules of your strategy are satisfied.
Dear Traders,
If you like this idea, do not forget to support with a like and follow.
PLZ! LIKE COMMAND AND SUBSCRIBE.

Is #USO Breaking Out?Is #USO Breaking Out?
# Crude #oil extended last weeks Friday’s positive close in trading on Monday as U.S. President Joe Biden’s visit to Saudi Arabia failed to deliver anything concrete. The trip was aimed at coaxing the Saudi’s to increase oil production thus easing inflation pressures. The response from the Saudi’s and other key officials reiterated the fact that production scheduling and/or increases remain with the OPEC+ consortium leaving President Biden without a deal.
Sorry #JoeBiden

India tricks the West, Strong dollar & China imports russian oilOil top might be in for this year.
Reasons:
1. Market adjustment mechanisms are underway on the commodity markets, ensuring that Russian oil, which is spurned by the West, once again finds its buyers (india, china). This in turn causes these countries to demand less Brent or WTI oil, which again depresses prices. India and China are buying significantly more crude oil from Russia, Europe less, which means there is a balancing out taking place on the world markets with the new tanker routes and transportation routes.
2. India recently bought more oil from Russia than ever before, according to a recent report by the Finnish Energy and Clean Air Research Center. "A significant portion of the crude is re-exported as refined oil products, including to the U.S. and Europe, an important loophole to close," the Finnish analysts warned. Since new sanctions measures are very unlikely, the alignment process between Russian oil and Brent and WTI crudes is likely to continue.
3. Dollar price, interest hikes & recession fears by FED. The strong dollar is also acting as an additional burden on the oil market. This is because commodities such as oil are traded in dollars. If you read between the lines of the FED, they're doing their best to crush commodity and oil prices to crush long-speculators on comm and oil.
4. Fear of new lockdowns in China. Chinese head of state Xi Jinping nevertheless only recently announced that he would stick to the strict zero-covid strategy. This is fueling fears of new lockdowns in China = downside risk for oil demand in China, probably a small impact, since the gov in China is trying its best to avoid a greater corona outbreak in large cities to stabilise eco. situation.
5. bitcoin/tradional markets are sometimes seen as counterparts to oil. Bitcoin, despite very bad news (CPI increased) and being a risk asset, has not moved much further down in price, showing that risky assets have more or less found their bottom while oil bulls have an empty tank.
Opinion: I see the price cooling down slowly rather than continuing to climb, probably going towards 70-60$ in the next 6-10 months.
! This is not an investment advise! Do your own research! This is NOT a recommendation to buy or sell oil shares and this is NOT a recommendation to short or to long oil!

WTI OIL hit its 1D MA200 first time in 2022! Bottom can be lowerWTI Crude Oil (USOIL) touched today the 1D MA200 (orange trend-line) for the first time in 2022, more specifically since December 21 2021! This strong selling on the market has come after successive Lower Highs since June 14 and a rejection on the 1D MA50 (blue trend-line).
Since the March 08 market High, this may look as the start of a multi-year Bear Cycle but the fall isn't that dramatic yet, as excluding the June 14 High, the market has been ranging sideways (high volatility nonetheless) within a Rectangle pattern since the March drop. This is a make or break moment for the pattern. A break below the Support and naturally the 1D MA200, should seek the 1D MA300 (red trend-line) which priced the markets last Low on December 02 2021, before the mega rally started. A rebound on the Support should test the 1D MA50 on the short-term at least as a Resistance.
The most important indicator on this chart though is the RSI, which is displayed on the 1W time-frame. As you see, there is a Channel Down pattern involved, which (with the exception of the March war extreme) has price all of WTI's Highs and Lows since the March 08 2021 High! The best long-term buy on the market can be taken exactly on the Channel's Lower Lows (bottom) trend-line, whether that's on the 1D MA300 or one of the lower Higher Lows trend-lines involved.
--------------------------------------------------------------------------------------------------------
** Please support this idea with your likes and comments, it is the best way to keep it relevant and support me. **
--------------------------------------------------------------------------------------------------------

WTI still in a MAJOR bull trendSince the April 2020 low WTI has been steadily shooting towards the 2008 highs and remains in a very strong bullish trend.
When we have technical and fundamental analysis supporting a direction I would count that the best type of trades we could be in.
Of course I am a day trader and looking at this weekly chart does little good for me, but volatility on the other hand helps me make abnormal profits and what I seek to find is volatility and which assets could it affect.
Point here is that if WTI continues to hold this uptrend it will form a higher low and knowing that higher low I can positon myself to ride wider profits on long positions and even increase my size, while also when WTI eventually finds a top the correction down will be quick and aggressive, hence knowing both the technical and fundamental information of a given asset is vital to my success as a day trader!
The technical analysis here is clear... we are in an uptrend because we are forming higher highs and higher lows... basic! but!! There are fundamental drivers too!
The most recent move in oil futures curves reflects the divergent forces currently driving the global commodity markets. From the recent fundamental standpoint, the weak June Flash PMIs weighed especially on the longer-end of the oil curve, as rising recession risks and tightening financial conditions weaken the demand outlook. At the same time, the world continues to struggle with tight oil supply amid the war in Ukraine and very limited spare capacity and things are only getting worse!
OPEC can't seem to save WTI from heading higher either, because OPEC+ announced faster planned production hikes for July and August, yet it failed to meet its target in May as production declined from the previous month so it will be very very very interesting to see what happens with their promise for July (coming up pretty soon!)
Based on my experience... the OPEC+ supply for July could possibly form the higher low of this uptrend, but only time will tell!
In any case, trading WTI is very lucrative for me right now as I thrive on volatility and absolutely love it!

WTI CRUDE AGAIN Selling Opportunity Again Good Selling Area Around 105 will See Again Below 100 its Time Sell On Every Rise

WTI: Next step 👍WTI has made the next important step in the course of our primary scenario and has jumped below the support line at $101.53. We expect it to drop further still, namely below the next support at $92.93, where it should finish wave 3 in blue. After a short countermovement as part of wave 4 in blue, WTI should then fall into the white zone between $78.56 and $70.17. There is a 25% chance, though, that WTI could change direction and rise above the resistance at $130.50, thus enforcing further ascent.

WTI oil - The end of oil bull marketIn early April 2022, we said the oil bull market peaked. Then, a bit later, we stated that if the Russian crude oil was to be banned in the EU, we would see another bounce in price and possibly a new top. Despite that, we set a long-term price target for USOIL at 90 USD; we still hold this price target as we continue to be bearish on oil. In addition to that, we would like to set a short-term price target for USOIL at 100 USD and a medium-term price target at 95 USD.
Fundamental factors
The FED is decided to pursue the destruction of demand, which will negatively impact the oil price as the stock market is poised to crash further down. Additionally, supply increases by the OPEC members threaten the high value of oil.
Illustration 1.01
The WTI crude oil is down over 20% from its peak and within the technical bear market.
Technical analysis - daily time frame
RSI, Stochastic, MACD, DM+, and DM- are all bearish. The ADX increases, which signals that the bearish trend is gaining momentum. Overall, the daily time frame is bearish.
Technical analysis - weekly time frame
RSI, MACD, and Stochastic are all bearish. DM+ and DM- are due to perform a bearish crossover. The ADX suggests that the bull trend has ended. Overall, the weekly time frame is bearish.
Please feel free to express your ideas and thoughts in the comment section.
DISCLAIMER: This analysis is not intended to encourage any buying or selling of any particular securities. Furthermore, it should not be a basis for taking any trade action by an individual investor. Therefore, your own due diligence is highly advised before entering a trade.

WTI oil - 100 USD in sight Over the past two months, we expressed our belief that the oil bull market was peaking. Indeed, we previously set a short-term price target for USOIL at 100 USD, medium-term at 95 USD, and long-term at 90 USD. Despite wild price swings up and down, we stayed bearish, and we continue to maintain this stance also today. Therefore, we have no reason to change our price targets.
Illustration 1.01
The picture shows bearish breakouts below the trendline.
Technical analysis - daily time frame
RSI, Stochastic, and MACD are all bearish. The same applies to DM+ and DM-. Overall, the daily time frame is bearish.
Illustration 1.02
The illustration portrays the daily chart of USOIL. First, the price can be seen dropping below the 20-day SMA, which is bearish. Then, after a new low, the retracement toward 20-day SMA acted as a downtrend correction. Currently, we will watch out for a bearish crossover between 20-day SMA and 50-day SMA.
Technical analysis - weekly time frame
RSI and Stochastic turned bearish. MACD also turned bearish, but it still stays in the bullish territory. DM+ and DM- remain bullish. Overall, the weekly time frame is turning bearish from bullish.
Please feel free to express your ideas and thoughts in the comment section.
DISCLAIMER: This analysis is not intended to encourage any buying or selling of any particular securities. Furthermore, it should not be a basis for taking any trade action by an individual investor. Therefore, your own due diligence is highly advised before entering a trade.

Crude Oil Update Hi Trades,
Crude Oil is on the move today with the price plummeting almost 10% today at the time of this post. We have seen the bearish momentum take out support that has been created and it keeps pushing to the downside. Price is currently trading at around $101 a Barrel and I would like to see the price remain and close below $106 in order for me to be interested in Shorting opportunities on the commodity.
Looking at some technicals, we see that price has created a Double Top which ties in a lower high as well. The current daily candle, if it closes as is, will be a bearish engulfing candle and will give me more confidence in the setup. All that awaits now is for price to close and then start pulling back in a more corrective (Slow) manner in order for us to find shorts to the downside.
My style of trade is always Reactive and never Predictive.
Renaldo Philander

Remain Bullish?Remain bullish on oil with Friday's bullish candle bouncing from a short term bullish trendline. Entry buy stop 108.95 and target is previous swing high. R multiple is 2.6

WTICOUSD (RESISTANCE ZONE)Hey guys!
How are you guys doing! O hope from the previous analysis, the daily fake out from DAILY timeframe got you guys a confirmation and brought toward more downside.
What I'm seeing now is that it shall go back and test 110.70 zone and probably bring more downside to 105, 103 and possibly to 95 range.
However, shall it
break the resistance zone with a strong candle, it will be bring us to a greater height.
As oil is a very volatile commodity and can easily go up/down a few dollars so do trade with minimal risk and not overtrade!
let me know how you guys think!

WTI Crude Oil Short Setup.We need to break below 101 to confirm the short signal I posted on my WTI Crude Oil (see the related link).

WTI OIL targeting 123.00WTI Crude Oil (USOIL) is on a 4 day green 1D candle streak, the longest it has been in a month and is trading above above the 1D MA50 (blue trend-line). As you see the pattern has been a Channel Up since the March 25 High as the market is attempting to recover the War high (129.50) of March 08. This time the price hasn't just rebounded on the bottom of the Channel Up but also on the longer-term Higher Lows trend-line that started after the December 02 2021 Low.
A break below should target the 1D MA200 (orange trend-line) but until then we should continue buying towards the top of the Channel. A weekly closing above the 129.50 Resistance should be a long-term extension to the -0.236 Fibonacci extension at 145.00.
--------------------------------------------------------------------------------------------------------
Please like, subscribe and share your ideas and charts with the community!
--------------------------------------------------------------------------------------------------------

WTI Cude (OIL) SELL TRADE IDEA
Hello Traders, here is the full analysis for this pair,
let me know in the comment section below if you have any questions,
the entry will be taken only if all rules of the strategies will be
satisfied. I suggest you keep this pair on your watch list and see if
the rules of your strategy are satisfied.
Dear Traders,
If you like this idea, do not forget to support with a like and follow.
PLZ! LIKE COMMAND AND SUBSCRIBE.

Usoil time for ShortsBreakout of confluence zone(blue) of channel and support.
Look for short entries on retest.
Like and Subscribe.
