USOIL 20th JUNE 2022Before July, USOIL was seen moving in the consolidation channel area which tends to be bullish . in July, USOIL sentiment will tend to be bearish .
The Organization of the Petroleum Exporting Countries (OPEC) member states announced plans to adjust oil production upward in July by 0.648 million barrels per day.
In my view Oil prices are bearish but still not stable. Moderate bearish confirmation has not occurred, because the price has not yet breakout below the support area.
So I will place a buy limit near the support area, with the target not exceeding the weekly resistance which is drawn in the red area.
stop loss as well as sellstop below the support area.
Wtioil

WTI may retest reversal zoneCrude Oil WTI price went bearish this few days.
Hourly timeframe still with some bullish momentum towards the reversal zone and trendline.
Will see if the bear can came in or the bulls will win at these significant levels.
There might be a short opportunity in H1 timeframe.
TVC:USOIL

WTI OIL Correction not over yet.WTI Crude Oil (USOIL) is on a strong 3 day correction. Its long-term trend since the December 02 2021 Low is better illustrated if we apply the Fibonacci Channel starting on that Low. As you see the extensions have worked very well in projecting Higher Highs.
Right now the pull-back doesn't seem to be over. Either a bounce of the 1D RSI on its Buy Zone is needed or a hit on the price's Internal Higher Lows trend-line. The 1D MA100 (green trend-line) happens to be exactly there, which is a trend-line untouched since December 27 2021. A rebound there can target the 1.5 Fibonacci extension again. On the other hand, a closing below the 0.0 Fib level can see Oil test the -0.5 extension for the first time, with the 1D MA200 (orange trend-line) supporting just below.
--------------------------------------------------------------------------------------------------------
** Please support this idea with your likes and comments, it is the best way to keep it relevant and support me. **
--------------------------------------------------------------------------------------------------------

CRUDE OIL intraday trading & flying to the moom 🚀 13 JUN 2022CRUDE OIL intraday trading alert
3 steps must fulfill before entry
1. 1st breakout done
2. Retracement done
3. 2nd breakout and see you in the SKY 🚀
More info in my profile..
Good luck traders..

WTI: Nearly There!WTI has nearly finished wave B in green in the upper third of the green zone between $111.72 and $126.25 or wave c in pink in the upper half of the pink zone between $122.81 and $126.17, respectively. As soon as it has accomplished this, WTI should turn downwards and head for the support at $102.66. After it has completed wave (A) in white below this mark, a countermovement should set WTI back above $102.66 before it can resume the descent. However, there is a 42% chance that WTI could continue to rise and climb above the resistance at $130.50, which would then lead to further ascent.

WTI OIL heading to $160 long-termThis is not a new chart I'm sharing with you on WTI Crude Oil today, I've initially posted it 2 months ago, calling for a medium-term consolidation and then bullish break-out when the Resistance breaks, based on the striking similarities with the September 2020 - March 2021 pattern:
It is time to update my thesis, as the Resistance broke and the similarities continue to be striking both in candle and RSI terms. The analysis is on the 1W time-frame, with the 1W MA50 (blue trend-line) and the 1W MA200 (orange trend-line) standing out.
On the May 31 2021 1W candle, when the price broke and closed the week above the prior High/ Resistance, Oil eventually reached the 1.618 Fibonacci extension level. Currently that Fib level is at 159.00. With the 1W RSI well above its MA, it appears that WTI has enough momentum to break its prior High/ Resistance by July. This is a long-term thesis. I will be making updates on the 1D time-frame for shorter term trades.
--------------------------------------------------------------------------------------------------------
Please like, subscribe and share your ideas and charts with the community!
--------------------------------------------------------------------------------------------------------

WTI oil - The uptrend in oil continues to peakExactly one month ago, we stated that the Russian oil ban would lead to an uptick in oil prices. Since then, the European Union has started to take measures concerning its oil dependence on Russia. Meanwhile, WTI oil has risen from 106 USD up to 114 USD, where it trades currently. Despite being bullish in the short-term and medium-term, we also stated (in our previous posts) that we expected the bull market in oil to peak; in addition to that, we set and maintained our long-term price target for USOIL at 90 USD. That also applies today, and we still keep this target.
Fundamental factors
Our bearish view is based upon several fundamental factors. Among these is the prospect of higher output by the OPEC in the second half of 2022 and the global need for lower oil prices. We expect the U.S. to put pressure on OPEC; there is already a rumor Joe Biden is supposed to ask Saudi Arabia to lower its output. Another fact we consider is that despite the Russian oil ban, new highs were not reached by USOIL.
Illustration 1.01
USOIL appears in the downward sloping channel. The breakout above it will suggest more bulishness in the short term. The channel is
Technical analysis - daily time frame
RSI and Stochastic are bearish. The same applies to MACD; however, it remains in the bullish territory. DM+ and DM- are also bullish. Overall, the daily time frame is bullish; however, certain technical and fundamental developments raise caution.
Illustration 1.02
The picture above shows simple support/resistance levels.
Technical analysis - weekly time frame
RSI, MACD, Stochastic, DM+, and DM- remain bullish. Overall, the weekly time frame is bullish.
Please feel free to express your ideas and thoughts in the comment section.
DISCLAIMER: This analysis is not intended to encourage any buying or selling of any particular securities. Furthermore, it should not serve as a basis for taking any trade action by an individual investor. Therefore, your own due diligence is highly advised before entering a trade.

WTI spotcrude long positioncan see current price now doing new LH nears the resistace and normally i will let price to make decision to break our resistance or price gonna do new LH and continuation trend.
PEPPERSTONE:SPOTCRUDE

CFDs for WTI Crude Oil - SHORT D-RANGEThis graph is a representation of my point of you of the futures market (USD).

CFDs for WTI Crude Oil - GOOD TIME TO SELL - SHORTThis graph is a representation of my point of you of the futures market (USD).

CFDs for WTI Crude Oil - SHORT TERM - SELLThis graph is a representation of my point of you of the futures market (USD).

Oil at correction (down)Possible levels (1, 2) to start correction. This is just an idea, bullish continuation is also possible (3).
Good luck!

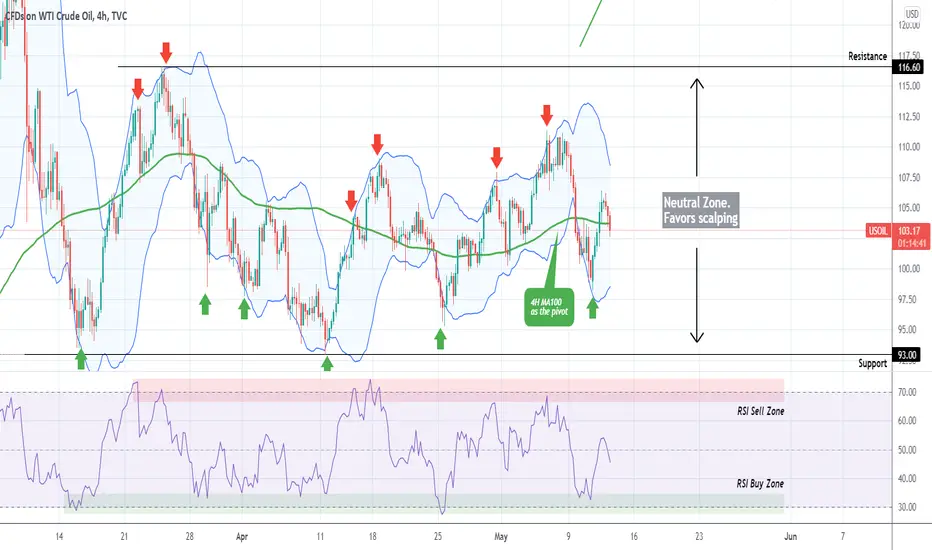
WTI OIL 1 month of scalping with 12 successful tradesAs mentioned on my last two ideas (April 19 and May 02), WTI Oil has been neutral on the medium-term where scalping was favored:
Today's analysis is on the 4H time-frame where you can see the range more clearly (Resistance at 116.60 and Support at 93.00). On this post I present the golden combination that offered 100% profitable results during this 1 month of scalping. The 4H MA100 (green trend-line) can be used as the Pivot Line. I've also plotted the Bollinger Bands (blue range).
As you see, every time the 4H RSI touched either its Resistance (sell signal) or Support Zone (buy signal), it bounced towards at least the 4H MA100 and in most cases even the top/ bottom of the Bollinger Bands before the next signal emerged.
So far this approach has given 100% success rate with 12/12 correct signals. We will continue scalping this until either the Resistance or Support level breaks.
--------------------------------------------------------------------------------------------------------
** Please support this idea with your likes and comments, it is the best way to keep it relevant and support me. **
--------------------------------------------------------------------------------------------------------
United States Oil FundNo clue how I found this chart, however, with looming concerns on various market, political and world disaster fronts - commodities, specifically OIL has been a major topic.
I still have to do some research on what this fund actually represents, however, I know for a fact it is at a key price point technically.
TECHNICALS
Widening downward cone
At diagonal + horizontal resistance
Fundamental factors could flip this level into support
RED trendline is a long term TL that has served as a sort of mean reversion point since the beginning of this fund.
With price now on the right side of this line, this could be bullish when paired with everything else.
BELOW: Long term charts on the WEEKLY and MONTHLY timeframes.
Also something that should be noted - This security is also listed on FTX as a synthetic stock token.
Previous analyses related to OIL linked below.

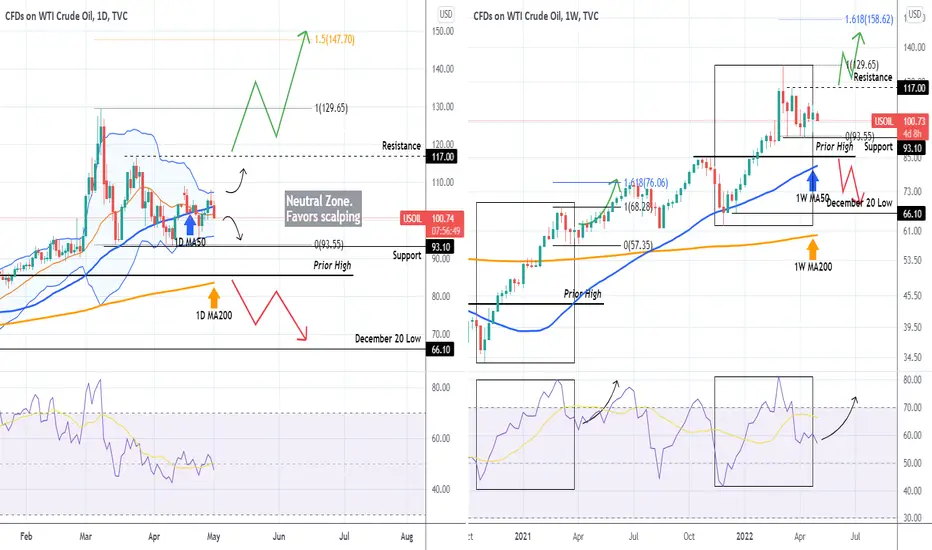
WTI OIL Scalping medium-term. Check these break-out levels.On my last WTI Oil analysis, I stated that the price action was neutral, which favored scalping:
Two weeks later, that still remains the case as we remain within the 117.00 Resistance and 93.10 Support, with the 1D MA50 (blue trend-line) being used as the pivot trend-line. For now, a high return strategy would be scalping the 1D Bollinger Bands (chart on the left).
On the longer-term 1W time-frame though (chart on the right), we see that the last 5 months resemble the price action of late 2020/ early 2021. The 1W TSI sequence is fairly similar and the longer we trade sideways on the medium-term the more it favors the consolidation bias of the accumulation scenario of March - April 2021 and then bullish break-out towards the 1.618 Fibonacci extension. A break below the 'Prior High' level of 85.00 would break both the 1D MA200 and the 1W MA200 (orange trend-lines on both charts) and should target the 66.10 December Low at least.
--------------------------------------------------------------------------------------------------------
** Please support this idea with your likes and comments, it is the best way to keep it relevant and support me. **
--------------------------------------------------------------------------------------------------------

USOIL - Choppy but still bearishYesterday, we showed a bearish breakout in the RSI of USOIL. Although, later, during the trading session, this breakout became invalidated, and RSI moved back above the horizontal support. Despite that, we remain bearish on the USOIL, and our price targets stay in place.
Illustration 1.01
The idea above shows yesterday's intraday breakout below the support in the RSI on the daily time frame chart.
Technical analysis - daily time frame
RSI, MACD, and Stochastic are all bearish. The same applies to DM+ and DM-. ADX exhibits growth which signals that the bearish momentum is gaining strength. Overall, the daily time frame is bearish.
Illustration 1.02
The picture above shows the retracement in the RSI on the daily chart.
Technical analysis - weekly time frame
RSI and Stochastic are bearish. MACD performed a bearish crossover recently; however, it remains in the upper area of the bullish zone. DM+ and DM- show bullish conditions in the market, with ADX suggesting their further deterioration. Overall, the weekly time frame is bearish.
Please feel free to express your ideas and thoughts in the comment section.
DISCLAIMER: This analysis is not intended to encourage any buying or selling of any particular securities. Furthermore, it should not serve as a basis for taking any trade action by an individual investor. Therefore, your own due diligence is highly advised before entering a trade.

WTI Crude Oil: 19.4 - A slide off the edge? A 'rising wedge" pattern is one of the most bearish candlestick patterns out there.
It's when the highs consolidate with the lows in the shape of a sharp triangle going up.
When the support trend-line breaks down - A trend reversal is usually ON!
Meaning that from higher highs and lows the shift is to lower highs and lows and new lower targets are targeted.
Yesterday I've covered how a break below 104.50 can be the beginning of a $10 or more drop down.
105.60 is another important support level to be broken and a blockage on the way down.
Today is a very critical day as it may break this level, the other scenario is that WTI could retest the broken rising wedge at the high 107's low 108's.
Pay close attention to the WTI today, as this could be the beginning of a significant correction down.
---------------------------------------------------------------------------------------------------------------------------------------------------------
I'd very much appreciate a like and follow if you found this analysis helpful :D
Please let me know what you would like to see more of and what you liked/disliked about my idea.
My goal is to benefit the trading community and help improve results of all traders across the board
---------------------------------------------------------------------------------------------------------------------------------------------------------

WTI oil - The EU ban on Russian oil risks higher pricesRecently, we stated that USOIL has bottomed out and is due to drift lower during the rest of the year. We continue to maintain this stance. However, over the past few days, there has been an increase in talks about the EU ban on Russian oil. Indeed, several media outlets reported that the EU is about to proceed with this step. Though, it is just a rumor at the moment. But if the EU manages to ban Russian oil, it will force us to abandon bearish bias for USOIL. Actually, in such a case, we think the oil ban would revive the rally and drag prices higher, possibly reaching a new high.
Illustration 1.01
The picture above shows USOIL on the daily time frame. It also shows the resistance at a slope (white line) and the bullish breakout above it (indicated by the yellow arrow). We will look for a potential breakdown in price and invalidation of the bullish breakout.
Technical analysis - daily time frame
RSI and MACD are bearish. However, MACD is trying to break above 0 points into the bullish zone. If it manages to do so, it will bolster the case for USOIL. Stochastic reversed to the upside and points in the bullish direction. DM+ and DM- show bearish conditions in the market. However, ADX contains a low value, indicating no significant trend. Overall, the daily time frame is neutral.
Technical analysis - weekly time frame
RSI started to flatten recently. However, its bearish structure remains intact. MACD is in the bullish zone; however, it began to decline first and then flatten. Stochastic is bearish. DM+ and DM- signal bullish conditions in the market. ADX declines, which suggests that the prior bullish trend of a higher degree is weakening. Overall, the weekly time frame is neutral.
Illustration 1.02
The picture above portrays the weekly RSI of USOIL. The bearish structure can be seen intact.
Please feel free to express your ideas and thoughts in the comment section.
DISCLAIMER: This analysis is not intended to encourage any buying or selling of any particular securities. Furthermore, it should not serve as a basis for taking any trade action by an individual investor. Therefore, your own due diligence is highly advised before entering a trade.

WTI OIL Neutral short-term buy watch these break-out levels.WTI Oil (USOIL) just broke above the Lower Highs trend-line that started after the brutal March 08 multi-year High. The 4H MA50 (blue trend-line) has turned into a short-term Support while the 4H MA200 (orange trend-line) remains the short-term Resistance.
Despite the Lower Highs trend-line, the price action remains rather neutral due to March's wild swings and high volatility, unless either the 93.10 Support or the 117.00 Resistance break.
A break below 93.10 should be bearish towards the 1D MA200 (red trend-line) and then the December 20 low, but still it would be best to get a closing below the 85.50 High of 2021 before engaging into long-term selling.
A break above 117.00 should be bullish towards the 1.5 Fibonacci extension (152.60) long-term, which is the less likely scenario.
The safest strategy on the medium-term is to scalp inside the neutral zone.
--------------------------------------------------------------------------------------------------------
Please like, subscribe and share your ideas and charts with the community!
--------------------------------------------------------------------------------------------------------

US oil long againABC pattern is finished.
Elliot wave will create new powerful upside.
Long investors gave up a lot also.
The major group can develop to next level of price this time.

Crude Oil WTI BuyA break of down trendline, may we see a change in direction of price to the up side. lets buy BLACKBULL:WTI at current price.

US OIL long positionThis entry is somewhat risky but it is at a good point of rise, the stop is short and we entered with little lottery
