Wtioil
US OIL - Daily - Shorts on the cardsOil - Daily - I see a big correction coming for oil on the weekly chart possibly down to $70-75 before a continuation of the bullish trend towards $100.

WTI Cude (OIL) SELL TRADE IDEA
💹WTI Crude Oil ⏬ SELL @ 80.99
✅TP-1# 80.09
✅TP-2# 79.10
✅TP-3# 78.10
⛔️SL 82.00
N.B- If have small balance to trade. Plz avoid OIL trade now.
Because market highly volatile.
AronnoFX will not accept any liability for loss or damage as a result of
reliance on the information contained within this channel including
data, quotes, charts and buy/sell signals
If you like this idea, do not forget to support with a like and follow.
Traders, if you like this idea or have your own opinion about it,
write in the comments. I will be glad.

a correctionin general USOIL is still trending up. an intra-day drop is expected should the daily trend line (purple) is respected.
Timescale: max 1 day.
Note: This is a quick analysis for supporting my USDCAD analysis. I do not trade USOIL .

OIl Going long at H4 momentum shift in weekly demand looking to go long on oil on a 4h chart with 4h shift in momentum at this weekly area of demand in a weekly uptrend

WTI OIL Bearish Reversal patternWTI Oil is on a typical Bearish Reversal pattern and the first signs of this were given last week as posted on my most recent analysis:
Right now the price is on Lower Highs, similar to the July peak and reversal fractal. If a 4H MA50 (blue trend-line) / MA100 (green trend-line) Bearish Cross is formed, it will confirm the sell target of the 1D MA50 (red trend-line). That is currently around the 0.382 Fibonacci retracement level and even though the price may dip even lower, that is a solid short-term short target.
--------------------------------------------------------------------------------------------------------
** Please support this idea with your likes and comments, it is the best way to keep it relevant and support me. **
--------------------------------------------------------------------------------------------------------

WTI: Down, Down! 🥰Within the current setup, we are expecting WTI to fall a bit further. The goal of the current movement lays around $78.59. After hitting this area, the price should massively increase again.
Happy Trading!

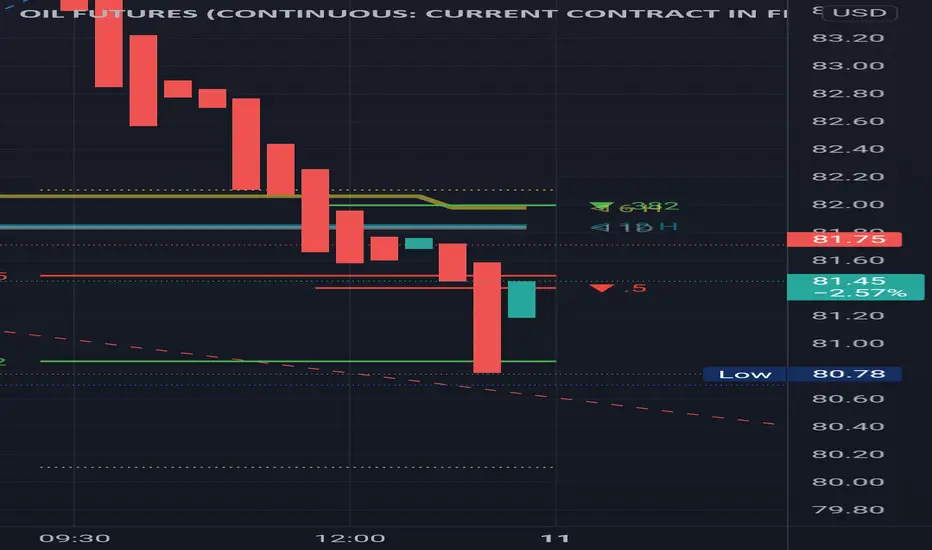
Technical analysis update: WTI oil (28th October 2021)On 25th October 2021 USOIL reached our price target of 85 USD per barrel. After that we announced that we would not be surprised to see shortlived correction since USOIL reached overbought condition in the short-term. Now it is clear that price retraced from high of 85.39 USD to as low as 80.62 USD today. It is likely that correction will continue little longer since indicators point to more downside. In short-term we are bearish and we will observe whether support at 80 USD will manage to stop selling pressure. However, in long-term we remain bullish and we think that current price drop presents good opportunity for long position (re)entry. Our long-term price target remains 90 USD.
Technical analysis
RSI penetrated 70 points to downside. It is bearish. MACD and Stochastic also turned bearish. DM+ and DM- are due to perform bearish crossover. ADX started to decrease from recent peak. Price retraced towards 20-day SMA. We will observe whether price manages to hold above 20-day SMA which would be bullish sign. Overall technical analysis is very bearish for WTI oil.
1-day RSI:
Support and resistance
Short-term resistance sits at 82.60 USD while major resistance sits at 85.39 USD. Support 1 appears at 80 USD and Support 2 sits at 76.95 USD. Support 3 lies at 74.21 USD. Major support sits at 61.58 USD.
Disclaimer: This analysis is not intended to encourage any buying or selling of any particular securities. Furthermore, it should not serve as basis for taking any trade action by individual investor. Your own due dilligence is highly advised before entering trade.

OIL SALES? After reaching the 261% fibbo extension, hitting the guideline of the last two highs on the high side, after 9 consecutive weekly green candles and plus the sum of the first low of the uptrend since 60 is a good time to think about sales. no?
This last weekly candle has left us a curious wick and the formation of an MHM, apart from all this we have to bear in mind that the price comes with a lot of upward force due to this we have to watch for false leaks at the maximum.
I don't want to waste too much. Greetings and good luck.

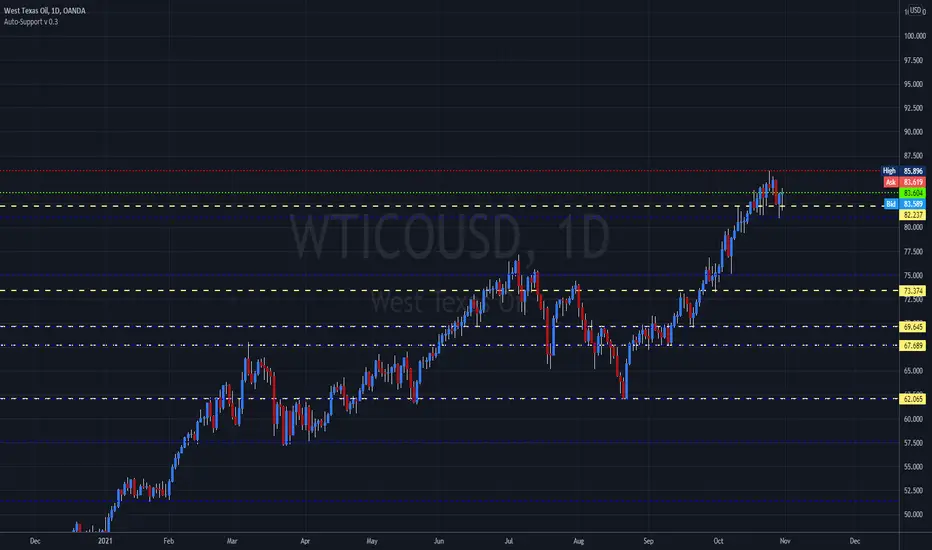
WTICOUSDThe West Texas Intermediate Crude Oil market has fallen rather hard to kick off the trading session on Thursday, but as you can see, we have rallied quite drastically to recapture the $82.50 region. By doing so, we ended up forming a bit of a hammer, which of course is a bullish sign. By doing so, I do think that it is only a matter of time before we continue to go higher. After all, we are in a very strong uptrend and that has not changed, despite the fact that we have pulled back over the last couple of days. Looking at this chart, the $80 level underneath is significant support, as it is a large, round, psychologically significant figure. The $80 level underneath has been important more than once, so therefore I think we will continue to pay close attention to it. At this point, I like the idea of picking up bits and pieces of value on dips, as the crude oil market has been so heavily influenced by the reopening trade and of course the fact that we are looking very likely to continue to see demand pick up due to the fact that there was so little in the way of capital expenditure over the last several months, and of course there has been an increase in burn rate. Furthermore, other forms of energy have failed miserably, and therefore power plants are being forced to burn petroleum as well. With the noisy behavior, I think it is only a matter of time before we see this market go looking towards the $85 level. The $85 level is a large, round, psychologically significant figure, and one that will be a target. If we can break above there, then it is likely that this market takes out to the upside.
Underneath, the $80 level should offer quite a bit of psychological and structural support, so that being said it is likely that we will see plenty of buyers in that area. The 50 day EMA currently sits just above the $75 level, and it does suggest a certain amount of resiliency and could be the “floor the market” going forward. Regardless, this is a longer-term uptrend, and we cannot fight it. Energy demand will continue to be very strong going forward, and therefore we should continue towards $90 over the longer term.
Lets see if we can have a pullback in Oil The trend is yours - its just to follow it. After some bullish weeks, we could see a pulllback as i mentor in the setup.
We have to breakdown from the triangle to confirm

WTI OIL Reversal confirmed if daily closes below the 4H MA100Even though my firms thesis has been very bullish on WTI Oil long-term throughout the whole year, that doesn't stop me from spotting potential medium-term tops and technical corrections that only serve for sustaining the uptrend on the long-term. An example was my following idea on October 19:
So far it appears that the price was indeed rejected on the Internal Higher Highs trend-line and is pulling-back on a potential technical correction towards at least the 1D MA50 (blue trend-line). However, further confirmation of this potential reversal can come if the price closes a day below the 4H MA100 (red trend-line). What's the importance of the 4H MA100? Well for the whole year, this has been the short-term support during WTI uptrends and every time a session closed below it, then the 1D MA50 was hit a few days later.
Important notice: Such a confirmation was also given by another indicator, the RSI, last time for the formation of the peak on the Fib 2.0 (as seen I've plotted the long-term uptrend on the Fibonacci Channel). The RSI made a Triple Top on the exact same Resistance that gave the July 06 peak on Fib 1.5. Keep an eye on such confirmations, they come quite useful when determining reversals that are hard to see coming when the price is on a trend.
--------------------------------------------------------------------------------------------------------
** Please support this idea with your likes and comments, it is the best way to keep it relevant and support me. **
--------------------------------------------------------------------------------------------------------

Technical analysis update: WTI oil (26th October 2021)WTI oil continues to rise along with other commodities. Recently, USOIL reached our short-term price target of 82.50 USD and then our medium-term price target of 85 USD. In light of these events we would like to change long-term price target of 90 USD to medium-term price target. In short-term we remain neutral as price of USOIl remains overvalued at the moment. Because of that we would not be surprised to see shortlived correction in WTI oil. Despite that we continue to be bullish on USOIL as rising demand and other fundamental factors support bullish case for it.
Technical analysis
RSI continues to move sideways in overbought territory. Its current value suggests that price is due to correct which would be very healthy for oil before next climb to 90 USD per barrel. We await reversal in RSI which will be accompanied by selling pressure. However, Stochastic and MACD remain bullish. Though, MACD loses momentum. ADX continues to grow which suggest that bullish trend is very strong and it is possibly nearing its peak.
Suport and resistance
Short-term support sits at 82.50 USD while short-term resistance sits at recent high of 85.39 USD. Support 1 lies at 80 USD and Support 2 sits at 76.95 USD. while Support 3 appears at 74.21 USD. Then major support sits at 61.58 USD.
Disclaimer: This analysis is not intended to encourage any buying or selling of any particular securities. Furthermore, it should not serve as basis for taking any trade action by individual investor. Your own due dilligence is highly advised before entering trade.

WTI - Oil forecastThe OIL price ( WTI) forecast has attached.
The golden zone to buy oil has also attached at the comment.

WTICOUSDThe West Texas Intermediate Crude Oil market has initially rally during the trading session on Monday, reaching towards the crucial $85 level. The $85 level of course has a certain amount of psychological importance attached to it, so it is worth paying attention to the fact that we have fallen from that level. The market forming a bit of a shooting star suggests that we are ready to pull back just a bit, but I do think there is enough support underneath to keep this market going forward. All things been equal, the market is very bullish, and nothing has changed. I anticipate that there is probably a certain amount of resistance to the $85 level based not only upon psychology, but probably based upon the options market as well. Nonetheless, I do like the idea of pulling back and finding value that we can take advantage of going forward. The $82.50 level attracts a certain amount of attention, and most certainly the $80 level will as well. I think the $80 level is your short-term support level, and therefore I think that is the bottom of the overall range.
Keep in mind that there is a major amount of demand for crude oil, and we had also seen a lack of production during the pandemic, so therefore we have a bit of a “perfect storm” for higher pricing as the economies around the world continue to reopen, and of course demand surges for energy. We are not only seen this in the WTI market, but we are seeing it in the Brent market, natural gas markets, and quite frankly even the coal markets. In other words, anything energy related is going to continue to have quite a bit of momentum attached to it. With that in mind, I think this continues to be a “buy on the dips” scenario, and therefore I am not looking for selling opportunities. Longer-term, I do think that we break above the $85 level and go looking towards the $90 level. Looking at this chart, the market has been very bullish, and should continue to be so as we are simply grinding away in a 45° angle, which is a very healthy amount of momentum overall. It is not until we break down below the 50 day EMA that I would consider shorting this market.

Oil sales? The Oil analysis is very simple, we follow an upward trend with a projection up to 86/87. Tambein made small operations without confirmation in case he decides to change trend. Today 10/20/21 I keep a short with the SL at the maximum of laterality. If it surpasses this (No false breakout) it should remain bullish. We are attentive.
The entrance is Sclaping but the operation is Swing with strokes up to 75/60/50

WTI OIL is about to top soon. Reversal imminent.On my most recent WTI Oil idea I laid out the reason why I expected it to tun parabolic towards $82.50:
That target has now been reached and on the 1D time-frame, WTI is approaching a very strong Support cluster both on price and RSI terms.
As you see the price is close to the internal Higher Highs trend-line that connects the March 08 and July 06 Highs. Also it is approaching the 2.0 Fibonacci extension of the Fibonacci Channel that is trading on since March. This extension is key because as you see the previous Higher Highs have been rising on a +0.5 Fib interval (1.0 and 1.5). The next in line is arithmetically 2.0.
At the same time, the 1D RSI is testing the 76.30 Resistance. The July 06 High came on a RSI Triple Top. We already have a Double Top. Watch this sequence closely as a potential Triple Top may be the signal for the correction. The 1D MA50 and 1D MA200 are there to offer Support.
--------------------------------------------------------------------------------------------------------
** Please support this idea with your likes and comments, it is the best way to keep it relevant and support me. **
--------------------------------------------------------------------------------------------------------

WTI OIL , channel breakout , time for retest and then pump!hey yall ,
if you look at WTI Oil's past rn , you'll see we kinda have the same pattern rn . in both of them we have descending channels . in the last pattern , WTI did a retest after breaking above the channel .
so I'm guessing after going up a little bit , we will have a retest and then pump is gonna happen . it'll be a huge pump . imo the price will even get to 1000 $ . we'll see though , if we were alive...
so the next update will be 3 years later perhaps , this retest will probably take 3 years to happen cause we are on monthly chart .
Imma update it if I was alive :D
if you liked the idea , give it a like .
and if you wanna see more of these , follow , heck of analysis are on the way !
also tell me your opinions on this idea in the comments .
GoOOoOd LuUuUUuck

USOIL. P-Modeling PT V2. Inverted Springs of Cajun OilWelcome Hyperspace Agents,
This is the second part of US OIL. Part V2.
In order to understand this chart. You must do the following:
- View the ENTIRE Time-Series Analysis.
- View Pt. 1 of the US OIL idea.
-Try and Grasp the understanding of Harmonics and Inverted C&H formations.
-Be open minded.
Please see the snapshots in order. They represent a snapshot progression of the dynamic model being executed. This is called a Time-Series Analysis.
Time-Series Start:
Baseline Snapshot: 1 Week TF.
Inverted cup and handle formation not yet executed.
Dec 6th, 2019
Price $58.25
Next Snapshot: 1 Week TF.
Inverted Cup and Handle formation has been partially executed up to the C & D conjunction of the HANDLE harmonic of the formation. Formation Validated.
March 26th, 2020
Price $23.79
Next Snapshot: 1 Week TF.
Inverted Cup and Handle formation EXECUTED. Past lowest linear conjunction of Handle.
April 20th,2020
Price $14.85
Next TWO snapshot: 1 Week TF.
Inverted Cup and Handle formation Executed. Full cup pour to $0.00 and oil goes (-) on some exchanges.
April 20th, 2020
Price $13.61
& Oil goes to 0.
Now let us fast forward to the rebound dead-cat.
We create a harmonic exit pattern, leading into new bull-run for oil.
Sept 1st, 2020
Price $43.06
I thought, why not a nice double bottom inverted spring to set us off the cajun way.
We begin 2nd crash of oil.
Sept 8th, 2020 (posted date).
Price: $36.46
________________________________________________________________
You can find all the original snapshots here:
Please view PT 1.
Snapshot Time-Series Analyses are very hard to refute. Because the proof is in front of you. No numbers. No guessing. Simply View the evidence in picture format.
Area of Interest was confirmed in PT 1.
Target for this drop is $11 stable on US OIL.<---
WTI OIL will also drop to a TP of 0.11 cents.
Idea here :
Covid-19 Wave Two.
Dropped demand.
Complex Supply availability due to weather.
May even see a flash crash to 0$ again..
Who knows..
Not I said the sheep.
Thanks for Pondering the Unknown with Me,
Glitch420

Technical analysis update: WTI oil (11th October 2021)USOIL reached our short-term price target of 80 USD. Because of that we would like to update our idea. We would like to change medium-term price target of 82 USD to short-term price target. In addition to that we would like to set new medium-term price target to 85 USD. Our long-term price target of 90 USD remains unchanged. We continue to be bullish on WTI oil and we expect price to continue its climb.
Technical analysis
MACD is bullish. Stochastic is also bullish. RSI is bullish, however, it reached overbought condition again. We previously noted that such phenomenon is often followed by correction in price (we noted that before slump towards 75 USD occured). ADX continues to grow which suggests that trend is strenghtening. We continue to be bullish but we would like to see price stabilize at current level first. It is possible that USOIL will move in certain range for while before continuing higher.
Support and resistance
Short-term support appears at 79.76 USD. Another two supports below that sit at 76.95 USD and at 74.21 respectively. Next strong support sits around 65 USD while major support lies at 61.58 USD. Current short-term resistance sits around 82.50 USD. Another resistance level appears at 85 USD.
Here is link to our previous thought from 7th October 2021:
Disclaimer: This analysis is not intended to encourage any buying or selling of any particular securities. Furthermore, it should not serve as basis for taking any trade action by individual investor. Your own due dilligence is highly advised before entering trade.

Technical analysis update: WTI oil (7th October 2021)In our last idea we pointed out that RSI reached overbought condition and that such occurence is often followed by correction. We also noted that correction would drag price towards 75 USD per barrel. In addition to that we said that we would remain bullish even if correction took place. We continue to maintain that bullish stance. We actually think that current price is very attractive for investors as we expect eventual resumption of uptrend followed by retest of resistance at 79.76 USD. Our short-term price target remains 80 USD, medium-term price target 82 USD and long-term price target 90 USD.
Fundamental analysis
Recently OPEC decided not to boost prodcution further which is very positive fundamental development for oil worldwide. Several media news outlets reported that it is very likely that OPEC could not increase its production even if it wanted to because it lacks capacity to do so. Demand continues to pick up and we expect this trend to prevail over following 12 months. United Kingdoms continue to report shortages of fuel at its gas stations. Natural gas continues to grind higher altogether with oil while there is increasing talk of strong winter for 2021.
Technical analysis
RSI reversed from overbought condition and it currently points in bearish direction. We will observe whether it starts to flatten which would suggest that correction ceased. MACD continues to be bullish at the moment, however, it is losing momentum. Stochastic remains bullish. DM+ and DM- suggest that bullish trend is still present. ADX reversed but it continues to have bullish structure. We will observe it closely and we will look whether it manages to resume growth.
Support and resistance
Closest area of interest is 75 USD while short-term support appears below that at 74.21 USD. We will observe whether these two levels will manage to stop further selling pressure. Another two areas of interest are at 71.46 USD and 65.11 USD. Below that is major support level at 61.76 USD. Short-term resistance sits at 76.95 USD while another resistance above that lies at recent high of 79.76 USD
Recent track record
Here we did set short-term price target to 77.50 USD which was reached on 4th October 2021.
Here we did set short-term price target to 75 USD which was reached on 27th September 2021.
Here we did set short-term price target to 72.50 USD which was reached on 15th September 2021.
Disclaimer: This analysis is not intended to encourage any buying or selling of any particular securities. Furthermore, it should not serve as basis for taking any trade action by individual investor. Your own due dilligence is highly advised before entering trade.


WTI OIL Long Setup! Buy!
Hello,Traders!
WTI OIL is trading in a strong uptrend
And the price broke a strong key level recently
Now, we are seeing a pullback and a retest
Of the level, that became support
This is a classic bullish setup
And I think that there is a good chance
To see oil moving higher
Sell!
Like, comment and subscribe to boost your trading!
See other ideas below too!
