WTI OIL pull-back needed for next Higher HighPattern: Bullish megaphone on 4H.
Signal: Buy once the price touches the 4H MA100 (green trend-line) again.
Target: $69.00 (right below the 2.5 Fibonacci extension and on the Higher Highs trend-line of the Megaphone).
** Please support this idea with your likes and comments, it is the best way to keep it relevant and support me. **
--------------------------------------------------------------------------------------------------------
!! Donations via TradingView coins also help me a great deal at posting more free trading content and signals here !!
🎉 👍 Shout-out to TradingShot's 💰 top TradingView Coin donor 💰 this week ==> Cryptorphic
--------------------------------------------------------------------------------------------------------
Wtioil


Crude Oil Short Term Buy IdeaH4 - The price which is moving higher has broken above a strong resistance zone and is holding above it.
Currently, this strong resistance zone acts as a strong support zone for us.
Until this strong support zone holds my short-term view remains bullish here.

Good Mid-Term trading riskHere we see it is bouncing off long term lows very nicely. If we look more at the current time period it only further confirms this. Look for continuation into the coming days/weeks until it retest pre-crash highs.

CRUDE OIL~SHOOTING STAR AS SIGN OF REVERSALHello traders and investors,
Welcome to technical analysis of CRUDE OIL.
if you like this analysis please like and comment below, it will support creating more analysis for you.
we see shooting star candlestick near major weekly resistance on weekly chart , this can be sign of reversal .
hidden bearish divergence also gives us indication of bears are coming soon.

OIL - time for a reasonable correction?Impulse may be completed.
I would assume a likely move down at least to 38% retracement

Open your favorite energy drink boys: we're bullish with wingsMy crystal ball has again spoken to me: USOIL be pumpin' it. And not just from the ground. Covid is saying a big NO to newer sources of energy. This year we're falling back on the good old black gold. So bring out your Justin boots and go loooong on that sweet USOIL, partner.

USOIL - Growing Channel - Reversal & Breakout Predictions
Welcome!
What's up traders! Thanks for Jumping back on my Analysis, 👨💻 Trader champ is here behind the charts, Hit the thumbs up 👍 and support the work
Follow the trade plans and notes. Sketch up your own trade setup and make sure you meet with the required confirmations first, before you make your move!
________________________________________________
Traders Disclaimer: Non of our analysis or trade setups which is shared here on trading view is a trading advice. As we keep on weekly updates with our predictions and expectations. We may take them as a trades only if trade setups meets the required criteria ( Confirmations ). We will never make a move or look back if trade setup invalidates with price action or future economical movements. Understanding the markets is the key behind all success stories. So never miscalculate under estimate anything which is out of your bounds. Take them at your own risk as trading is highly risky and you may loss your investments.
Mohamed Khalid Rafi ,
Senior Financial Analyst,
Profitlio Trading.

USOIL IDEA BEARISH DIVERGENCE FORMING 4H CHART WTIOIL CRUDE OILUSOIL IDEA BEARISH DIVERGENCE FORMING 4H CHART WTIOIL CRUDE OIL


WTI OIL First buyers on the 4H MA50Pattern: Channel Up and Bullish Megaphone on 4H.
Signal: Bullish once the price makes contact with the 4H MA50 (strong buy accumulation level since November).
Target: 60.00 (top of the Channel Up), if seeking more risk aim at 62.50 (top of the Megaphone and 2.0 Fibonacci extension, which indicates the Higher High since November).
** Please support this idea with your likes and comments, it is the best way to keep it relevant and support me. **
--------------------------------------------------------------------------------------------------------
!! Donations via TradingView coins also help me a great deal at posting more free trading content and signals here !!
🎉 👍 Shout-out to TradingShot's 💰 top TradingView Coin donor 💰 this week ==> xBTala
--------------------------------------------------------------------------------------------------------

WTI OIL Wait for a 4H MA50 test before enteringPattern: Channel Up & Bullish Megaphone on 4H.
Signal: Buy once contact is made again with the 4H MA50 (blue trend-line).
Target: 60.00 (top of the Channel).
Most recent WTI idea:
** Please support this idea with your likes and comments, it is the best way to keep it relevant and support me. **
--------------------------------------------------------------------------------------------------------
!! Donations via TradingView coins also help me a great deal at posting more free trading content and signals here !!
🎉 👍 Shout-out to TradingShot's 💰 top TradingView Coin donor 💰 this week ==> TradingView
--------------------------------------------------------------------------------------------------------

Current Thinking on WTI weeklyDown sloping PF off 2016 low and 2018 high (red)
The median line provided some key areas of resistance/support from 2017 to present
Support in 2020 low off lower parallel (good rejection)
Test after price break late 2020
Next target is upper parallel. An option is that price breaks above upper parallel then pulls back to test the break

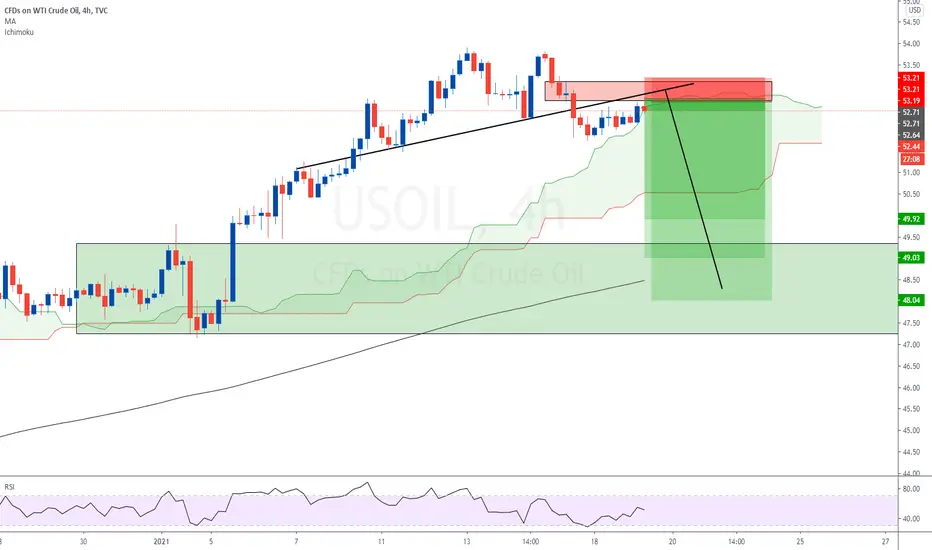
WTI OIL Buy SignalPattern: Bullish Megaphone on 4H.
Signal: Buy if the 53.90 Resistanct breaks, as the 4H MACD and RSI is repeating the December 02 - 10 bottom fractal.
Target: 56.00 (the 2.0 Fibonacci extension, which has been holding since late November).
** Please support this idea with your likes and comments, it is the best way to keep it relevant and support me. **
--------------------------------------------------------------------------------------------------------
!! Donations via TradingView coins also help me a great deal at posting more free trading content and signals here !!
🎉 👍 Shout-out to TradingShot's 💰 top TradingView Coin donor 💰 this week ==> michaelzerna
--------------------------------------------------------------------------------------------------------

Judgement time for WTI Oil according to the DXY.Simple chart comparison on a +12 year time span. Oil on a Channel Down, DXY on a Channel Up. Every time DXY kept its Support (green zones), Oil failed to make a Higher High and break its Lower Highs trend-line.
Oil hasn't made a Higher High since July 2008 and the Sub-prime mortgage crisis. Is it time to do so, if DXY breaks its Support this time? Thoughts???
Most recent WTI idea:
Most recent DXY idea:
** Please support this idea with your likes and comments, it is the best way to keep it relevant and support me. **
--------------------------------------------------------------------------------------------------------
!! Donations via TradingView coins also help me a great deal at posting more free trading content and signals here !!
🎉 👍 Shout-out to TradingShot's 💰 top TradingView Coin donor 💰 this week ==> Astael
--------------------------------------------------------------------------------------------------------

CRUDE OIL - SELL - Daily chart calls for a correction down to 48US Oil - H4 - Selling at the test of this H4 supply zone with targets down to 50 - 49 - 48 and stops above 53.20
UKOIL ShortGood luck to you!
Don't forget to like and share, it really helps.
Follow for more.
This is just an idea, not financial advice.

WTI OIL needs to hit the 4H MA50 to accumulate buyersPattern: Bullish Megaphone on 4H.
Signal: Buy once contact is made with the 4H MA50 (blue trend-line) and after the price consolidates with a Double Bottom. Every drop below the 4H MA50 has been the optimal buy entry.
Target: 53.90 (the Resistance) and for those seeking more risk 56.00.
Most recent WTI signal:
** Please support this idea with your likes and comments, it is the best way to keep it relevant and support me. **
--------------------------------------------------------------------------------------------------------
!! Donations via TradingView coins also help me a great deal at posting more free trading content and signals here !!
🎉 👍 Shout-out to TradingShot's 💰 top TradingView Coin donor 💰 this week ==> ProjectSyndicate
--------------------------------------------------------------------------------------------------------

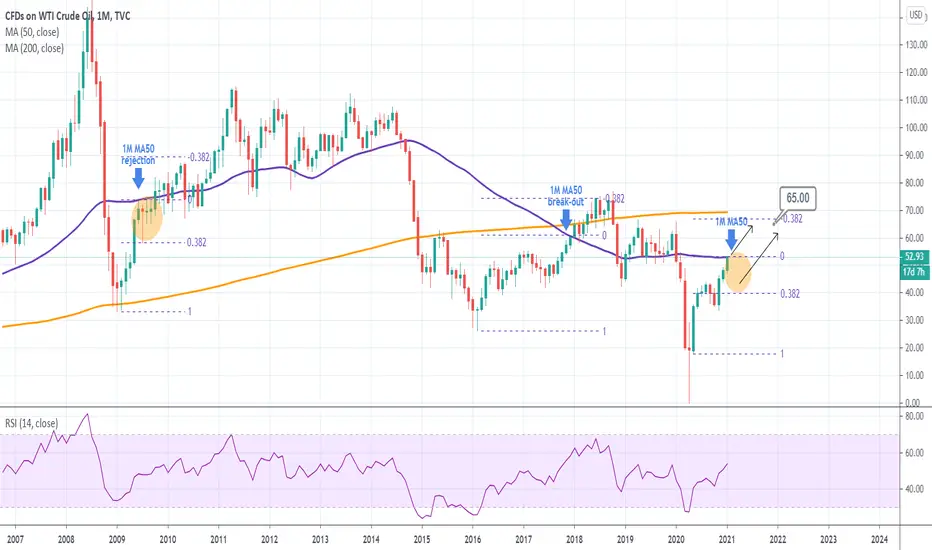
WTI OIL Testing the monthly MA50 for the first time since FebAttention is needed now for WTI Crude Oil traders as the asset has made contact with the 1M MA50. That is the first touch on that trend-line since February 2020, right before the massive March COVID melt-down.
Last time this level was tested as a Resistance, recovering from a similar melt-down, was in December 2017. The price easily broke above it on the next candle and made a top on the -0.382 Fibonacci extension.
Before that, the previous 1M MA50 test as a Resistance, was in June 2009. It failed to close the monthly candle above it and pulled back to the 0.382 Fibonnaci retracement level. Then a few months later, it closed its first candle above it (October 2009) and as in 2018, it peaked just below the -0.382 Fib extension.
What could this mean for oil traders? Well unless we close one 1M candle above the MA50 (53.00), then it is more likely to get a pull back to the 0.382 Fibonacci retracement level (40.00) before the price peaks on the -0.382 extension (65.00).
Do you agree? Feel free to share your work and let me know in the comments section!
Most recent WTI signal:
Please like, subscribe and share your ideas and charts with the community!
--------------------------------------------------------------------------------------------------------
!! Donations via TradingView coins also help me a great deal at posting more free trading content and signals here !!
🎉 👍 Shout-out to TradingShot's 💰 top TradingView Coin donor 💰 this week ==> ProjectSyndicate
--------------------------------------------------------------------------------------------------------

OIL is very high, we need a retrace(4h Analysis)
OIL is very high to buy. wait for Dips to Buy.
I sell at 50
SL 52
TP 47.5

WTI OIL Buy SignalPattern: Channel Up on 4H.
Signal: Buy as the price is near the Higher Low trend-line of the pattern, the RSI near the Lower Low of its Channel Down and the MACD made the Bearish Cross
Target: 50.50 (the -0.236 Fibonacci extension).
Recent WTI signal:
** Please support this idea with your likes and comments, it is the best way to keep it relevant and support me. **
--------------------------------------------------------------------------------------------------------
!! Donations via TradingView coins also help me a great deal at posting more free trading content and signals here !!
🎉 👍 Shout-out to TradingShot's 💰 top TradingView Coin donor 💰 this week ==> Jpolitis
--------------------------------------------------------------------------------------------------------

