Wtioil

Crude oil Holding its GainsThe WTI managed and closed in green yesterday, with a 1.29% increase in values. Bulls were able to maintain a positive note. The market is now eyed towards today's inventory report, where a -2.8M decrease is forecasted.
With the risk-on mood, bulls cheer the fresh high last visited on March 2020, aiming to the 48$ mark and getting closer to the 49$ handle at a pre-pandemic mayhem level.
The vaccine optimism with the US and UK inoculation by Pfizer/BioNTech continues to be praised by the energy market.

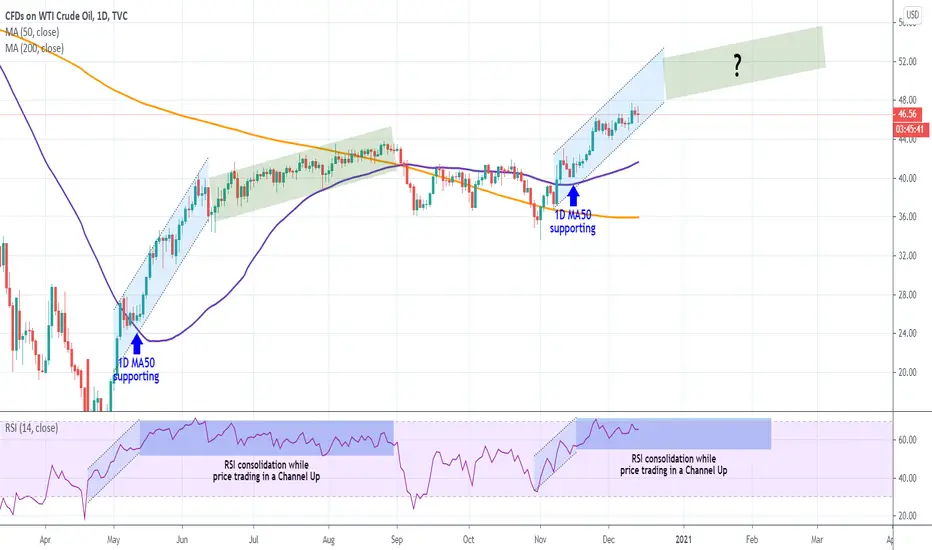
WTI OIL Are we repeating May's Channel Up? Slow rise to $55?This is a strange but quite interesting fractal I found as I was trying to break-down the current Channel Up on the 1D time-frame that WTI is trading in.
As you see the current pattern resembles the sequence of May-early June 2020. Both started rising aggressively after the 1D MA50 (blue line) turned into Support. Shortly after the RSI turned sideways and in the case of May/ June, it stayed sideways and consolidated until the end of August.
So far we see this RSI consolidation on full display and it leads me to believe that we may have a similar development into early 2021. Is $55 possible by March? What do you think?
** Please support this idea with your likes and comments, it is the best way to keep it relevant and support me. **
--------------------------------------------------------------------------------------------------------
!! Donations via TradingView coins also help me a great deal at posting more free trading content and signals here !!
🎉 👍 Shout-out to TradingShot's 💰 top TradingView Coin donor 💰 this week ==> TradingView
--------------------------------------------------------------------------------------------------------
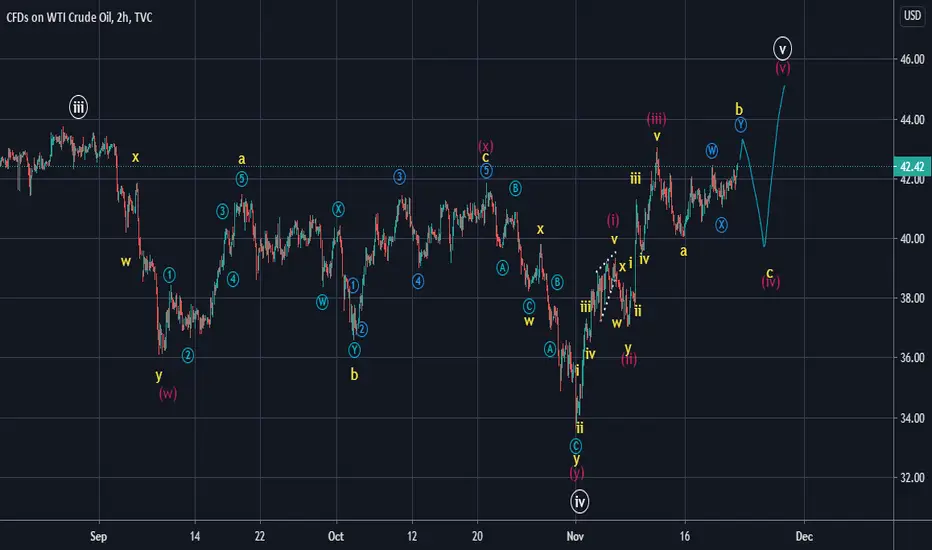
WTI OIL Buy SignalPattern: Ascending Channel on 4H.
Signal: Buy as the price just hit again the 4H MA50, which has been supporting since November 03. Keep another buy ready in case the price hits the 0.618 Fibonacci retracement level (Highs and Lows since November 06 are on a progressive sequence). MACD repeating the Nov 16-22 consolidation pattern.
Target: 48.00 (just below the 0.382 Fib extension).
** Please support this idea with your likes and comments, it is the best way to keep it relevant and support me. **
--------------------------------------------------------------------------------------------------------
!! Donations via TradingView coins also help me a great deal at posting more free trading content and signals here !!
🎉 👍 Shout-out to TradingShot's 💰 top TradingView Coin donor 💰 this week ==> TradingView
--------------------------------------------------------------------------------------------------------

OIL SELL TP_41.15_9.74%_4.44pips_SL_46.20_1.34%_0.61pipsOIL SELL TP_41.15_9.74%_4.44pips_SL_46.20_1.34%_0.61pips

WTI OIL Double entry Buy SignalPattern: Ascending Channel on 4H.
Signal: Buy as the price just hit the 4H MA50, which has been supporting since November 03. Keep another buy ready in case the price hits the 0.618 Fibonacci retracement level (Highs and Lows since November 06 are on a progressive sequence) as the MACD is still open.
Target: 48.00 (just below the 0.382 Fib extension).
** Please support this idea with your likes and comments, it is the best way to keep it relevant and support me. **
--------------------------------------------------------------------------------------------------------
!! Donations via TradingView coins also help me a great deal at posting more free trading content and signals here !!
🎉 👍 Shout-out to TradingShot's 💰 top TradingView Coin donor 💰 this week ==> TradingView
--------------------------------------------------------------------------------------------------------

Oil Stays Near The $45 Level Ahead Of OPEC+ DecisionOil made an attempt to settle below the $45 level but received strong support at $44.45. The nearest support level for oil is still located at $44.75. If oil declines below this level, it will head towards the recent lows at $44.45.
A successful test of this level will open the way to the test of the next support level at $43.75.
On the upside, the nearest resistance level for oil is located at $45.80. A move above this level will push oil towards the next resistance at the recent highs at $46.25. If oil manages to settle above this level, it will head towards the $47 level.

WTI- Can it reach 50?After a few days of consolidation between 39 and 42, Oil broke above resistance and also above the recent 43 high and looks determined to continue higher.
The chart looks very constructive and with this new "vaccine" and wave of optimism crude oil could find strong bids that can drive the price to 50 old support now resistance.
As long as the price is above 43 on a daily close basis I'm bullish

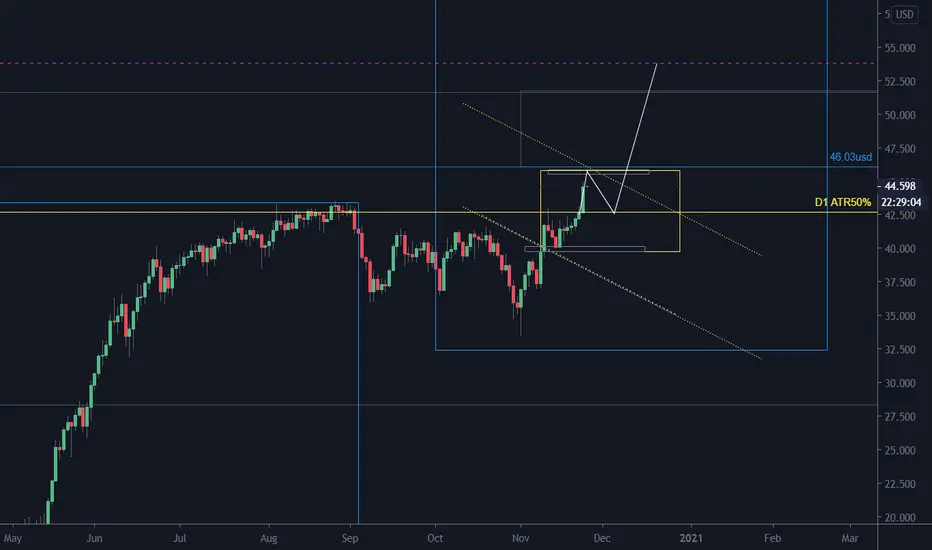
WTICOUSD correction approaching.WTICOUSD correction approaching. Continuing my analysis, it can be seen that WTI oil is nearing the end of its third rising wave cycle. In my analysis, I assume that the motion may turn south from the 45-46usd range and the D1ATR will drop to a level of 50.6 to 42.6 usd. Consequently, a profit realization can begin at these levels. I would not start a long position from this level. Of course, the long-term picture may continue to rise, with a target price above US $ 50. While waiting for the correction to another long position, I am thinking of 42-43 usd levels.
WTI Oil - time to drop (please!)Our reviewed and renewed chart on Oil, how it has been rising on positive sentiment and vaccine news but also it has hit the resistance and a drop (even temporary or bigger) is expected.
We have positions opened from selling last week, we are doing dollar cost averaging and selling now again, so please oil, just drop ;)

OIL SELL TP_33.56_17.87%_7.30pips_SL_42.80_4.75%_1.94pipsOIL SELL TP_33.56_17.87%_7.30pips_SL_42.80_4.75%_1.94pips

WTI USOIL still bullish on higher timeframesCrude Oil is still looking bullish on higher timeframes before a major resistance ahead.
The indicators are showing buy signals on the daily timeframes and 3 days chart.
If you are interested to test some amazing BUY and SELL INDICATORS, which give the signal at the beginning of the candle, not at the end of it, just leave me a message.

WTI OIL Trading PlanPattern: Channel Up on 4H.
Signal: (A) Buy as long as the 4H MA50 is supporting, (B) Sell if it breaks.
Target: (A) 43.40 (September 01 High), (B) 40.20 (just above the 4H MA200).
** Please support this idea with your likes and comments, it is the best way to keep it relevant and support me. **
--------------------------------------------------------------------------------------------------------
!! Donations via TradingView coins also help me a great deal at posting more free trading content and signals here !!
🎉 👍 Shout-out to TradingShot's 💰 top TradingView Coin donor 💰 this week ==> johnmcal3
--------------------------------------------------------------------------------------------------------

WTI outlookAlthough the price of Oil remains elevated, it doesn't convince me...
Rises are very well capped around 42.50-43 zone and I expect the price to tumble sooner or later.
A daily close under 41 would be the signal for bears and, considering the economic outlook, 35usd/Baril would not surprise me at all
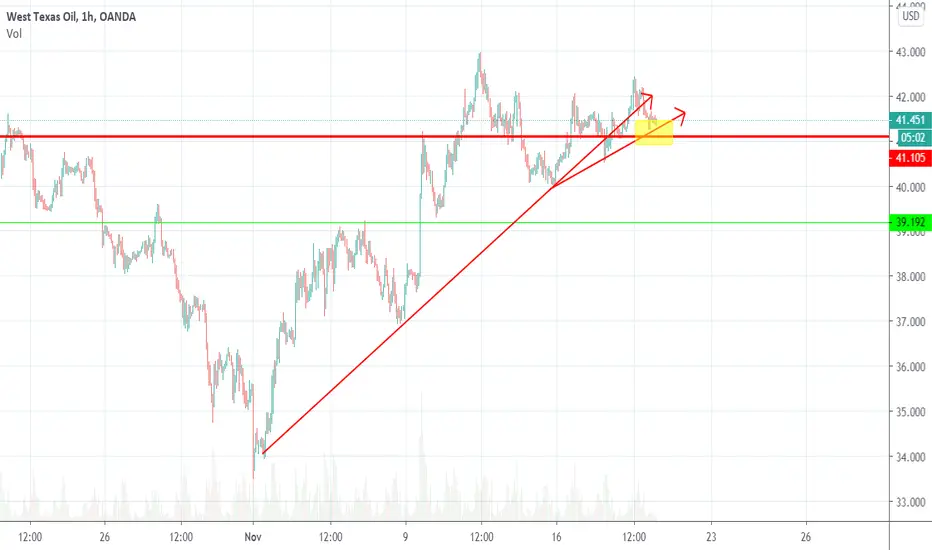
Where will the Oil go?WTI is in an uptrend of H1, forming a Triangle figure in its last part.
The lower peaks and higher bottoms form a triangle, which we expect to be break soon.
In the event of a break up, we will expect the upward movement to continue.
The levels we expect it to reach are:
43.02
43.73
A break below the previous bottom will remove this scenario.
To support us, like and comment!

WTI OIL- Back to 40$ or lowerOUR TECHNICAL ANALYSIS ON CRUDE OIL WITH KEY SUPPORT AND RESISTANCE LEVELS AND PRICE TARGETS

WTI iH&S - $75 by 2019?Western Texas Intermediate intermediate showing possible inverse head and shoulders. Target $70-$80.

WTI- Drop after confirmationAs I said last week, I'm bearish WTI and, as expected, Oild dropped under the trend line support.
Now the price came and test the last support and confirmed it like new resistance and I expect a drop in the near future.
My target for short is 37 with 39 as interim support.
A daily close above 43 would negate this scenario

Oil- Time to SELL againOil has risen early this week but we see major resistance being checked and possible drop in the next few hours.
We are going short again, now.

WTI- I maintain my 37 targetWTI had a short-lived spike above resistance and this rise proved to be a false break.
Now Oil is trading just in rising trendline support and a break here should accelerate losses towards at least 37.

OIL- We called the drop nicely TP levels on chartSo we called the drop nicely, now let's take a look at our targeted take-profit levels

USOIL IDEA IMPORTANT LEVELS TO TRADE 4H CHART - WTIOIL CRUDE OILUSOIL IMPORTANT LEVELS TO TRADE 4H CHART - WTIOIL CRUDE OIL
These levles and trend line will help you to keep SL and to book profit ..Safe and Happy trading..!!!
