USOIL IDEA IMPORTANT LEVELS TO TRADE 4H CHART - WTIOIL CRUDE OILUSOIL IMPORTANT LEVELS TO TRADE 4H CHART - WTIOIL CRUDE OIL
These levles and trend line will help you to keep SL and to book profit ..Safe and Happy trading..!!!
Wtioil

OIL made 2 month highs! What is the ceiling for the market?WTI Oil broke above the 2 month Resistance zone of 41.50 - 41.90 and is fast approaching the 43.80 High of August 26 (chart on the left). Needless to say, it broke above the bearish channel and reached the 43.00 Target as I discussed two days ago on the idea below:
How far can this go for the short-term? As the left chart shows (4H time-frame), the MACD hasn't yet rolled over (as it did on September 20), so the uptrend can extend a little further on the short-term before buyers book profits and cause a minor pull-back.
On the long-term though we have to look at the 1D time-frame (right chart), which shows an interesting development. The sequence since the November 02 low, is similar to the one following the late April bottom. The MACD pattenrs are identical. I don't need to remind you that it was the rescue package along with OPEC's production cuts that supported this insane recovery rally back then. This week we had the very encouraging vaccine news.
Can Oil start a similar rally based on such positive news? Is $47 again a realistic number? Feel free to share your work and let me know in the comments section!
Please like, subscribe and share your ideas and charts with the community!
--------------------------------------------------------------------------------------------------------
!! Donations via TradingView coins also help me a great deal at posting more free trading content and signals here !!
🎉 👍 Shout-out to TradingShot's 💰 top TradingView Coin donor 💰 this week ==> seba26-77
--------------------------------------------------------------------------------------------------------


GOOD TIME FOR REVERSALI for one dont expect these current moves to hold, and they are gold shorts and oil longs this is praising for covids disappearance, which is not the case even with vaccine news, good time to trick retail and go the other way.

OIL SELL TP_31.40_19.20%_7.46pips_SL_41.17_5.94%_2.31pipsOIL SELL TP_31.40_19.20%_7.46pips_SL_41.17_5.94%_2.31pips

WTI- Looking to sellFrom 34 recent low Oil has risen 20% to 41 resistance zone.
Now the price is just under this important resistance and I expect Oil to remain in this 35-41 range in the medium term
That being said I will look to sell rallies above 41 with a target on the lower part of the range

WTI OIL high chances to break its bearish channelPattern: Channel Down on 4H.
Signal: Buy if the Lower Highs trend-line of the Channel Down breaks (practically if the 0.786 Fib breaks), as this time the price broke the 4H MA200 (as opposed to September 18) while the MACD is on a Bullish Cross.
Target: 43.00 (the 0.918 Fib, last Resistance before a full recovery).
Most recent WTI OIL signal:
** Please support this idea with your likes and comments, it is the best way to keep it relevant and support me. **
--------------------------------------------------------------------------------------------------------
!! Donations via TradingView coins also help me a great deal at posting more free trading content and signals here !!
🎉 👍 Shout-out to TradingShot's 💰 top TradingView Coin donor 💰 this week ==> TradingSafely
--------------------------------------------------------------------------------------------------------

WTIOIL USOIL CRUDE INTRADAY 39.30 Expected - 30MIN CHARTWTIOIL USOIL CRUDE INTRADAY 39.30 Expected - 30MIN CHART

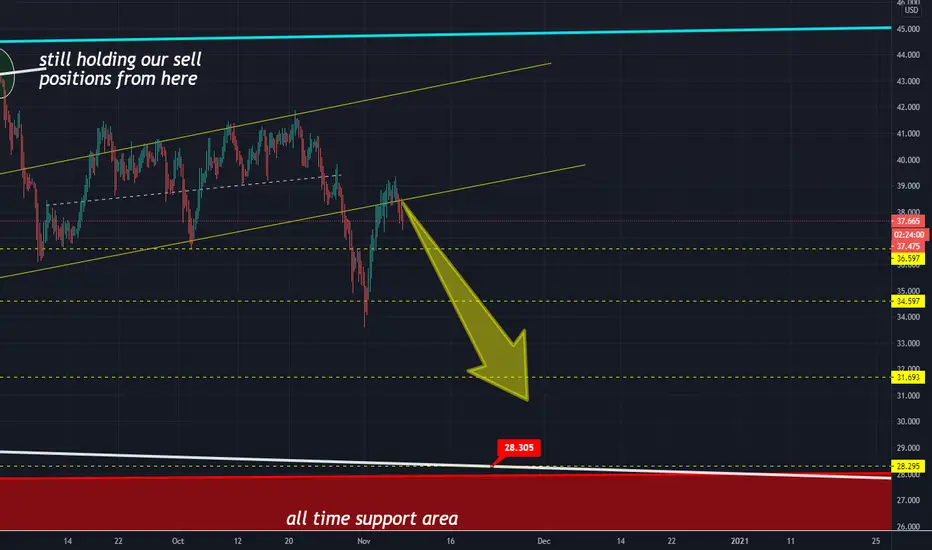
OIL Updated - We keep on SellingFurther to yesterday's idea, price has dropped at resistance and dropping :
Already in profits and managing our positions accordingly. Closing our 3 Buy positions and also closing 3 of our sell positions.
4 sell positions in profits and remaining open. 1 is cashed out so profit guaranteed, 3 open with take profit levels at 36.60, 34,60 and 31,70.
VICTORY
yesterday:
Our technical analysis on Oil with the major key price levels.
Fundamentally and technically we see a drop , sooner or later, below 30 usd
At this stage there is a 60% drop , or a 40% rise to 42.50 resistance and a possible drop from there at 90% (10% only to break that level)
HOW WE TRADE THIS:
We have SELL and BUY positions at a rate of 7 (buy) to 3 (sell) (70%-30%)
If the price drops then we have a profit from 40% of the positions
If the price rises we will close all BUY positions at the major resistance of 42.5usd and hold our SELL positions for a drop back to where the price is now and the key take profit levels of 36.60, 34.60 , 31.70 and even the all time support of 30$ and 28.50$.
If all goes well we will consider Buying again at that level.
Take a look at how we perfectly sold in September s idea predicting perfectly the beginning of the drop ,
our tutorial on Oil analysis

OIL SHORT AS NORMALOil scalp following same process, as numerous previous. look to enter short on ,ower timeframe.

Our success on oil - and what's nexton Sep 2 we poted this idea :
Oil about to drop back to 30 usd
Well.. we are almost there. I guess we were right

WTI OIL Buy SignalPattern: Channel Down on 4H.
Signal: Buy as the current bearish leg is forming a sequence similar to the September 01 - 14 leg = Death Cross, followed by a Triangle bottom. The signal is invalidated if the Channel breaks the Lower Low trend-line.
Target: The 4H MA200.
Please like, subscribe and share your ideas and charts with the community!
--------------------------------------------------------------------------------------------------------
!! Donations via TradingView coins also help me a great deal at posting more free trading content and signals here !!
🎉 👍 Shout-out to TradingShot's 💰 top TradingView Coin donor 💰 this week ==> TradingView
--------------------------------------------------------------------------------------------------------

OIL WEEKLYOil looks primed to sell off on higher timeframes. as you can see the market structure in place with bearish divergence.

15M scalp oillooks like a wedge being formed, we are in a downtrend and we have got a bearish rvi cross, good time to short.

WTI - USOIL Top Down AnalysisHello Traders,
Here is the Top-Down Analysis of WTI - USOIL (Monthly, Weekly, Daily for direction and 4H for entry) for
Week 42 - 12 Oct
M > Market reached monthly resistance and faced rejection. After a massive jump we expect a correction, till 0.38 Fib level at least, before market continues with the trend. Price has yet to show this correction.
W > We have marked a target of 0.382 Fib level on last weekly impulse as target for correction. We can also see a W pattern and expect price to drop test its neck which is below our target of 0.382 Level.
D > Price decelerated while approaching the resistance level, price dropped creating a support that has now been tested twice. Hence we can take support as another bearish target. After creation of support price is ranging with well respected resistance and support levels.
4H > We can see a W formation and price should drop to test its neck. Price has currently tested resistance level and dropping after rejection. Price is now testing supply zone, we expect drop in price till Target 1.
This was my Idea and I hope you find it useful. If you find the analysis of help please leave a LIKE and FOLLOW for receiving all updates during the week. In the comment section share your view or ask questions.
Thank You
AP17FX


Us crude Oil ( WTIUSD) ANALYSIS 27 OCT 2020Hi Assalam-o-Alaikum , Dear GooD Afternoon Hope you are well and enjoing your trading , i'm here with my new analysis of WTIUSD
US Crude Oil (WTIUSD ) Current price is 3921.7
Current Resistence level is 3927.4
Current Support level is 3843.3
If Market Breaksout the Resistence level and Close on above this level we can enter in Buy Trade as Case 1 in Chart , Alternatively if Market Breaksout the Support level we can enter in sell here as case 2 in Chart
I hope my analysis will help you in your trading best of luck
share your point of view about WTIUSD in comments , Thanks

WTI- Sell rallies above 40From the beginning of September, WTI is trading in a range between 36 support and 41.50 resistance.
At this point, Oil is trading on the upper side of the range and we have a nice opportunity to enter short for a 400 pips profit target.
In my opinion prices above 40 should be sold and only a daily close above 42 would change my bearish opinion

OIL WEEKLYOil looks primed to sell off on higher timeframes. as you can see the market structure in place with bearish divergence.

good time to short oil on lower timeframePullback may be over and ready for downwards impulsive move. price pull back to channel and looks like a double rejection of this level

WTICOUSD before 15% decrease.WTICOUSD before 15% decrease. WTICOUSD has been falling below the 50% level of D1 ATR for several days. In my analysis, I assume that the graph moves south from the accumulation range. In this case, a double descending wave structure may form. Now we can see the construction of the second declining wave. In case my interpretation is correct, the target price of the decreasing motion is 33.49usd.

USOIL to retest $40Crude Oil - Intraday - We look to Sell
Price action has continued to range within a triangle formation.
Trend line resistance is located at 40.92
Further downside is expected although we prefer to set shorts at our bespoke resistance levels at 40.91, resulting in improved risk/reward. Preferred trade is to sell into rallies.
Our profit targets will be 39.99 and 39.50
Resistance: 41.43 / 41.72 / 42.65
Support: 40.33 / 39.50 / 38.90
