USOil WTI Technical Analysis and Trade Idea👀👉 US Oil has encountered recent selling pressure, which may present an opportunity for short-term traders. In this video, we’ll analyze the price action, evaluate the current trend and market structure, and explore potential sell setups if the price action unfolds as outlined. Risk Disclaimer: Forex trading involves significant risks, and market conditions can change unexpectedly. This content is for educational purposes only and is not financial advice. 📉✅
Wtioil

WTI CRUDE OIL: 1H Death Cross suggests another Low is coming.WTI Crude Oil is bearish on its 1D technical outlook (RSI = 42.281, MACD = -0.560, ADX = 26.062) with the bearish bias evident as in the last 3 weeks the price is trading inside a Channel Down. The formation of a 1H Death Cross earlier today, draws comparisons with the October 15th one. Both price actions found a temporary support on the 1.382 Fibonacci level at the time of the Death Cross but the 1H RSI was rebounding on a bullish divergence. We expect the price to extend replicating that bearish wave and approach the 1.618 Fib eventually (TP = 66.00).
## If you like our free content follow our profile to get more daily ideas. ##
## Comments and likes are greatly appreciated. ##

WTI OIL Higher Lows held. Strong rebound is expected.WTI Oil (USOIL) is about to complete an Inverse Head and Shoulders (IH&S) pattern whose Head was right above the Higher Lows trend-line.
An imminent break above the 4H MA50 (blue trend-line) will confirm the start of the new Bullish Leg towards the Resistance Zone. Our Target remains 78.50.
Notice how the 4H RSI has already broken above its Lower Highs trend-line, as it did on the September 09 break-out.
-------------------------------------------------------------------------------
** Please LIKE 👍, FOLLOW ✅, SHARE 🙌 and COMMENT ✍ if you enjoy this idea! Also share your ideas and charts in the comments section below! This is best way to keep it relevant, support us, keep the content here free and allow the idea to reach as many people as possible. **
-------------------------------------------------------------------------------
💸💸💸💸💸💸
👇 👇 👇 👇 👇 👇

Crude Oil BearishCrude oil technical analysis
Daily resistance 75, support 65
Four-hour resistance 71.8, support 68
Crude oil operation suggestions: From the current market analysis, continue to short near the upper 71.8 mark today, the upper pressure is near 75, the lower support is 69 and 65. The overall support within the day is to maintain the cycle of selling high and buying low in this range, and wait patiently for the key points to enter the market.
SELL:71.8near
BUY: 68near
Technical analysis only provides trading direction!

USOIL "WTI crude oil" Market Money Heist Plan on Bullish Side.Bonjour! My Dear Robbers / Money Makers & Losers, 🤑 💰
This is our master plan to Heist USOIL "WTI crude oil" Market based on Thief Trading style Technical Analysis.. kindly please follow the plan I have mentioned in the chart focus on Long entry. Our target is Red Zone that is High risk Dangerous level, market is overbought / Consolidation / Trend Reversal / Trap at the level Bearish Robbers / Traders gain the strength. Be safe and be careful and Be rich.
Entry : Can be taken Anywhere, What I suggest you to Place Buy Limit Orders in 15mins Timeframe Recent / Nearest Swing Low
Stop Loss 🛑 : Recent Swing Low using 2H timeframe
Attention for Scalpers : If you've got a lot of money you can get out right away otherwise you can join with a swing trade robbers and continue the heist plan, Use Trailing SL to protect our money 💰.
Warning : Fundamental Analysis news 📰 🗞️ comes against our robbery plan. our plan will be ruined smash the Stop Loss. Don't Enter the market at the news update.
Loot and escape on the target 🎯 Swing Traders Plz Book the partial sum of money and wait for next breakout of dynamic level / Order block, Once it is cleared we can continue our heist plan to next new target.
Support our Robbery plan we can easily make money & take money 💰💵 Follow, Like & Share with your friends and Lovers. Make our Robbery Team Very Strong Join Ur hands with US. Loot Everything in this market everyday make money easily with Thief Trading Style.
Stay tuned with me and see you again with another Heist Plan..... 🫂

CRUDE OIL (WTI) Classic Gap Opening Trade
I see a nice example of a gap down opening on WTI Crude Oil.
As always, there is a high chance that the gap will be filled.
I already see some sign of strength of the buyers:
a double bottom pattern on 30 minutes time frame.
I think that the price will reach 75.3 level soon.
❤️Please, support my work with like, thank you!❤️

WTI CRUDE OIL: Turned bullish again after the 1D MA50 rebound.WTI Crude Oil turned bullish again on its 1D technical outlook (RSI = 59.281, MACD = 0.570, ADX = 33.404) as even though it breached through the 1D MA50 yesterday intraday, it managed to close the day over it and extend today with a green candle. It was not ideal that the rejection on Tuesday took place on the 1D MA200 but yesterday's 1D MA50 rebound has restored the bullish sentiment. We turn bullish again (TP = 80.00) all the way to the one year LH trendline and the 0.786 Fib.
See how our prior idea has worked out:
## If you like our free content follow our profile to get more daily ideas. ##
## Comments and likes are greatly appreciated. ##

USOIL Short - You're Too BullishMajor HTF Levels awaiting you at the swing high while majority is long. What could go wrong?

WTI OIL📊 #WTIUSD
⏱ TIME: 1H
📝Important oil ranges for this week
⭕️risk: mid
📍The initial buying limit: 72$ and 69.7$

WTI CRUDE OIL: Sets course for $80WTI Crude Oil is bullish on its 1D technical outlook (RSI = 59.800, MACD = -0.360, ADX = 28.602) as it crossed over the LH trendline of the Bearish Megaphone. After a 4H RSI bottom formation, the 4H MA50 and MA200 are about to form a Golden Cross, the first since June 18th that caused a rally continuation to the 0.786 Fibonacci level. That is where the August 12th LH is and that is our target (TP = 80.00).
See how our prior idea has worked out:
## If you like our free content follow our profile to get more daily ideas. ##
## Comments and likes are greatly appreciated. ##

NEW IDEA FOR WTIFrom a technical point of view, WTI crude oil has broken the resistance range of the ceiling of the descending channel to the top, and therefore, there is a possibility of further price increase.
In general, this scenario is reinforced that WTI crude oil can reach the resistance of the previous ceiling in the range of 77.67 provided that no one-hour close candle time is recorded below the important support interval in the range of 70.00-68.71. The dollar will increase in price.

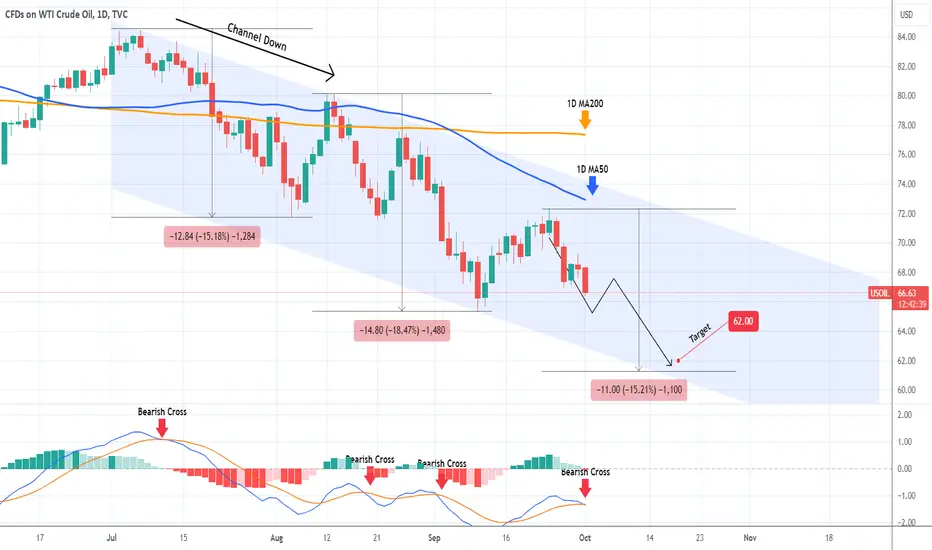
WTI OIL Channel Down prevailed. Lower Low expected.WTI Oil (USOIL) eventually failed to recover the 1D MA50 (blue trend-line), which has been the Resistance since August 13, and reversed the short-term rebound. The 3-month Channel Down appears to have prevailed and technically is now looking for its third Lower Low.
The previous two declined by -18.47% and -15.18% respectively, so roughly we same % drop. As the 1D MACD formed a Bearish Cross today, we can claim that we have the necessary confirmation for a Bearish Leg that at best, we are half-way on it.
Assuming the minimum drop of -15.18%, we expect to see at least $62.00 before this Leg prices the Lower Low.
-------------------------------------------------------------------------------
** Please LIKE 👍, FOLLOW ✅, SHARE 🙌 and COMMENT ✍ if you enjoy this idea! Also share your ideas and charts in the comments section below! This is best way to keep it relevant, support us, keep the content here free and allow the idea to reach as many people as possible. **
-------------------------------------------------------------------------------
💸💸💸💸💸💸
👇 👇 👇 👇 👇 👇
Fundamental factors have the main impact on the WTI trendTVC:USOIL ended up slightly higher last Friday but fell more than 3% for the week as markets gauged expectations for increased global supply and considered new stimulus measures from major countries in Asia, which import leading crude oil exporter.
- On one hand, OPEC+ plans to start increasing production in December, which has been particularly suppressive on oil prices and was the main negative factor for the oil market last week.
- On the other hand, the withdrawal of many stimulus policies by major powers, expectations that the Federal Reserve will cut interest rates further and the escalating conflict in the Middle East still provide some support for oil prices.
Central banks of major Asian countries cut reserve requirements and interest rates last Friday, and governments of major Asian countries are launching a final round of stimulus to boost growth. The economy returns to the target of about 5% this year.
Israel said it bombed Houthi rebel targets in Yemen on Sunday (September 29) and continued airstrikes in Lebanon, expanding its alliance with Iran in the region two days after killing the leader of Hezbollah. Sayyed Hassan Nasrallah during the confrontation.
On the daily chart, TVC:USOIL Currently trading quite stable after recovering from the support level of 67.26USD. Note to readers in the previous issue. The recovery momentum is also being limited by the 0.236% Fibonacci retracement level and the horizontal resistance level of 69.31USD.
However, looking at the overall technical picture, WTI crude oil is having more bearish conditions with the main trend from the price channel, pressure from EMA21 and weak recovery momentum when the RSI Strength Index turns down. price reduction signal.
In the near term, if WTI crude oil continues to be sold below the important technical level at 67.26USD it is likely to continue to decline more with a target level of 65.25USD. Even if WTI crude oil recovers further, it will still be limited by the EMA21, the 0.382% Fibonacci retracement level and the upper edge of the price channel.
The bearish trend in WTI crude oil dominates the daily technical chart, and notable technical levels are listed below.
Support: 67.26USD
Resistance: 68.74 – 69.31USD

OIL Long - Up & DownMajority is still long however turning slowly into bull mode. We peaked some liquidity spot on the past so I expect some movement up before further declining.

CRUDE OIL (WTI): Bearish Move From Confluence Zone
WTI Crude Oil tested a significant confluence zone yesterday.
That zone is based on a recently broken daily horizontal resistance
and a falling trend line.
Probabilities will be high that the price will drop from that area.
First goal - 70.45
❤️Please, support my work with like, thank you!❤️

US OIL / WTI Bullish Money Heist Plan on Long SideHola ola My Dear,
Robbers / Money Makers & Losers,
This is our master plan to Heist US OIL / WTI based on Thief Trading style Technical Analysis.. kindly please follow the plan I have mentioned in the chart focus on Long entry. Our target is Red Zone that is High risk Dangerous level, market is overbought / Consolidation / Trend Reversal at the level Bearish Robbers / Traders gain the strength. Be safe and be careful and Be rich.
Attention for Scalpers : If you've got a lot of money you can get out right away otherwise you can join with a swing trade robbers and continue the heist plan, Use Trailing SL to protect our money.
Note: If you've got a lot of money you can get out right away otherwise you can join with a swing trade robbers and continue the heist plan, Use Trailing SL to protect our money.
Entry : Can be taken Anywhere, What I suggest you to Place Buy Limit Orders in 15mins Timeframe Recent / Nearest Swing Low
Stop Loss : Recent Swing Low using 1H timeframe
Warning : Fundamental Analysis comes against our robbery plan. our plan will be ruined smash the Stop Loss. Don't Enter the market at the news update.
Loot and escape on the target 🎯 Swing Traders Plz Book the partial sum of money and wait for next breakout of dynamic level / Order block, Once it is cleared we can continue our heist plan to next new target.
Support our Robbery plan we can easily make money & take money 💰💵 Follow, Like & Share with your friends and Lovers. Make our Robbery Team Very Strong Join Ur hands with US. Loot Everything in this market everyday make money easily with Thief Trading Style.
Stay tuned with me and see you again with another Heist Plan.....

US OIL / WTI Bullish Money Heist Plan on Long SideHola ola My Dear,
Robbers / Money Makers & Losers,
This is our master plan to Heist US OIL / WTI based on Thief Trading style Technical Analysis.. kindly please follow the plan I have mentioned in the chart focus on Long entry. Our target is Red Zone that is High risk Dangerous level, market is overbought / Consolidation / Trend Reversal at the level Bearish Robbers / Traders gain the strength. Be safe and be careful and Be rich.
Attention for Scalpers : If you've got a lot of money you can get out right away otherwise you can join with a swing trade robbers and continue the heist plan, Use Trailing SL to protect our money.
Note: If you've got a lot of money you can get out right away otherwise you can join with a swing trade robbers and continue the heist plan, Use Trailing SL to protect our money.
Entry : Can be taken Anywhere, What I suggest you to Place Buy Limit Orders in 15mins Timeframe Recent / Nearest Swing Low
Stop Loss : Recent Swing Low using 30m timeframe
Warning : Fundamental Analysis comes against our robbery plan. our plan will be ruined smash the Stop Loss. Don't Enter the market at the news update.
Loot and escape on the target 🎯 Swing Traders Plz Book the partial sum of money and wait for next breakout of dynamic level / Order block, Once it is cleared we can continue our heist plan to next new target.
Support our Robbery plan we can easily make money & take money 💰💵 Follow, Like & Share with your friends and Lovers. Make our Robbery Team Very Strong Join Ur hands with US. Loot Everything in this market everyday make money easily with Thief Trading Style.

WTI OIL📊 #XTIUSD
⏱ TIME: 1w
📝The price has dropped a lot, there is an important range ahead, $63 (blue box), it seems that it can have an upward movement from this range.
⭕️risk: high
📍buyzone: 64.30 - 62.11$
📌TP1: 72 $
📌TP2: 77 $
⛔️: If this range is lost, the analysis will fail and I will update the analysis

WTI OIL giving a buy signal under this condition.Last week we saw how WTI Oil (USOIL) turned bearish long-term following the 1W Death Cross and the breaking below the 16-month Higher Lows trend-line. Even on the 1D time-frame we got a Death Cross formation with the price seemingly reaching the bottom (Lower Lows trend-line) of a newly formed Channel Down.
As a result we may have a short-term buy signal but only if today's 1D candle closes in green, which together with yesterday will make it a series of green days. As you can see on the chart, every time the 1D RSI posted a Bullish Divergence (rising while Oil was falling), it posted successive 1D green candles to confirm a rebound.
So the key now is to form again a streak (even 2) of green days. If not, the buy potential is invalidated. If successful though, we will target 78.00 (top of the Channel Down, +16.55% rise as the previous Bullish Leg).
-------------------------------------------------------------------------------
** Please LIKE 👍, FOLLOW ✅, SHARE 🙌 and COMMENT ✍ if you enjoy this idea! Also share your ideas and charts in the comments section below! This is best way to keep it relevant, support us, keep the content here free and allow the idea to reach as many people as possible. **
-------------------------------------------------------------------------------
💸💸💸💸💸💸
👇 👇 👇 👇 👇 👇

Bears wade into crude oil futures: CL1!An influx of short bets against WTI crude oil futures is behind the recent leg lower for oil prices. But having already fallen nearly 14% over eight days, bears may want to tread carefully with a fresh catalyst. Matt Simpson takes a look at the weekly, daily and 4-hour chart alongside large speculative positioning.

BRENT Crude Oil Bullish robbery PlanMy Dear Robbers / Money Makers & Newbies,
This is our master plan to Heist BRENT Crude Oil based on Thief Trading style Technical Analysis.. kindly please follow the plan I have mentioned in the chart focus on Long entry. Our target is Red Zone that is High risk Dangerous level, market is overbought / Consolidation / Trend Reversal at the level Bearish Robbers / Traders gain the strength. Be safe and be careful and Be rich.
Note: If you've got a lot of money you can get out right away otherwise you can join with a swing trade robbers and continue the heist plan, Use Trailing SL to protect our money.
Entry : Can be taken Anywhere, What I suggest you to Place Buy Limit Orders in 15mins Timeframe Recent / Nearest Swing Low
Stop Loss : Recent Swing Low using 2h timeframe
Warning : Fundamental Analysis comes against our robbery plan. our plan will be ruined smash the Stop Loss. Don't Enter the market at the news update.
Loot and escape on the target 🎯 Swing Traders Plz Book the partial sum of money and wait for next breakout of dynamic level / Order block, Once it is cleared we can continue our heist plan to next new target.
Support our Robbery plan we can easily make money & take money 💰💵 Follow, Like & Share with your friends and Lovers. Make our Robbery Team Very Strong Join Ur hands with US. Loot Everything in this market everyday make money easily with Thief Trading Style.

BRENT Crude Oil Robbery Plan on Bullish DirectionMy Dear Robbers / Traders,
This is our master plan to Heist BRENT Crude Oil based on Thief Trading style Technical Analysis.. kindly please follow the plan I have mentioned in the chart focus on Long entry. Our target is Red Zone that is High risk Dangerous level, market is overbought / Consolidation / Trend Reversal at the level Bearish Robbers / Traders gain the strength. Be safe and be careful and Be rich.
Note: If you've got a lot of money you can get out right away otherwise you can join with a swing trade robbers and continue the heist plan, Use Trailing SL to protect our money.
Entry : Can be taken Anywhere, What I suggest you to Place Buy Limit Orders in 15mins Timeframe Recent / Nearest Swing Low
Stop Loss : Recent Swing Low using 2h timeframe
Warning : Fundamental Analysis comes against our robbery plan. our plan will be ruined smash the Stop Loss. Don't Enter the market at the news update.
Loot and escape on the target 🎯 Swing Traders Plz Book the partial sum of money and wait for next breakout of dynamic level / Order block, Once it is cleared we can continue our heist plan to next new target.
Support our Robbery plan we can easily make money & take money 💰💵 Follow, Like & Share with your friends and Lovers. Make our Robbery Team Very Strong Join Ur hands with US. Loot Everything in this market everyday make money easily with Thief Trading Style

WTI OIL This is why it's going to $95.00 if the 1M MA50 helps.WTI Crude Oil (USOIL) has been practically neutral within a Triangle pattern since September 2023, trading under the Resistance pressure of the Lower Highs but at the same time supported by a Higher Lows trend-line. The latter has been placed just below the 1M MA50 (blue trend-line), which is the key to Oil's price action in the coming months.
As you can see, even when the price breaks below it, Oil manages to close the 1M candle (month) above the 1M MA50. In fact the last time it closed a month below it was more than 3.5 years ago (January 2021)!
As a result, if we manage to close August above it again, we expect a strong rebound for Oil. In fact, a similar Triangle pattern was spotted back in 2011 - 2013. As you can see, after several breakings but also closings above the 1M MA50, it eventually initiated a rally that hit the Resistance 2 level.
The 1M RSI sequences among the two fractals are similar as well, so we find no reason why Oil won't stage a similar rally as long as the 1M MA50 keeps holding. Our long-term Target is $95.00.
-------------------------------------------------------------------------------
** Please LIKE 👍, FOLLOW ✅, SHARE 🙌 and COMMENT ✍ if you enjoy this idea! Also share your ideas and charts in the comments section below! This is best way to keep it relevant, support us, keep the content here free and allow the idea to reach as many people as possible. **
-------------------------------------------------------------------------------
💸💸💸💸💸💸
👇 👇 👇 👇 👇 👇
