WTI Buy?Ich schließe nicht aus das WTI weiter fällt,
jedoch sehe ich auch eine Seitwärtsphase und wir befinden uns am Allzeittief.
Deshalb sehe ich auch den Buy versuch in Richtung der Trendline als durchaus valide.
Wtioil

Bret Oil- towards 35-36 zone?While WTI OIL is making new lows, Bret OIL stopped its descend and is consolidating in the 28 old resistance area.
I believe next week will be one of gains for both WTI and Bret and I'm looking to buy Bret OIL for a retest of 35-36 resistance.
Also, a buy trade can have a comfortable 1:3 risk: reward ratio.

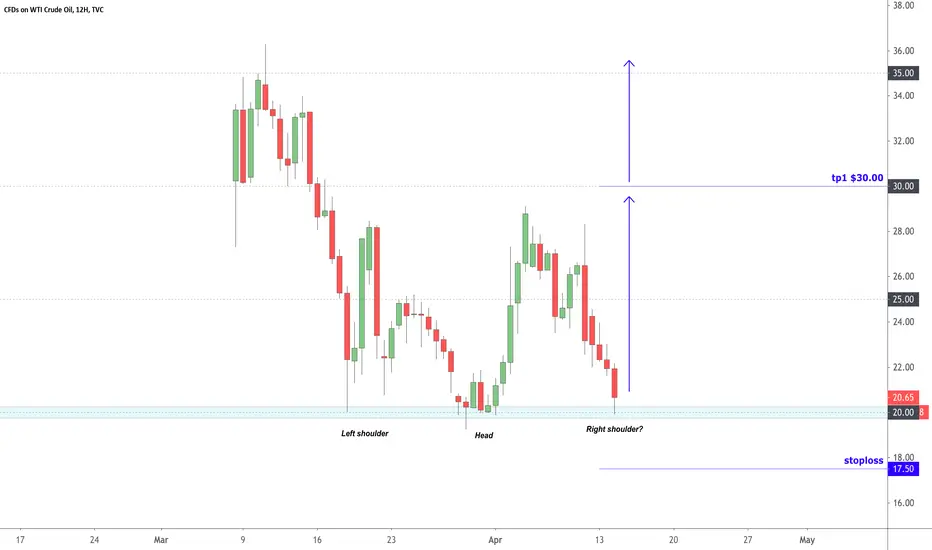
OIL Break 20$ Support and NEXT 17.89$ FOR LONG.Many Reasons behind Oil continues dropping After OPEC cut Production.
1- Oil should stay above 20$ after Deal Cut, but look like price war still going on.
2-Demand is very low at the moment all over the country because of lockdown and Economy under the shutdown.
Coming weeks expecting Oil will do big correction upside end of April to mid-May, but before correction Oil could hit support level 2001 Year 16.90 to 17.26$
Good to long entry 18$ as major support level
🛑SUPPORT/RESISTANCE
✅S1= 17.25
✅S2=16.10
✴️R1=20.50
✴️R2=24.10
Please like, share, comments and follow me to get daily base analysis
Thank you for your support, I appreciate it.

WTI Oil: Buy opportunity short term. Scenarios moving forward.Oil is trading sideways on the 1H chart (RSI = 47.613, MACD = -0.080, ADX = 28.589) as it is consolidating on the 19.20 Support. The MACD on the 4H chart just made a bullish cross and if the sequence of March 31 is repeated then we can have a rebound towards the 29.20 Resistance. That would however break the 4H MA200 (orange trend line) which hasn't been testes since January 10th and if broken would be a sign of stabilization and recovery for the market. So until then it is best to target the Lower High trend line of the Descending Triangle.
** If you like our free content follow our profile (www.tradingview.com) to get more daily ideas. **
Comments and likes are greatly appreciated.

USOIL Trade Update + Risk Range - 12:37:09 (UTC) Tue Apr 14,2020USOIL Trade Update + Risk Range -
12:37:09 (UTC) Tue Apr 14,2020

WTI TA & FA, targets explained.. - Epic RR 19:57:19 (UTC) Considering adding at these levels to an existing long position. I don't think that the teens will be met. I think $20/bbl will hold. If it doesn't, then it is manipulation of price virtually, as here in Texas the Permian basin is solid and in fine shape compared to Canadian heavy barley getting 4$ bids. I see this is more of a fundamental investment rather than a swing trade at this point. Proper risk management is always applied, with a per risk trade of 2% max; negating a failed account in the long-run of a thousand trades.
Bullish arguments: include cuts from open assuring a $20 spot market. Cuts from OPEC+ and other producers mean that a unilateral bottom has been agreed on.
Suppliers control this market with the flip of a switch (lertaly). My target for May of this year is $41/bbl. The drop in demand has been forced. Fundamentally, anyone who's traded in a market with forced demand/supply knows how to handle this.
Bearish argument:
Slow down in demand.. obvious. The suppression is forced, and those that weren't leveraged and had good cash flow going into the year with adequate solvency are fine. It's the ones that were desperate for gain that want to see Oil to 0$. Of course, it already has been trading negative in parts of the world that don't have the infrastructure to maintain profit with these prices.
According to my source 4$/bbl in Canada is enough to break-even. While firing and downsizing. The infrastructure for heavy crude in Canada is expensive and can't just be towed off of the lot like it can here in Texas. Bears shouldn't be worried about WTI, they should be looking at Brent and heavy Canadian.
19:59:32 (UTC)
Tue Apr 14, 2020
WTI looks very weak hereIt's one of the most popular commodities to trade nowadays due to the crazy volatility
Right now the OIL is having a big sell off
Probably will continue dumping until the 20s level which is an important demand zone

WTI OutlookAfter an extremely volatile week, WTI found support in 22 zone and the price is consolidating now.
I believe this support will hold and a new wave of gains are coming for WTI oil.
A clear confirmation comes in with a break of 23 confluence resistance and the price could rise to at least 25 zone

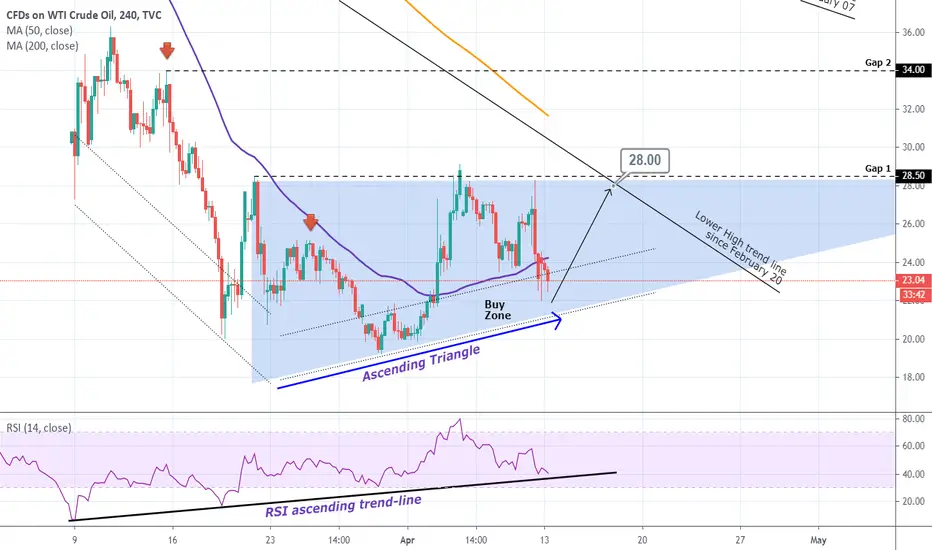
USOIL Buy SignalPattern: Ascending Triangle on 4H.
Signal: Bullish as the price has entered the Buy Zone and the RSI has been ascending since March 9.
Target: 28.00 (contact with the Lower High trend-line since February 20.
USOIL Short Entry Update (+375 pips) Update on the short entry I took last week and posted on the channel. Currently floating +353 pips and I've closed 50% of my original position and am floating in profit with stoploss above breakeven for a risk-free trade. The geopolitics between SA, US, and Russia will be a dynamic that will move the price quickly this week so staying protected at all times will be key.
07:03:28 (UTC)
Mon Apr 13, 2020


WTI outlookWTI price exploded yesterday, again...
Price has risen almost 10% in a matter of minutes and close NY session both above the trend line and horizontal resistance.
Now the price is in a small correction and may continue to rise towards at least 27
Looking to buy around 25.40-25.50 zone

USOIL Short Entry (+282 pips) 06:47:22 (UTC) Wed Apr 8, 2020USOIL Short Entry (+282 pips) 06:47:22 (UTC) Wed Apr 8, 2020


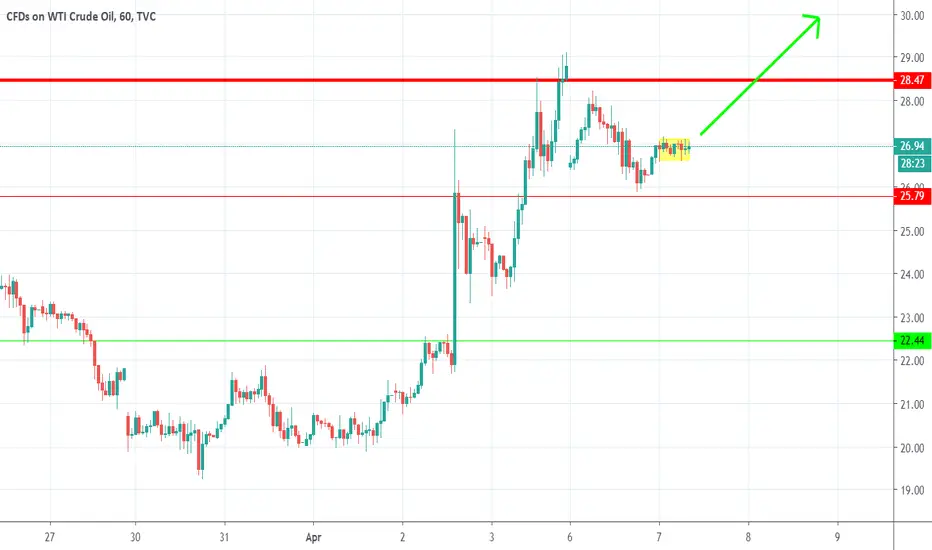
Oil- ready to explode again?- updateIn the morning I wrote that OIL could reach 30 this week...
As we can see from the chart, the correction seems to be over and the price is consolidating in a very narrow range.
A break of 27.20 would accelerate gains and we can see it reach 30 sooner rather than later.
This scenario is valid as long as the price stays above 26
WTI- a new challenge of 30 resistance?Yesterday Oil corrected the previous leg up move and found support just under 26 zone.
The price is bullish for now and the correction could continue and price can challenge 30 zone this week

WTI Crude Oil: Channel Up on 4H aiming 30.00.Oil appears to be trading within a Channel Up formation on the 4H chart (RSI = 62.702, MACD = 1.460, ADX = 28.496, CCI = 59.3622) having so far made two Higher Highs and one Higher Low.
Since the MACD is about to make a Bear Cross, we are expecting the price to pull back now for its 2nd Higher Low and make contact with the 4H MA50 (blue trend line). Our Target Zone is 30.00 - 32.00 which is where we expect to price its 3rd Higher High and make contact with the 4H MA200 (orange line).
** If you like our free content follow our profile (www.tradingview.com) to get more daily ideas. **
Comments and likes are greatly appreciated.


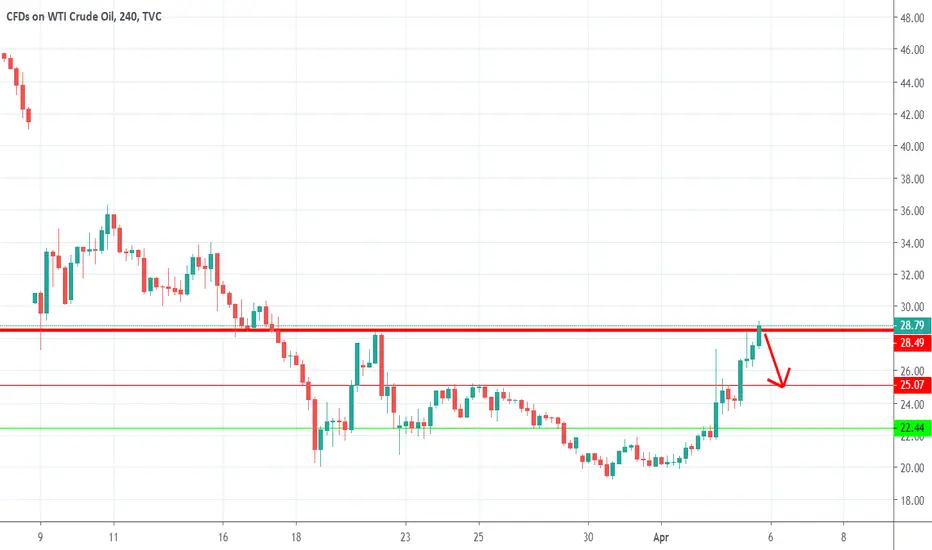
Wti- 30, a good place to sellWTI had a very good run last week, with the price gaining around 40%. Now Oil is facing strong resistance in the 30's area and I believe the price will drop in the next few days.
Looking to sell for a drop to 25 zone.
USO (oil) is gonna start recovering very soon. Time for longsUSO
USOIL
I expect great recovery as OPEC have to agree on terms of flow and price of oil.
It's great investment now with minimum leverage (max 1:5)
Invest/Trade with proper risk management.

WTI- Bullish above 23Yesterday, the price of WTI skyrocket more than 20% at some point. As normal, the price corrected and settled.
I anticipate a next leg up for OIL that can drive the price to 27 zone and even close to 30.
As long as the price stays above 23 zone the structure is bullish
