Wtioil


Position ChangedDue to the agreement that US wants to reach with Saudi and Russia, I think crude oil is prepared to rebound. Target price labelled in the chart.

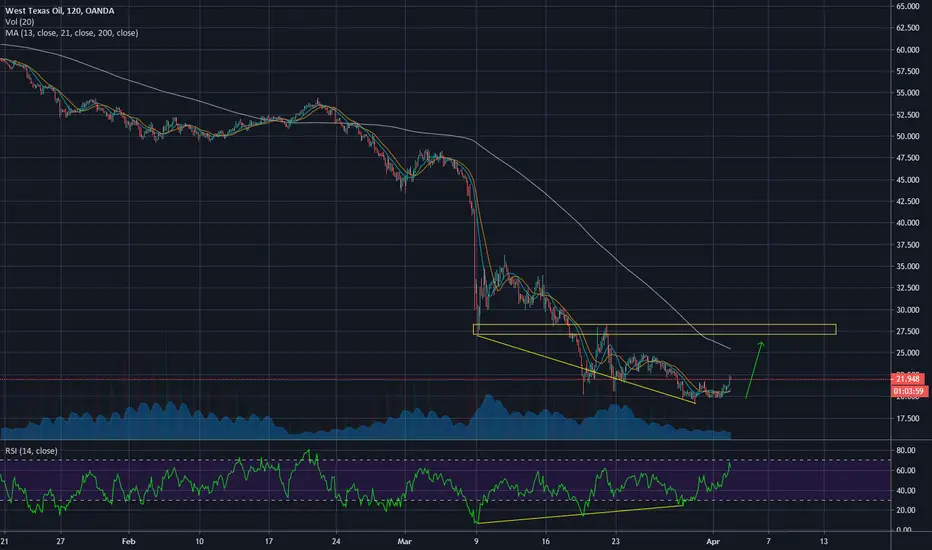
WTI- Another run to challange 30?WTI seems to have found a bottom in the 20's zone. The price is consolidating now and a break of 22.50 could drive price towards 30.
Interim resistance is 25

USOIL IS FORMING DOUBLE BOTTOM WAITTING TO BUY USOIL IS FORMING DOUBLE BOTTOM WAITTING TO BUY THIS PAIR, AND AS WE KNOW USA AND RUSSIA AND SAUDI ARABIA AGREED TO MAKE THE PRICE HIGH.

Bearish USOILAs shown in the graph. I don't think oil has reached a bottom yet. More downside awaiting.

USOIL Buy SignalPattern: Fibonacci retracement
Signal: Bullish as the price made a bullish cross on the MACD and the whole pattern is similar to the previous sequence that topped on the 0.618 Fibonacci.
Target: 22.80 (just below the 0.618 Fibonacci retracement).

WTI Oil: Close to a MACD bullish reversal. Bottom may be close.The MACD on the 1D chart, which remains vastly oversold (RSI = 25.205, ADX = 68.790, CCI = -108.7025), is close to making a bullish reversal. If successful it will be the first time since February 26th.
This is quite similar to the 2018 sharp sell-off, when Oil recovered on the 2nd MACD bullish cross (since the decline started). During that sequence the price bottomed on the -0.236 Fibonacci level, almost exactly when the 2nd MACD bullish cross took place.
At the moment we are almost on the -0.236 Fibonacci level and about to make the bullish cross. This can be an early indication of finally finding a bottom, and if that's the case Oil's target next month or two should be 33.00.
** If you like our free content follow our profile (www.tradingview.com) to get more daily ideas. **
Comments and likes are greatly appreciated.

Gloomy outlook for WTI oilHi everyone:
I know yall heard about the "strategic reserve" US government wants, but I think WTI oil can fall further despite cutting supplies or receiving aids from the government. The problem is from the demand side, which is driven by this coronavirus. Back to the chart, you can see the red parallel range, which states the upsides and downsides of WTI oil. I think it's currently at the 4th wave, meaning I am expecting a further drop later on. Most things are labelled in chart, and feel free to ask me any question.
Have a good weekend.

US Crude Oil. Time to go long!? FakeoutAnother nice breakout fakeout trade here from the breakout fakeout master ; But how high will it go???
As with the parallel dow trade (see other post) breakouts rarely work. Its nearly always best to see that conditions are overbought or oversold and trade accordingly.
The only problem is that I really need to sort out this telegram channel... I'm a high margin trader and so by the time I've posted a trade here for you folks I'm already in a trade and taken lots of profits off the table. That's the best way to trade these fakeouts hit the re-entry on a high margin account with a very fast move into profit, take that and look for a re-entry. There is still though room for profits in this trade. I just trade these fakeouts with swing trades. I will be trading each swing of the 5min and 1 min chart with lots of leverage, moving more to 5 min swings if and as the pattern gets bigger.
Very profitable.
If the low gets taken out no harm lots of profits have already been banked

WTI Oil: Must hold 20.00 otherwise risks drop to 13.50.A very bearish pattern is emerging on Oil as if the 20.00 Support fails we may see another sharp fall as the one last week. In March 17th the price broke the Support and Oil collapsed to the 1.786 Fibonacci extension. If the 20.00 Support doesn't hold we may see sellers accumulating causing another flash crash to the 1.786 which in this case is at 13.50. The MACD sequence between the two fractals is identical as you see on the chart.
If on the other hand, the 20.00 Support is defended and the price breaks the 4H MA50 (blue line on the chart), then that will be a strong bullish reversal signal as it will be the first time Oil would touch it since February 24th. In that case we will target the 28.50 Resistance.
** If you like our free content follow our profile (www.tradingview.com) to get more daily ideas. **
Comments and likes are greatly appreciated.

OIL going to Retest 22.05Oil is been rejected from resistance line at $28, now oil will retest the $22,
is a double bottom, so let's see how interact with the support line.
It could be a potential breakout to the downside.
MACD and SRSI pointing down.
Also oil price could be affected by the news, so please be careful and also use SL, especially when you use leverage.
also your risk/reward is higher near the support/resistance lines (key levels)
Push like when this idea useful to you!
Leave a comment below!
Legal disclaimer: I am not a financial advisor.
You trade at your own risk and nobody can guarantee you results.

ridethepig | Oil Market Commentary 2020.03.20You can smell the struggle for buyers in the air, the retrace should first be faded at the next technical breakdown as smart money insists on elimination of the base. After the attack, we can start to look at forming a new base, rinse and repeat! If you wish to undermine construction, you naturally will not make it in this game and likely not as an architect either.
Example, after the OPEC desperation leg :
The ornamentation would naturally follow automatically. After Russia showed signs of buckling on the supply side there was a lot of panic covering from the soft hands. Buyers played somewhat naively, as though the Saudi's would not see this and play something like a break towards $15!
That is the logical way for things to develop here. Smelling another test of the lows as early as next week... Very simple. Try to take on the first breakdown, if we deliver a powerful blow then run with momentum for the lows. And always start with the big chief!
Thanks as usual for keeping the likes and comments rolling!

WTI Oil: Rising Wedge towards 24.40.The bounce on yesterday's 20.00 low has been met with strong buying towards the end of the session, making a bottom sequence and today the price appears to be consolidating. This resembles the Rising Wedge of the previous sharp sell-off sequence on March 9th.
After making Higher Lows, the pattern topped slightly above the first High. With 1H technicals largely mixed (RSI = 41.112, ADX = 21.510, MACD = -0.760), we are expecting this to make Higher Low and bounce towards a 24.40 top.
** If you like our free content follow our profile (www.tradingview.com) to get more daily ideas. **
Comments and likes are greatly appreciated.


OIL, accurate buy idea In this video, u will learn where u can open accurate entry OIL .
Write in the comments all your questions and instruments analysis of which you want to see.
Friends push the like button if you like the idea - that would be the best THANK YOU.
Thank you for your support, I Love it.

WTI Oil: Buyers should lower target price. Long term approach.After a dramatic and historic day for Oil came to a close, the price reached $27.40 on Monday, making contact at the same time with the long term upper Lower Low trend line of the multi year Channel Down on the 1M chart (RSI = 33.568, MACD = -2.190, ADX = 13.260, Highs/Lows = -17.0871). That was the first time we entered this zone since February 2016 and the $26.00 market low.
The bullish reaction on the 1M candle is instant and if the month (March) closes this way then the candle sequence will be similar to the last two Lower Lows on that Channel Down, in January 2009 and in February 2016. If that happens then we have a bottom for the next 2 years at least and long term buyers can step in but with a lower Target Zone: 48.50 - 54.00 as the Lower High trend lines don't leave room for higher upside.
We don't exclude the possibility of a more lengthy consolidation on that Bottom, as in 2009 it took three monthly (1M) candles to price the bottom and in 2016 two. Note that this investment suggestion is only suitable for long term investors with a 2 year horizon and not short term traders.
** If you like our free content follow our profile (www.tradingview.com) to get more daily ideas. **
Comments and likes are greatly appreciated.


OIL - the commodity they are killing for...If the oil would drop through the blue line, I start to believe that 10 dollars per barrel is coming next.Fractals in oil. What would happen in the world to send oil to 10 dollars? ..the commodity controlled by three men only... Black gold. :) Anyway, not looking good for oil... Do not take it too seriously, but consider it. Have fun, trade with smile folks.


WTI Crude Oil: Buy on the pull back.Oil is replicating the rebound sequence earlier in February. So far the 1H MA200 (orange trend line) is applying selling pressure and once the 1H MA50 (which is acting as a Support) breaks, we will most likely get a pull back on the Higher Low of the emerging 4H Channel Up (RSI = 47.327, ADX = 39.738). We will be buying this pull back and target 48.60.
** If you like our free content follow our profile (www.tradingview.com) to get more daily ideas. **
Comments and likes are greatly appreciated.
