WTI Crude Oil: Buy on the pull back.Oil is replicating the rebound sequence earlier in February. So far the 1H MA200 (orange trend line) is applying selling pressure and once the 1H MA50 (which is acting as a Support) breaks, we will most likely get a pull back on the Higher Low of the emerging 4H Channel Up (RSI = 47.327, ADX = 39.738). We will be buying this pull back and target 48.60.
** If you like our free content follow our profile (www.tradingview.com) to get more daily ideas. **
Comments and likes are greatly appreciated.
Wtioil


WTI OIL, long-term bullish.Oil prices found support on the basis of the long-term bullish fork. You can see how the price has always moved within the fork in recent years, recognizing supports and resistances several times. The Fed will most likely cut rates short and multiple times in the course of 2020. The first to benefit from this will be the weakening dollar. The oil price will rise accordingly. We are probably at a long run reversal point. Ambitious targets.

WTI Oil: Entered the long term institutional Buy Channel .Oil has seen a sharp sell-off this week as the coronavirus threat is escalating. The price broke the weekly support levels and the 42.20 Support from the August 2016 low is the last monthly level standing.
This level is conveniently place exactly on the Higher Low trend line of the 1M Channel Up (RSI = 41.589, MACD = -0.200, ADX = 9.410) that started in 2015. In our opinion this is the hyper long term pattern which big institutions has been using to invest on Oil. As you see the price is currently inside the Buy Channel, which has been used since 2016 as a long term Buy Zone. The zone above this displayed in light blue is the Hold Channel as naturally it has been dominating the price action for the past 5 years as it is the neutral zone where investors hold their positions. Above that zone we have the Sell Channel, which is where investors and big institutions liquidate the positions they have been holding on the long term and take their profits.
It is no coincidence that last week's 1W candle was rejection right at the bottom of the Hold Channel and this week we got that much lower price. The market used the Coronavirus news to push the price deeper into the 5 year Buy Channel which is the strongest demand zone they can get. Investors who want to trade WTI Oil as big institutions do, this is their opportunity to buy low.
We see Oil as a long term investment and with the 1W RSI indicating that this is still an accumulation process (and not a break of the bullish pattern) for the next long term bullish leg towards the Profit Taking zone, we are expecting a reversal initially into the Hold Zone and the 65.60 Resistance and (possibly in +1 years time) at the 77.00 October 2018 peak.
** If you like our free content follow our profile (www.tradingview.com) to get more daily ideas. **
Comments and likes are greatly appreciated.

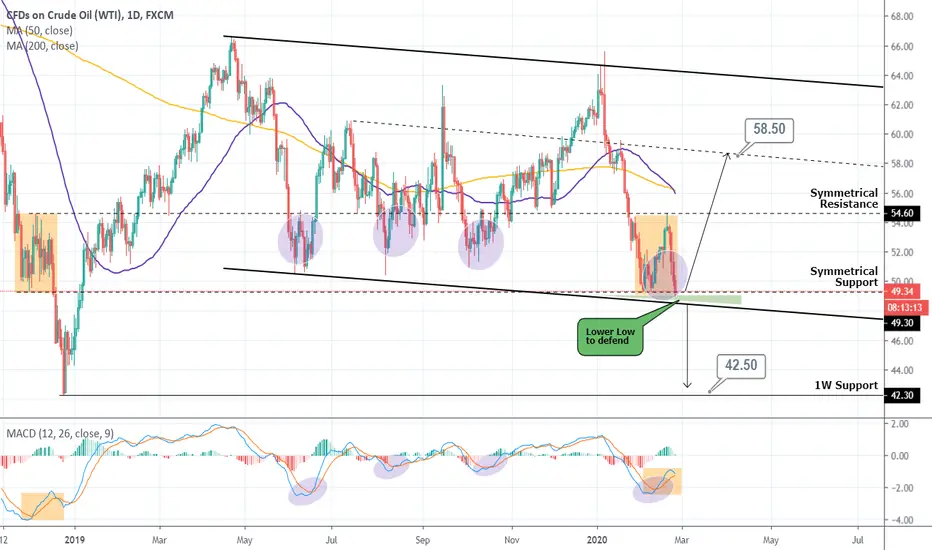
USOIL Why it MUST hold this Triangle. Danger for $42.5 otherwiseThe pattern is a Channel Down since the April 2019 66.60 top. However with the price rejected on the 54.60 Resistance and pulling back to the 49 region the very bearish fractal of 21 Nov - 14 Dec 2018 comes to my mind. See how both then and now the price traded within the 54.60 Resistance and 49.30 Support.
As a result buyers must defend the Lower Low zone of the long term Channel Down (which I have displayed it with the green Triangle) if they want to avoid an aggressive break down to the 42.30 1W Support (24 December bottom).
On the other hand, every time the Channel Down made a Lower Low, the price always made a pull back after the first rebound. I have illustrated that with the circles. It never jumped aggressively to a new High. So as long as the Lower Low zone holds, it is a long term technical buy.
USOIL Sell Intraday Plan - follow my arrowSell USOIL - Follow the arrow
What is the process for selling USOIL? Well, the simplest answer is, you are a broker and you will buy from a company that has oil for sale. Your job is to help the buyers find their buyers, then help them close the deal.
Buying oil from a company that is selling isn't easy. Companies want to sell their oil, but they don't want to do it with just anyone. Selling can be a little bit complicated, and it can be even more complicated when you're dealing with the brokers.
But, if you're an expert in selling or buying oil, your skill set is in play. You can help buyers find oil for sale and then help them get the sale and the prices they need. So what kind of skills do you need to have to be a successful selling professional?
First and foremost, you need to have a working knowledge of the oil industry. In other words, you need to be intimately familiar with the industry, both long term and short term. You also need to be able to speak the language of the oil brokers and the oil companies.
You will not get very far in this business without knowing how to speak the language of the oil brokers and the oil companies. You will need to know what each company or industry likes to hear and what doesn't. This helps you to write great boilerplate letters to send to potential buyers.
A successful buyer is one who is interested in buying oil for sale. There are two things that you need to know about the buying process. You need to know the specific price points you need to meet to sell the oil and you need to know the kinds of payments that the buyer needs to make.
While you can't please everyone, there are some customers' demands and trends that need to be met. These are the reasons why the oil buyers charge so much. If you meet the specific needs of the buyers, you will be in a good position to sell your oil.
Getting a credit card for buying and selling is a good way to connect with buyers. This is a major way to market your business. Make sure you contact every buyer that offers credit, because sometimes they can be very choosy about where they buy oil.
Once you've sold the oil, you need to know how to work with the buyers. You'll have to take care of all the sales people that helped get the deal closed. You can offer a few of them a small percentage of the profits that you make, just for the added benefit of assisting in their continuing education.
The buyers will love to get a large amount of oil in an extremely short period of time. Most are looking for oil that is at the front of the line and is being offered at the lowest possible price. Don't make the mistake of offering huge discounts, as this will drive away buyers.
Buying oil is very complex and in some cases, complicated. But there are strategies and tactics that can help. And with the ability to use various forms of technology to communicate with your buyers, you can see your business grow, just as it has for other successful energy traders.
Some trading professionals say that selling USOIL is a difficult process. They say that the best way to sell oil is through direct sales. But, no matter what, you'll be able to learn plenty about the buying and selling process from a good Oil Broker.

WTI US OIL - Long opportunityPAIR IN FOCUS: WTI (US OIL)
PLAN: LONG
ENTRY: 53.53
STOP LOSS: 53.20
TP 1: 53.83 (30 PIPS)
TP 2: 54.22 (69 PIPS)
TP 3: 54.77 (124 PIPS)
REMEMBER TO MANAGE YOUR RISK!

WTI- 52 is the line in the sandIn the past month and a half, WTI lost 16usd of its value( more than 25%) dropping from 66 to 50 area. At this point, WTI found support and formed a double bottom with the neckline just around 52. After a break of the neckline and a rise to 54, oil dropped again and is trading now just in support (previous neckline resistance).
A reversal from this point would confirm that oil has more to rising and opens the door for 57 resistance.
Alternatively, a daily close under 52 would signal that the correction is over and the downtrend has resumed.

WTI Oil: Short term (bullish) outlook.Oil has finally entered a consistent uptrend on the 4H chart, practically being within a Channel Up since the Feb 04 bottom (RSI = 59.395, MACD = 0.500, ADX = 23.410, Highs/Lows = 0.0000). The MACD shows that it can be sustainable in the near future as the buy/ sell points seem quite obvious.
It is also positive that the 4H MA50 (which was formerly a strong Resistance in the January sell-off), has now turned into Support and has already successfully provided rebounds twice. Also see how systematically the Lower Highs of the January downtrend are filled (blue dashed lines). It appears that the market is using those as benchmarks/ targets during this (early) uptrend.
Assuming the pattern holds, the next Lower High Gap is at 56.00, which should be the technical Target for short term buyers.
This is very much in line with our long term perspective:
** If you like our free content follow our profile (www.tradingview.com) to get more daily ideas. **
Comments and likes are greatly appreciated.

USOIL Buy SignalPattern: Channel Up on 4H.
Signal: Bullish as the pattern made a Higher Low and the price was supported on the 4H MA50.
Target: 54.35 (Symmetrical Resistance).
Recent long term outlook:

WTI outlook2 days ago we spoke about a double bottom that is forming on Oil price, with the necklike coming into place just above 52.00.
Yesterday sellers failed to regain control and the price formed a nice Pin Bar.
We favour long positions as long as the price is above 50.50, with a medium-term target of 57.50

WTI (US OIL) - Long opportunityPAIR IN FOCUS: WTI (US OIL)
PLAN: LONG
ENTRY: 51.50
STOP LOSS: 51.000
TP 1: 52.110 (61 PIPS)
TP 2: 52.640 (114 PIPS)
TP 3: 53.260 (176 PIPS)
REMEMBER TO MANAGE YOUR RISK!

WTI Crude Oil: Short term outlook. Bullish divergence on 4H RSI.Oil appears to have found Support following the very aggressive sell-off that started on January 7th after the Iran tensions began to ease. It has so far successfully tested the 49.30 level as a Support twice and is trading sideways within that level and the 52.20 Resistance on the 4H chart (RSI = 57.881, MACD = 0.140, ADX = 33.370, Highs/Lows = 0.4321).
Despite being ranged, the RSI is on a bullish divergence on the 4H chart, printing Higher Highs and Higher Lows ever since the January bearish (Lower High) trend line (dashed line on the chart) broke. Since the price also crossed above the 4H MA50 which has been acting as a Resistance since January 8th (and is now holding as Support), there are higher probabilities to make the 52.20 break out. If that happens then the move will attract more buyers and we will most likely see an immediate test of the 4H MA200 (now around 56.00). Notice that this is roughly where the 0.382 Fibonacci retracement level is.
This is in line with out longer term perspective as shown below:
** If you like our free content follow our profile (www.tradingview.com) to get more daily ideas. **
Comments and likes are greatly appreciated.

WTI Crude Oil: The 4H MA50 is the key for the uptrend.Oil has been consolidating this week on the 4H chart (RSI = 41.638, MACD = -0.340, ADX = 27.678, Highs/Lows = -0.0086) following the massive drop since the "Iran tension" High.
We are seeing the RSI on a bullish divergence at the moment but the uptrend has so far stopped on the MA50 (blue trend line). Since the price is trading around the 1W Support levels, we looked for pointers on the previous bottoms on that level (October and June 2019).
In October 2019 the RSI on the 4H chart was again on a bullish divergence, forming a Double Top and being rejected on the MA50 twice before it eventually broke higher. That break out essentially started the new uptrend. Same with June 2019 (RSI bullish div, Double Top, double rejection on the MA50 before break-out).
This appears to be a strong bullish pattern in formation and it is natural to expect that once the MA50 on the 4H chart breaks, a new strong uptrend will most likely start. A symmetrical target of $58.00 initially is a fair estimate.
** If you like our free content follow our profile (www.tradingview.com) to get more daily ideas. **
Comments and likes are greatly appreciated.


WTI Crude Oil: Optimal long term Buy opportunity.Oil has been on a strong sell sequence since the January 8th Top (tensions with Iran) and has now broken into the 51.40 - 50.55 1W Support Zone. This level has been holding and accumulating buyers since June 5th, 2019.
At the moment 1D may be on an oversold condition (RSI = 27.481, MACD = -2.120, ADX = 46.874) but the RSI is also on the 20.50 June 5th low. Besides this strong bullish signal, another interesting development is the diverging pattern on the 4H chart (left chart). As you see whil 4H is on a Channel Down (RSI = 32.339, MACD = -0.900, ADX = 34.745), the RSI is on a bullish divergence, being on Higher Lows since January 27th.
We are turning into strong buyers at this level, expecting a gradual long term fill of the following gaps: 59.30, 60.90 and 63.30.
** If you like our free content follow our profile (www.tradingview.com) to get more daily ideas. **
Comments and likes are greatly appreciated.

We could fall hard from here.We've been here before, right?
How many tests must it take before it gives in.
Strong gold, weak dollar. uncertainty in the market.
Surely it's time for the late lows of December 2018. my entry is when it breaks below the green zone 50.1/50
Updates to follow...

WTI - Sell 30/01/2020Friends, please before reading, support this idea with your Like and any Comment, thanks.
You can sell WTI from 55-56
Stop-loss at 57
You will find more trading ideas in SAV Finance community.

Still waiting for the OilLike in the past, Oil had a rejection around 50.47, during a major breakdown. The possibility that it can repeat is still there (mirror) . Waiting for future movements; if bearish, possible opening with high reward in long position.

West Texas Oil updateANALYSIS ON WTICOUSD
Welcome to my analysis
-
1HR CHart
-
Interesting Point of interest In the West Texas Oil.
- Price below 200 day EMA.
- look for sell signals.
- Watch top for sell.
- Watch line for break out to the downside.
- MACD showing bearish divergence
Stay Tuned

WTI OIL Long term Buy SignalPattern: Channel Up on 1D.
Signal: Bullish as the price hit the Higher Low zone of the pattern.
Target: 66.00 and 68.00 depending on the actual Higher Low.
Previous targets:

WTI Crude Oil: Touched the 1W MA200. Potential Support & ReboundOil has completed three red weeks, making a strong correction since the Iranian crisis. In doing so, the price has just made contact with the 1W MA200 (orange trend line) and since the 1W chart turned neutral (RSI = 45.808, STOCH = 47.665, CCI = -38.1509, MACD = 0.520, ADX = 23.460) we may have a Support and a valid long term buy level.
Notice how the 1W MA200 has been providing Support since mid January 2019, making this a full year of Support for Oil. This is a strong indication that buyers are accumulating periodically here. The same sequence is spotted in 2016/2017 with the 1W MA50 providing this time Support for 1 full year. The pattern is quite similar.
Based on the above we've set a medium term Target at 63.50 and a long term at 69.00.
** If you like our free content follow our profile (www.tradingview.com) to get more daily ideas. **
Comments and likes are greatly appreciated.
