WTI Oil: Buy opportunity on the pull back.Oil made the expected Higher High on the 1D Channel Up (RSI = 56.507, MACD = 0.750, Highs/Lows = 0.1029, as forecasted on the buy call below:
At the moment the 4H RSI has reached the 1-month peak and is consolidating, a sign that normally indicates the start of a pull back within the Channel Up in order to price a Higher Low. If the 4H MA50 breaks (so far held once on Friday), we are expecting a full retrace to the Buy Zone within the Higher Low and MA200. Our Target Zone then will be 59.80 - 60.90.
** If you like our free content follow our profile (www.tradingview.com) to get more daily ideas. **
Comments and likes are greatly appreciated.
Wtioil


WTI Crude OilFundamental :
OPEC and Russia decided to deepen the existing 1.2 million barrels per day cut in output by additional 500,000 barrels per day through the end of March 2020.
Technical :
58.62 become bullish key level, if this level break up, bullish target at 62.11 (September high)
We have support zone at 58.63 to 57.42
Trading plan 1 :
We can buy right now at 58.62
or wait at support 58.08
Stoploss bellow 57.47
target at 62.11
Trading Plan 2 :
Buy long after bullish key level break up above 58.62
Stoploss bellow 58.03
target at 62.11
You can support my work with LIKE

WTI OIL Bullish Trading planPattern: 1D Channel Up.
Signal: Bullish as the price broke the 58.80 Symmetrical Resistance, which (excluding the Saudi attack on September 16th) has been holding since July.
Target: 61.00 (1st 1W Resistance) and if the Lower High trend line (red bold) of the Descending Triangle breaks, 63.50 (2nd 1W Resistance).
See how accurate the 1W Descending Triangle has been on my last Support Buy:

WTI Crude Oil Preparing for OPEC MeetingThe West Texas Intermediate Crude Oil market initially tried to rally during the trading session on Monday, bouncing from the uptrend line and reaching towards and above the 50-day SMA initially. The crude oil market kick off the week with rally, as an Iraq oil minister suggested that not only would OPEC continue its production cuts, but it would possibly even consider cutting an additional 400,000 barrels a day. The rally ran into a brick wall though as President Trump announced new tariffs in Latin America and threatened new ones on Europe.
At the end of the day Brent crude and WTI gave up their gains to finish almost unchanged. Now WTI crude oil is showing convergence with its hourly 20 SMA and trading below its 50 SMA on the same chart.
Near-term action is weighed by Friday’s massive bearish daily candle, with Friday’s close below 38.2% Fibo support at $55.78 (on last 2 months rise of $50.55 to $58.71) adding to negative near-term tone, which is expected to persist while recovery attempts remain capped by daily high ($58.15).
It is because of this that the $55 level underneath will offer plenty of support, but if it does in fact get broken, the market should goes down towards the $52.50 level (78.6% Fibo).
On the upside, the daily 200 SMA line remain relevant and are additional barriers against upward movement. The first resistance is at 56.50. Next is resistance from the 200-EMA at 57.51.
Overall, we believe that the market is going to continue the overall uptrend and channel for the rest of the week, but it will more than likely be very choppy, and news driven.

Oil- towards 51 support?On Friday Oil was sold aggressively losing aprox 7% of its value.
Now the price is in a well-deserved correction and raised to confirm the ascending trend line as new resistance
Strategy:
Sell the market above 56.00
SL @ 59.00
TP @ 51.00

WTI Oil: Medium term Buy opportunity.Oil took a hard hit last Friday towards the 54.85 1D Support. Technically this makes a perfect Higher Low on the 1D Channel Up (RSI = 47.115, MACD = 0.310, ADX = 20.203, Highs/Lows = -0.4050). On top of that the 4H RSI is on the lowest level since early August, so we are taking this as a strong medium term buy opportunity. Our Target Zone is 58.00 - 58.70 (region within the 4H gap fill and 1D Resistance).
** If you like our free content follow our profile (www.tradingview.com) to get more daily ideas. **
Comments and likes are greatly appreciated.


CRUDEOIL: Day-Swingtrade-OpportunityHey tradomaniacs,
welcome to another free signal!
Type: Day-Swingtrade
Market Sell: 57,62
Stop-Loss: 58,70
Target 1: 56,64
Target 2: 56,00
Target 3: 55,26
Stop-Loss: 108 pips
Risk: 1-2%
Risk-Reward: 2,31
-----------------------------
LEAVE A LIKE AND A COMMENT - I appreciate every support! =)
Peace and good trades
Irasor
Wanna see more? Don`t forget to follow me.
Any questions? PM me. :-)

Could Be - USOIL, Hope it will break the trend line.Could Be - USOIL, Hope it will break the trend line.


oil sell coming soonprice approaching our daily trend line, we will looking for sell up there.....patience is everything in this game

WTI OIL Neutral sentiment. Trade the break-out.Pattern: 1W Descending Triangle .
Signal: Bullish within the 1D Channel Up. Neutral outside so trade the break out: (A) Bullish above the 58.80 Symmetrical Resistance, (B) Bearish below the 54.80 1D Support.
Target: Within the 1D Channel Up it is always the 58.80 Resistance. Outside is (A) = 61.00, (B) = 51.50.
See how accurate the 1W Descending Triangle has been on my last Support Buy:

West Texas Oil - follow channelANALYSIS ON West Texas Oil
Welcome to my analysis
-
2HR CHart
-
Interesting Point of interest In the West Texas Oil pair.
- Price above 200 day EMA.
- look for buy signals.
- Expecting some minor downward movement.
- Watch 59.00 for take profit.
- MACD showing bullish divergence
Stay Tuned


WTI Crude Oil bullish in the short-termWTI Crude Oil is moving within a bullish channel which in turn is located within larger rectangular congestion. Likely a retest of the resistance.

The break of red trend line will kill oil businessIf oil wont find support at $42, then it has chances to drop another $15-$20

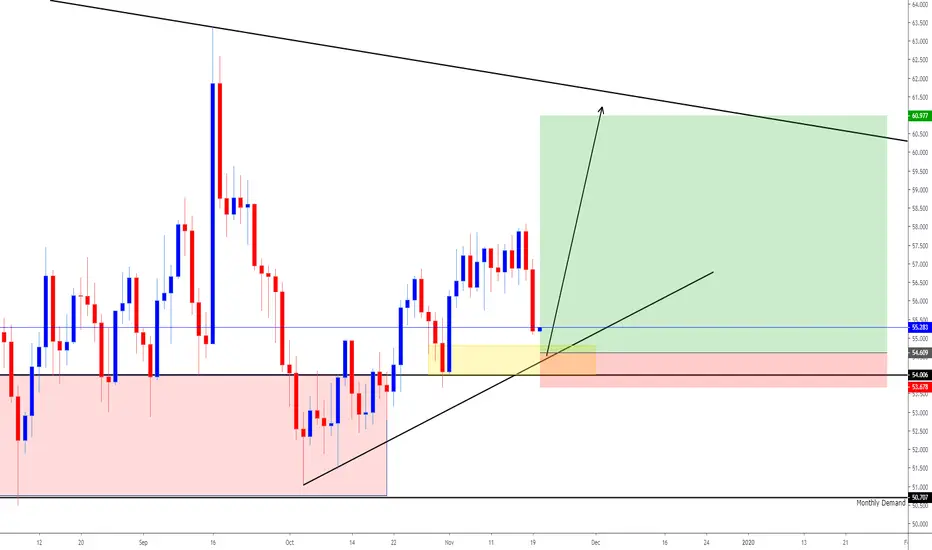
OIL - Daily - Buy setup for a swing trade Crude OIl - Daily - After recent distribution I can see price coming near a daily demand zone around 54.50.. I was long oil this week and got stopped out but mid term bias remains the same.. Oil is trading in a bullish structure so im anticipating a dip into the demand zone around 54.50 with stops below 53.70 and target 60-61...

US CRUDE OIL - H4 - Buy setupCrude oil - H4 chart showing buyers in control with price continue to make higher highs and higher lows while leaving behind fresh demand zones.. Buy limit set at 57 with stops below 56.20 and take profits 60-61... Enjoy

WTI. Upcoming shortHi all. Here’s my view on oil. We’re getting close to the 0.618 zone which is also aligning with the channel. I’ll be looking at shorts here on a lower TF if we reject. As you can see when oil goes it can go quite fast. If you do get into the trade and it goes down you can look at TPs at the bottom of the channel. Breaking 50 has been quite hard with 3 attempts already. This trade setup has a 1/4.5 R/R. As always oil is more volatile than FX so manage your risk accordingly.

