WTI OIL Channel Down bottom buy signalWTI Oil (USOIL) eventually hit our 71.00 target we set last week (see chart below) upon the dotted Channel Up break-out:
The price is now attempting a rebound following the breach of the 1W MA200 (red trend-line), which is a typical procedure throughout 2023 and delivers a strong rebound. However, we we will our perspective short-term until the Channel Down breaks, and will only target 73.50, which is where we expect contact to be made with the 4H MA50 (blue trend-line). We reserve a spot for an additional buy at 67.00 (June 28 Low), in case the price makes one last pull-back to price a Lower Low on the Channel Down.
-------------------------------------------------------------------------------
** Please LIKE 👍, FOLLOW ✅, SHARE 🙌 and COMMENT ✍ if you enjoy this idea! Also share your ideas and charts in the comments section below! This is best way to keep it relevant, support us, keep the content here free and allow the idea to reach as many people as possible. **
-------------------------------------------------------------------------------
💸💸💸💸💸💸
👇 👇 👇 👇 👇 👇
Wtioil

USOIL is heading Lower and lower (~67$)Hello Traders
Our technical view has been shown in the chart.
If you like it then Support us by Like, Following, and Sharing.
Thanks For Reading
Team Fortuna
-RC
(Disclaimer: Published ideas and other Contents on this page are for educational purposes and do not include a financial recommendation. Trading is Risky, so before any action do your research.)

WTI Crude Oil Trading: An In-Depth Analysis of a Bearish TrendDear Esteemed TradingView Members,
I n the ever-evolving world of finance and trading, staying ahead of the curve is essential for success. If you're part of the exclusive audience of elite business professionals and investors, you understand the importance of precise market analysis and informed decision-making. In this article, we delve into the intricacies of WTI Crude Oil trading to provide you with valuable insights and a sophisticated outlook on the current market.
Decoding the WTI Crude Oil Market
M ACD Indicator Insights: The WTI Crude Oil market has witnessed a bearish trend since September 28, 2023, as indicated by the Moving Average Convergence/Divergence (MACD) at the bottom of the chart. While MACD continues to display bearish signals, it's vital to remember that this is a lagging indicator, reflecting historical trends. As sophisticated investors, we must recognize that historical behavior does not guarantee future outcomes. The world and its dynamics are in a constant state of flux, with each trading day being a unique entity shaped by ever-evolving global events.
D eep Neural Analytics Perspective: Here's where our analysis takes an intriguing turn. Deep Neural Analytics suggests the possibility of WTI Crude Oil being oversold. Historically, when MACD levels have reached this point, a bullish pull-up often follows. However, it's important to approach this insight cautiously. Global news and unforeseen developments can significantly impact oil markets. While historic trends provide valuable guidance, they are not absolute predictors of future behavior.
T he Support Zone: According to volume metrics, the current support zone (indicated by the upper blue rectangle) ranging from $77 to $84 also serves as a demand zone. If market sentiment remains positive and bearish news doesn't disrupt the status quo, this zone could transition into a consolidation platform. A consolidation zone acts as a springboard for investors to accumulate positions and potentially drive the price to the next resistance zone, which might fall within the range of $94 to $100 (as depicted by the purple rectangle).
A lternative Scenarios: If buyers fail to sustain the current support zone, or if external factors challenge investor sentiment, the next potential demand zone lies between $63.5 and $71 (as illustrated by the bottom blue rectangle). Should this scenario unfold, it would necessitate a reassessment to determine its suitability for a possible reversal. Theoretically, if oil doesn't reverse from the current demand zone, it could find its turning point in the alternate demand zone. These scenarios, however, are long-term considerations, while the current situation sees oil consistently falling below key Exponential Moving Averages (EMAs) like EMA 20/50/100/200.
U nderstanding Sustainability: Exponential Moving Average (EMA) indicators play a pivotal role in comprehending the sustainability of trends. Gradient Boosting Machines (GBMs) applied to EMAs and oil prices suggest that the bearish trend may persist until February 2024 or potentially longer. Despite MACD indicating that oil is oversold, GBMs on EMAs advise against forecasting an immediate bullish trend. This underscores the importance of not relying solely on one indicator.
The Road Ahead
I n the realm of WTI Crude Oil trading, informed decision-making is key. The markets are driven by a complex interplay of variables, making the role of a sophisticated investor all the more crucial. Without bullish news and indicators, WTI Crude Oil continues to display bearish tendencies and may maintain this trajectory for the foreseeable future.
Remember, this analysis serves as a guide, not an investment recommendation. Conduct thorough research, safeguard your funds, and take full responsibility for your investment choices. The dynamic nature of financial markets requires vigilance, and with the right insights, you can navigate the WTI Crude Oil landscape with confidence and wisdom.
Kind regards,
Ely

WTI CRUDE OIL High probability buy above the MA50 (4h).WTI Oil is trading inside a Channel Down since the September 27th High.
The price is now forming the Right Shoulder of a minor Inverse Head and Shoulders pattern that bottomed on the Lower Lows trend line of the Channel Down.
This is formation technically aims at pricing the new Lower High at the top of the Channel Down.
Trading Plan:
1. Buy the moment a (4h) candle gets closed over the MA50 (4h).
Targets:
1. 80.50 (which is the 1.382 Fibonacci extension, as the previous Lower High was priced. Also it's the MA200 4h and top of the Channel Down).
Tips:
1. The RSI (4h) is forming the exact same pattern as the previous bottom from October 6th to 12th. Once it re-crossed over its MA line, the spike that priced the top started.
Please like, follow and comment!!
Notes:
Past trading plan:

WTI Crude oil front expiration - last updateOverview:
EIA data and OPEC+ meeting postponed,
make tumble the market.
My dear volatility!!!
Strategy:
Neutral. Follow the market.
Our current position's Delta @$76.39: 0.03
This are all the corrections we made today
5)rebalance: @$76.39 (from 0.23 to 0.03)
4)rebalance: @$75.70 (from 0.62 to 0.03)
3)rebalance: @$73.90 (from -21 to 0.30)
2)rebalance: @$74.50 (from -0.30 to 0.05)
1)rebalance: @$76.10 (from +0.28 to +0.03)
rebalance: @$75.45 (from -0.58 to +0.06)
Technical signals:
RSI positive signal just if cross
in positive area
Stochastic still in negative area.
Trends analysis:
primary(purple): corrective structure wave A
intermediate(green): corrective structure wave B
minor(yellow): corrective structure wave C close
Bullish targets:
first@ $77.00
second@ $78.70
Mandatory rebalance level
/Stop loss: not set
Bearish targets:
first@ $75.00
second@ $73.90

WTI CRUDE OIL Buy signal under the 4hour MA50WTI Crude Oil / USOIL is trading inside a Channel Down for almost 2 months.
The recent Lower Low on its bottom is so far replicating the previous one on October 6th.
Today's sudden decline made a symmetric pull-back as on October 12th.
This is the final short term buy opportunity before the price approaches the top of the Channel and the 4hour MA200.
A crossing over the 4hour MA50 will confirm the buy.
Target 79.50, which is under Resistance A, like the Lower High of October 20th.
Previous chart:
Follow us, like the idea and leave a comment below!!

Oil continues to slide within the channelThe price of WTI crude oil continues to rise ahead of the OPEC+ meeting scheduled for Sunday, during which cartel members will discuss policy regarding production. The group will likely decide to lower the output in response to more than a 20% decline in the oil price since September 2023 highs (now, closer to an 18% decline). While a drop in supply is normally bullish for oil, it is important to note that some of it will get offset by the United States trying to ramp up its domestic production. Furthermore, the prices are already rising in anticipation of the cartel’s decision. Nonetheless, our outlook stays unchanged, with a price target of $70 per barrel for 2024.
Illustration 1.01
Illustration 1.01 displays the daily chart of USOIL and simple support/resistance levels derived from peaks and troughs.
Technical analysis
Daily time frame = Bearish
Weekly time frame = Slightly bearish
Please feel free to express your ideas and thoughts in the comment section.
DISCLAIMER: This analysis is not intended to encourage any buying or selling of any particular securities. Furthermore, it should not be a basis for taking any trade action by an individual investor. Therefore, your own due diligence is highly advised before entering a trade.

WTI bears eye a move down to $80Last week's swing trade to $90 worked out well, yet momentum ha since shifted lower.
I noted in the recent COT report that managed funds and large speculators have been trimming long exposure in recent weeks, and that managed funds increased short exposure last week despite the slew of negative headlines surrounding the Middle East conflict. This also coincided with the two small bullish weekly candles, which appeared to be corrective on the weekly chart - and therfore suggests lower prices.
A lower high has formed below $90 and momentum turned lower. As support has been found around the Jan/April highs, we suspect a bounce is due. And this could allow bears to fade into favourable prices below $87 - $87.50 on the assumption a breakdown is pending ahead of its move to $80.
Should this be part of a larger decline, note that $75 and $70 are near the 100% and 138.2% Fibonacci projection levels on the daily chart.

WTI OIL Short-term rebound expected.Last month's Head and Shoulders (H&S) pattern (see chart below) hit both of our Targets (79.00 and 75.00) and transitioned into a Channel Down:
The price almost hit the pattern's bottom (Lower Lows trend-line) and after a 4H MA50 (blue trend-line) rejection, the 4H RSI formed the same Higher Lows trend-line as it did on October 12.
We are expecting this to be the start of the Lower High leg towards the 4H MA200 (orange trend-line). This is expected to be within the 0.618 Fibonacci retracement level and a +10.25% range. Target 82.50.
-------------------------------------------------------------------------------
** Please LIKE 👍, FOLLOW ✅, SHARE 🙌 and COMMENT ✍ if you enjoy this idea! Also share your ideas and charts in the comments section below! This is best way to keep it relevant, support us, keep the content here free and allow the idea to reach as many people as possible. **
-------------------------------------------------------------------------------
💸💸💸💸💸💸
👇 👇 👇 👇 👇 👇

WTI Crude oil - front expirationTechnical Analysis:
Support level $75 looks like resisting. After the forecasted rebound, seems the market stay cautious with a triangle formation on hourly time frame.
Scenarios:
1. Scenario 1 - Positive continuation till the first target (ABC intraday structure).
Strategy for Scenario 1:
- On consolidation above $77 set the position's Delta to positive, following your investment criteria.
- First target: $78.50
- Strategy on reaching target 1: Set the position's Delta to zero
- Second target: $79.50
- Strategy on reaching target 2: Set the position's Delta to zero
2. Scenario 2 - Negative Acceleration. If the price breaks down below today's low of $76.50, we could see a further decline to around $75 from where restart a rebound. Only a breakdown of 74.91 would indicate a negative acceleration in price.
Strategy for Scenario 2:
- Set the position's Delta to negative, following your investment criteria.
- First target: $75
- Strategy on reaching target 1: Set the position's Delta to zero
- Second target: $72.50
- Strategy on reaching target 2: Set the position's Delta to zero
Summary:
The technical analysis suggests a potential short term technical rebound. We consider a positive rebound strategy if the price hold level $75 and till $79.5/$80 area, where we will consider close wave 4. On the close of wave 4 or a price drops below $74.91 we will consider a short strategy.
Make sure to follow your investment and adjust your position's Delta accordingly to manage your risk.
Investment criteria we highly recommend:
CONSERVATIVE strategy: max position's Delta value (+/-) 0.20
MODERATE strategy: max position's Delta value (+/-) 0.30
AGGRESSIVE strategy: max position's Delta value (+/-) 0.40
Please note that investing in derivatives involves hight risks. We strongly advise against invest in future or options naked (not hedged), and to carefully follow your investment strategy criteria and risk management.
Delta Zero
Technical Analysis team

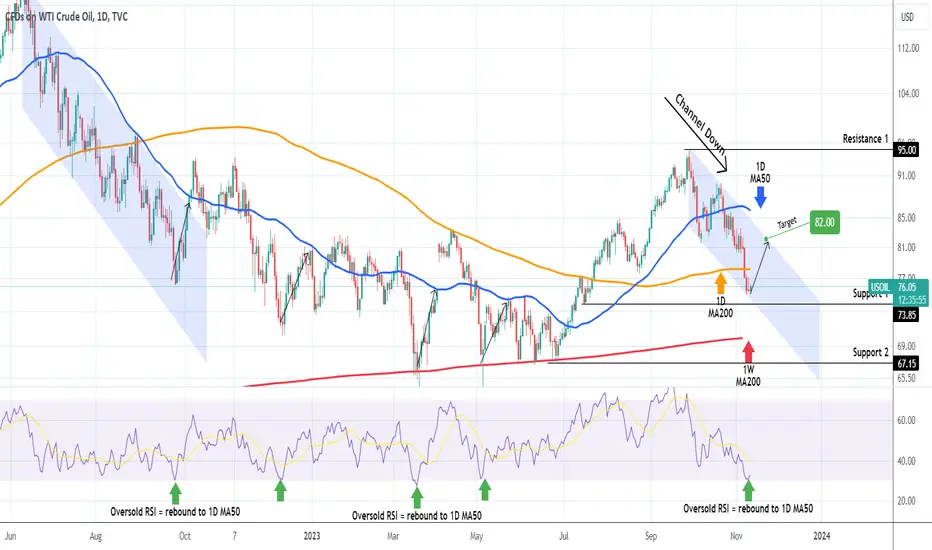
WTI OIL Hit both bearish targets. Time to buy again?WTI Oil (USOIL) hit both our 79.00 and 75.00 targets on the H&S sell call we made (see chart below) on October 30:
The trend on the 1D time-frame evolved into a Channel Down that broke below the 1D MA200 (orange trend-line) but hit on Wednesday it's bottom (Lower Lows trend-line) and is so far holding. As the 1D RSI touched the 30.00 oversold barrier, we have a strong buy signal emerging as every time in the last 2 years the 1D RSI got oversold, Oil always rebounded to reach the 1D MA50 (blue trend-line) at least.
The 1D MA50 has been the Resistance since October 24 and as Support 1 (73.85) is very close, we turn bullish again after a long time to target the top of the Channel Down at 82.00.
Notice that this correction got closer to the 1W MA200 (red trend-line) which is the ultimate long-term Support and the one that held on 5 different times from mid March to June (closed all 1W candles above it and eventually led to September's High).
-------------------------------------------------------------------------------
** Please LIKE 👍, FOLLOW ✅, SHARE 🙌 and COMMENT ✍ if you enjoy this idea! Also share your ideas and charts in the comments section below! This is best way to keep it relevant, support us, keep the content here free and allow the idea to reach as many people as possible. **
-------------------------------------------------------------------------------
💸💸💸💸💸💸
👇 👇 👇 👇 👇 👇
get funded trade oiloil is going down. bull flag with a lower break to liq early buyers. buy around 77.00 with a 1.5 to 2 dollat stoploss. risk 2 or 3 % and get funded withing this one trade.
war is good for oil

WTI Crude Oil achieves the new target The price of oil continues to fluctuate around the 77.83 level, waiting for a break of this level to confirm the rush towards our next targets, which start at 75.49 and extend to 73.80 as the next main stations, keeping in mind that the continuation of the bearish wave depends on stability below the 79.18 level.
The general trend expected for today: bearish
Pivot Price: 76.83
Resistance Prices: 79.18 & 80.80& 82.74
support price: 75.49 & 73.80 & 72.12

WTI CRUDE OIL: Very dangerous 1W MACD Bearish Cross formed.WTI Crude Oil materialized our 78.50 short term target (chart at the bottom) and crossed under the 1D MA200. This is a breach of potentially serious consequences as it also breached the 1W MA50, so we need to monitor the closing on a weekly scale. If it closes under it, the bearish trend is very likely to be extended. The formarion of a MACD Bearish Cross on the 1W timeframe can be very dangerous as the last one that happaned while the price breached the 1W MA50 was on June 13th 2022, the market High after the Russia invasion peak.
If the market does close the week under the 1W MA50, we expect a rebound on the Channel Down bottom near 76.00 and if the candles close under the 1W MA50, fresh short targeting the 1W MA200 (TP = 71.00).
See how well our prior idea has worked:
## If you like our free content follow our profile to get more daily ideas. ##
## Comments and likes are greatly appreciated. ##

Crude Oil - KeyLevelsOil, after breaking the support of the trend line, attempted a comeback and retested the former support line that turned into resistance, from where the sellers managed to defend the price and thus it seems that we only had a discount for a new sell.
Now the price is in an interesting neckline and I, personally, am only looking for a short.

USOIL to find sellers close to market levels?WTI - Intraday
The AB=CD formation target is located at 70.19.
Reverse trend line resistance comes in at 83.91.
Bespoke resistance is located at 84.06.
Preferred trade is to sell into rallies.
The medium term bias remains bearish.
We look to Sell at 84.00 (stop at 85.50)
Our profit targets will be 80.20 and 79.60
Resistance: 83.91 / 84.06 / 89.83
Support: 80.19 / 77.64 / 70.19
Risk Disclaimer
The trade ideas beyond this page are for informational purposes only and do not constitute investment advice or a solicitation to trade. This information is provided by Signal Centre, a third-party unaffiliated with OANDA, and is intended for general circulation only. OANDA does not guarantee the accuracy of this information and assumes no responsibilities for the information provided by the third party. The information does not take into account the specific investment objectives, financial situation, or particular needs of any particular person. You should take into account your specific investment objectives, financial situation, and particular needs before making a commitment to trade, including seeking advice from an independent financial adviser regarding the suitability of the investment, under a separate engagement, as you deem fit.
You accept that you assume all risks in independently viewing the contents and selecting a chosen strategy.
Where the research is distributed in Singapore to a person who is not an Accredited Investor, Expert Investor or an Institutional Investor, Oanda Asia Pacific Pte Ltd (“OAP“) accepts legal responsibility for the contents of the report to such persons only to the extent required by law. Singapore customers should contact OAP at 6579 8289 for matters arising from, or in connection with, the information/research distributed.

WTI CRUDE OIL Expecting a rebound on the MA200 (1d).WTI Crude Oil has been declining rather sharply since September 28th and today's green (1d) candle should give way to a new low tomorrow.
Based on the (1d) RSI sequence, this fall resembles the fractals of November 2022 and April-May 2023.
Both rebounded to the 0.5 Fibonacci level after pricing their respective bottoms.
Trading Plan:
1. Sell on the current market price.
2. Buy at 78.15 (MA200 1d and a little over Support 1).
Targets:
1. 78.15 (MA200 1d and a little over Support 1).
2. 86.30 (Fibonacci 0.5 level).
Tips:
1. Both sequences traded sideways after bottoming for around 2 months. This will be an excellent scalping opportunity. Take advantage of it.
Please like, follow and comment!!
Notes:
Past trading plan:

USOil WTI Technical Analysis And Trade IdeaIn this video, we conduct a comprehensive analysis of USOil WTI, with a specific emphasis on the prevailing bearish sentiment evident on the weekly (1W) chart. Throughout this presentation, we delve into fundamental principles of technical analysis, encompassing critical elements such as the current market trend, price dynamics, market structure, and other indispensable components of technical analysis. As we proceed within the video, we meticulously scrutinize a prospective trading opportunity.
It is imperative to emphasize that the insights shared in this content are exclusively for educational purposes and should not be interpreted as financial guidance. Engaging in the foreign exchange market trading entails a substantial degree of risk. Hence, it is essential to prudently integrate robust risk management strategies into your trading plan.

The 1. Chapter of WTI.Oil - Highly flammableTwo scenarios. One Long. One Short.
Fundamentals:
-
Scenario 1 (Orange arrow)
Target: Next resistance level (upper red rectangle ). Recent swing top.
Requirments:
- Monthly close above the orange rectangle.
- Higher swings above it
Invalidation / SL:
- Fall under orange rectangle AND generating lower swings.
Time duration: days, weeks, months, years... ;)
Scenario 2 (blue arrow)
Target: Next support level
Requirments:
- break under orange rectangle
- break under 50% fib
Invalidation / SL:
- Break above orange rectangle
- No Break under 50% Fib
Time duration: days, weeks, months, years... ;)
Good luck

WTI CRUDE OIL: Channel Down emerging.WTI Crude Oil got rejected on Friday on the former HL trendline which should now be considered a Resistance, rejecting the attempt to resume the uptrend. This turned the 1D timeframe technically bearish (RSI = 41.271, MACD = 0.120, ADX = 25.766) and the 1D MACD Bearish Cross (straight after a Bullish Cross) allows us to attempt a short entry, targeting the 1D MA200 (TP = 78.50).
See how well our prior idea has worked:
## If you like our free content follow our profile to get more daily ideas. ##
## Comments and likes are greatly appreciated. ##

wti back to $100+ if bullish ms holdswti is near the range low and has already bounced the monthly level and VAL
liquidity still rests below this low and if the bullish market structure holds above $66 we should see a push back into the $100s

USOIL WTI Technical Analysis And Trade IdeaIn this video, we conduct a comprehensive analysis of the USOIL market, with a primary focus on the prevailing bearish sentiment observed in higher timeframes. Notably, WTI has recently approached a critical support level. Throughout the video, we delve into essential elements of technical analysis, which encompass aspects such as the current trend, price action dynamics, market structure, and various other fundamental components of technical analysis. As we progress through the latter part of the video, we closely examine a potential trading opportunity.
It is crucial to emphasize that the information presented here serves exclusively for educational purposes and should not be construed as financial advice. Engaging in currency market trading carries a significant level of risk. Therefore, it is imperative to prudently incorporate risk management strategies into your trading plan.

WTI CRUDE OIL: Short term sell signal unless this Fib breaks.WTI Crude Oil is on a neutral technical outlook on the 1D timeframe (RSI = 54.002, MACD = 0.110, ADX = 20.935), naturally so as it is ranged between the 1D MA50 and 0.618 Fibonacci level for the past four days.
The MACD now formed a Bullish Cross, which gives an edge to buying but only if the 0.618 Fibonacci level breaks. A similar fractal in May-June offered excellent sideways opportunities until the 0.618 Fib broke.
Consequently, we are selling (TP = 83.20) for as long as the price is under the 0.618 Fib (and buying the bounces) but will buy if the price crosses over it (TP = 95.00).
## If you like our free content follow our profile to get more daily ideas. ##
## Comments and likes are greatly appreciated. ##
