Crude oil rises slowly but falls quickly?
💡Message Strategy
International oil prices continued to climb on Monday, but the gains were limited. Brent crude futures rose 8 cents to $70.44 a barrel, continuing Friday's 2.51% rise. U.S. WTI crude rose 5 cents to $68.50, having surged 2.82% the previous trading day.
The main driving force behind this round of gains came from the market's expectation that the United States would further increase sanctions on Russia. U.S. President Trump said on Sunday that he would provide Ukraine with the Patriot air defense missile system and would make a "major statement" on the Russian issue on Monday.
The contradiction between supply and demand is also intensifying. According to market surveys, Brent crude oil rose by 3% last week and WTI rose by 2.2%. The International Energy Agency (IEA) pointed out that although the market supply and demand appear to be balanced on the surface, the actual global oil supply may be tighter than expected due to the summer refining peak and rising electricity demand.
📊Technical aspects
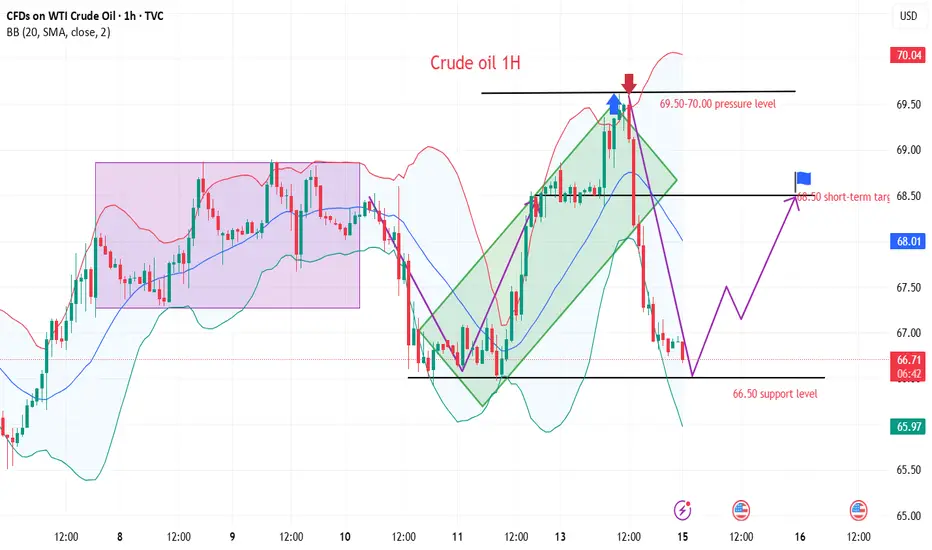
WTI crude oil continued its rebound from last week's low on the daily chart, and the current price is running at the downward support of $66.70, indicating that the short-term bullish power has increased. The MACD indicator shows a golden cross and initial volume, and the momentum column begins to turn positive, indicating that the price is expected to challenge the previous high area (69.50-70.20 US dollars).
The short-term (1H) trend of crude oil is highly repetitive, and the oil price is supported at the lower edge of the wide range and rises again. The short-term objective trend direction is upward within the range. The bullish momentum is sufficient.
💰Strategy Package
Long Position:65.50-66.50,SL:64.00,Target:69.00-70.00
Wtioilsignals
Crude oil awaits upward breakthrough
💡Message Strategy
Inventory data provides short-term support, but it is difficult to change the trend
Although oil prices are under pressure overall, inventory data released by the U.S. Energy Information Administration (EIA) show that as of last week, U.S. gasoline and distillate inventories have dropped significantly, while gasoline consumption has increased by 6% month-on-month to 9.2 million barrels per day, indicating that the summer driving peak has brought short-term positive factors.
In addition, global aviation demand has also become an important variable to boost market sentiment. JPMorgan Chase pointed out in a client report: "In the first eight days of July, the global daily number of flights reached an average of 107,600, a record high, among which aviation activities in Asian countries have recovered to the peak in nearly five months."
The bank also expects that the average daily global crude oil demand growth this year will be 970,000 barrels, which is basically consistent with its forecast of 1 million barrels at the beginning of the year, indicating that although the consumption end is under pressure, it has not yet experienced a cliff-like decline.
📊Technical aspects
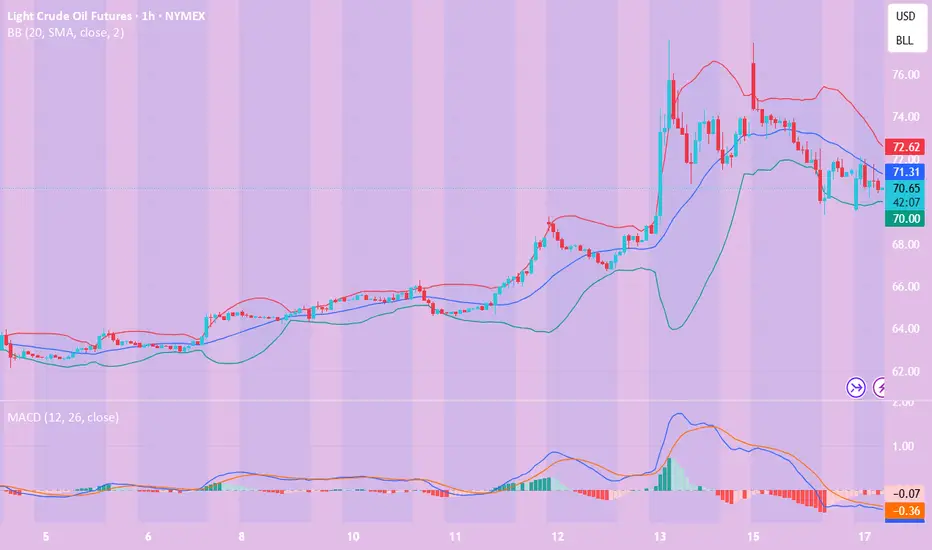
The short-term (4H) trend of crude oil breaks through the upper resistance of the range and runs in an upward trend. The moving average system is arranged in a bullish pattern, and the short-term objective trend direction is upward. The MACD indicator opens upward above the zero axis, and the bullish momentum is sufficient. The oil price fluctuates in a narrow range, and it is expected that the crude oil will continue to rise.
In terms of operation, crude oil is mainly long at a low level. If it rises to the target point, the direction will be selected according to the pattern and continued attention will be paid.
💰Strategy Package
Long Position:65.50-66.50,SL:64.00,Target:69.00-70.00

Crude oil continues to fluctuate upward
💡Message Strategy
OPEC+, led by Asian countries, announced on Saturday that it would increase production by an additional 548,000 barrels per day from next month, more than 30% higher than market expectations of 411,000 barrels per day, accelerating the pace of resumption of production after the production cuts in 2023.
In addition to supply-side factors, demand prospects are also affected by trade concerns. U.S. Commerce Secretary Howard Lutnick said that the country-specific tariffs that the Trump administration intends to implement will officially take effect on August 1, later than the previously scheduled July 9, leaving trading partners with a short breathing space.
Market concerns about the impact of this policy on crude oil consumption have intensified, especially among importing countries, mainly Asian countries.
Confidence in the Asian market remains, and Saudi Arabia raises prices to Asia
Despite the increase in supply, OPEC+ still emphasized in its statement that "the global economic outlook is stable and the market fundamentals are healthy." As a signal of confidence, Saudi Arabia has raised the prices of major crude oil varieties for Asian customers, indicating that it believes that the Asian market has the ability to absorb additional supply.
According to OPEC+ representatives, the alliance will consider whether to increase supply by another 548,000 barrels per day in September at its next meeting on August 3, thereby fully restoring the 2.2 million barrels per day quota cut last year.
📊Technical aspects
From the daily chart level, crude oil fluctuates upward and tests around 75 in the medium term. The K-line closes with a large real negative line, which has not yet destroyed the moving average system and is still supported. The medium-term objective trend remains upward. However, from the perspective of momentum, the MACD indicator crosses downward above the zero axis, indicating that the bullish momentum is weakened. It is expected that the medium-term trend of crude oil will fall into a high-level oscillation pattern.
After the short-term (4H) trend of crude oil fluctuates and consolidates, it turns into an upward rhythm. The moving average system is arranged in short positions, and the short-term objective trend is upward. The MACD indicator fast and slow lines cross the zero axis, and the bullish momentum is full. It is expected that the crude oil trend will continue to rise after a slight rebound during the day.
💰Strategy Package
Long Position:66.00-67.00,SL:65.00,Target:69.00-70.00

WTI(20250617)Today's AnalysisMarket news:
Revised version of the Republican tax cut bill in the US Senate: It is planned to raise the debt ceiling to 5 trillion, and the overall framework is consistent with the House version.
Technical analysis:
Today's buying and selling boundaries:
70.41
Support and resistance levels:
75.98
73.90
72.55
68.27
66.92
64.84
Trading strategy:
If the price breaks through 72.55, consider buying, and the first target price is 73.90
If the price breaks through 70.41, consider selling, and the first target price is 68.27
WTI Breakdown: Bearish Structure & Possible Trade Opportunity 👀 👉 Analyzing the WTI chart, we can observe a lower high and a lower low, indicating a bearish break in structure. I anticipate some additional downside movement. In the video, we delve into the trend, price action, market structure, and explore a potential trade opportunity. ⚠️ This content is for educational purposes only and does not constitute financial advice.

CRUDE OIL (WTI) Bearish Outlook Explained
Crude Oil will most likely keep falling soon.
The price violated a key daily horizontal support and closed below that.
We can anticipate a bearish continuation at least to 71.9
Look for selling the market from a supply area based on a broken structure and a falling trend line.
❤️Please, support my work with like, thank you!❤️

CRUDE OIL (WTI): Time to Sell?!
WTI Crude Oil is testing a recently broken horizontal support.
After a violation, it turned into a potentially strong resistance.
Approaching the underlined area, the price formed a head and shoulders pattern
on an hourly time frame.
A breakout of its horizontal neckline is a strong intraday bearish confirmation for us.
We can expect a bearish continuation now.
Goals 74.9 / 74.3
❤️Please, support my work with like, thank you!❤️

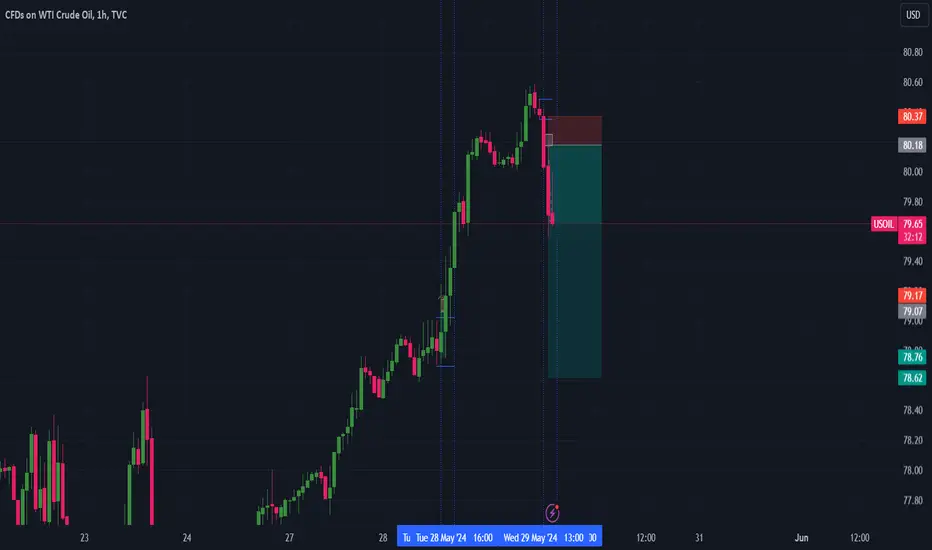
Crude oil fell as expected, empty orders made profits, beautiful
The crude oil was prompted in the intraday, and it went short directly, and now it has fallen sharply, and the friends who kept up with it made profits again, which is very beautiful! ! Keep up with the rhythm, in order not to get lost, please stay tuned, thank you!

WTI CRUDE OIL SEEM SELL CORRECTION THEN BUY....
Hello Traders, here is the full analysis for this pair,
let me know in the comment section below if you have any questions,
the entry will be taken only if all rules of the strategies will be
satisfied. I suggest you keep this pair on your watch list and see if
the rules of your strategy are satisfied.
Dear Traders,
If you like this idea, do not forget to support with a like and follow.
PLZ! LIKE COMMAND AND SUBSCRIBE.

WTI CRUDE OIL POSSIBLE TO BUY....
Hello Traders, here is the full analysis for this pair,
let me know in the comment section below if you have any questions,
the entry will be taken only if all rules of the strategies will be
satisfied. I suggest you keep this pair on your watch list and see if
the rules of your strategy are satisfied.
Dear Traders,
If you like this idea, do not forget to support with a like and follow.
PLZ! LIKE COMMAND AND SUBSCRIBE.

WTI CRUDE OIL WAITE FOR BREAKOUT THEN BUY....
AronnoFX will not accept any liability for loss or damage as a result of
reliance on the information contained within this channel including
data, quotes, charts and buy/sell signals.
If you like this idea, do not forget to support with a like and follow.
Traders, if you like this idea or have your own opinion about it,
write in the comments. I will be glad.

WTI Oil- Will it drop under 70?In my previous Wti Oil analysis, I draw attention to the possibility of a double top formed above 120 with the neckline at the 92 zone.
Oil has dropped under this support and confirmed this zone as new resistance.
At this moment the price is also under 85 support and the road looks clear for continuation.
The next obvious level of support is around 65 and as long as 85 is intact sell rallies is my strategy.

WTI Cude (OIL) POSSIBLE TO BUY ......
AronnoFX will not accept any liability for loss or damage as a result of
reliance on the information contained within this channel including
data, quotes, charts and buy/sell signals.
If you like this idea, do not forget to support with a like and follow.
Traders, if you like this idea or have your own opinion about it,
write in the comments. I will be glad.

WTI Cude (OIL) BUY TRADE IDEAHello Traders, here is the full analysis for this pair,
let me know in the comment section below if you have any questions,
the entry will be taken only if all rules of the strategies will be
satisfied. I suggest you keep this pair on your watch list and see if
the rules of your strategy are satisfied.
Dear Traders,
If you like this idea, do not forget to support with a like and follow.
PLZ! LIKE COMMAND AND SUBSCRIBE.

WTI OIL is correcting. Continue to fall or new rally ahead?A month ago when WTI Oil was testing historic Highs due to the escalation of the Ukraine - Russia war, I called for the need to pull-back to the 1D MA50 (blue trend-line):
That day turned out to be the market top (to this date) and Oil did pull-back to the 1D MA50. In fact after the first 1D MA50 test (and hold), the price rebounded but only managed to make a Lower High and eventually got rejected back towards the 1D MA50 again, which held (so far) for the 2nd time. It is obvious that as long as it holds, it makes a stronger case for a new rebound. If that breaks above the prior Lower High/ Resistance of 117.00, then we can claim that the long-term bullish trend will be extended and in the next 3 months we will see successive Higher Highs. The basis for this, as I also analyzed on my March 08 analysis, is the similarities of the past 6 months of Oil's price action with the September 2020 - March 2021 sequence.
On the other hand, if the 1D MA50 fails and a 1D candle closes below it, WTI should seek the next Resistance Zone which consists of the Prior High of 85.50 and the 1D MA200 (orange trend-line), which is currently at 80.75. A closing below the 1D MA200, could open the way to a new Bear Cycle.
--------------------------------------------------------------------------------------------------------
** Please support this idea with your likes and comments, it is the best way to keep it relevant and support me. **
--------------------------------------------------------------------------------------------------------

WTI OIL in need of a pull-back to the 1D MA50.One of the biggest (if not the biggest) winner of the current war between Russian and Ukraine, is Oil. Energy crises are almost a certainty in times of geopolitical conflicts involving major producers. Even though it is tough predicting technically WTI prices while war is ongoing, charting past fractals could give an idea to where, at least the next consolidation phase could be.
The price action from November 2021 to today has been so far fairly similar to the sequence from November 2020 to March 2021. Both have gone on a slightly above +100% rise since their November lows. Right now the current 1D RSI sequence is exactly on the February 17 2021 RSI top, which prompted the price to enter a Channel Up that eventually led to a Top two weeks later.
Based on this and of course assuming that the war is entering its final stage and will not escalate into a multi-month conflict involving more countries, WTI Oil may be entering an exhaustion channel that will eventually lead to a pull-back on the 1D MA50 (blue trend-line), which is what happened in March 2021. After that, and depending on how the geopolitical stage will look like, we will re-evaluate our thesis.
--------------------------------------------------------------------------------------------------------
** Please support this idea with your likes and comments, it is the best way to keep it relevant and support me. **
--------------------------------------------------------------------------------------------------------

Unique analyis for USOIL, Wyckoff P&F targetsAs you see P&F chart on the right.
USOIL is bullish . Price can reach 85.5-86.6 as our estimating targets.
We'd like to see price going up to grab liquidity above previous highs.
Now, we're still holding long positions.
If we have a distribution, we can think about selling USOIL after that.
If you find the article useful or interesting,
Let's comment below !
------------------------------------------
Notes on using this USOIL trading idea
This is ONLYGOLD team's idea and analysis.
Let's see it as an example or a reference.
You also need your own analysis as well and manage risks.

WTI Cude (OIL) TRADE IDEA
AronnoFX will not accept any liability for loss or damage as a result of
reliance on the information contained within this channel including
data, quotes, charts and buy/sell signals
If you like this idea, do not forget to support with a like and follow.
Traders, if you like this idea or have your own opinion about it,
write in the comments. I will be glad.

WTI OIL Reversal confirmed if daily closes below the 4H MA100Even though my firms thesis has been very bullish on WTI Oil long-term throughout the whole year, that doesn't stop me from spotting potential medium-term tops and technical corrections that only serve for sustaining the uptrend on the long-term. An example was my following idea on October 19:
So far it appears that the price was indeed rejected on the Internal Higher Highs trend-line and is pulling-back on a potential technical correction towards at least the 1D MA50 (blue trend-line). However, further confirmation of this potential reversal can come if the price closes a day below the 4H MA100 (red trend-line). What's the importance of the 4H MA100? Well for the whole year, this has been the short-term support during WTI uptrends and every time a session closed below it, then the 1D MA50 was hit a few days later.
Important notice: Such a confirmation was also given by another indicator, the RSI, last time for the formation of the peak on the Fib 2.0 (as seen I've plotted the long-term uptrend on the Fibonacci Channel). The RSI made a Triple Top on the exact same Resistance that gave the July 06 peak on Fib 1.5. Keep an eye on such confirmations, they come quite useful when determining reversals that are hard to see coming when the price is on a trend.
--------------------------------------------------------------------------------------------------------
** Please support this idea with your likes and comments, it is the best way to keep it relevant and support me. **
--------------------------------------------------------------------------------------------------------

WTI Oil : Stop Hunt /HH to 67.80 -68.20 handle possibleAfter the stop hunt /HL around 61.65 ,Price returned to the old daily range 63.50-67 indicating it will continue to trade inside the range or an upside break out since the SSI is around 25% and every dip is bought strongly .
Trend : Range
Signal : Sell Limit 67.80-68.20
Stop Loss : 68.75
Target : 65-63.75

WTI OIL pull-back needed for next Higher HighPattern: Bullish megaphone on 4H.
Signal: Buy once the price touches the 4H MA100 (green trend-line) again.
Target: $69.00 (right below the 2.5 Fibonacci extension and on the Higher Highs trend-line of the Megaphone).
** Please support this idea with your likes and comments, it is the best way to keep it relevant and support me. **
--------------------------------------------------------------------------------------------------------
!! Donations via TradingView coins also help me a great deal at posting more free trading content and signals here !!
🎉 👍 Shout-out to TradingShot's 💰 top TradingView Coin donor 💰 this week ==> Cryptorphic
--------------------------------------------------------------------------------------------------------

WTI OIL Wait for a 4H MA50 test before enteringPattern: Channel Up & Bullish Megaphone on 4H.
Signal: Buy once contact is made again with the 4H MA50 (blue trend-line).
Target: 60.00 (top of the Channel).
Most recent WTI idea:
** Please support this idea with your likes and comments, it is the best way to keep it relevant and support me. **
--------------------------------------------------------------------------------------------------------
!! Donations via TradingView coins also help me a great deal at posting more free trading content and signals here !!
🎉 👍 Shout-out to TradingShot's 💰 top TradingView Coin donor 💰 this week ==> TradingView
--------------------------------------------------------------------------------------------------------
