WTI Oil can rise above 80 (again)From 25th October's high at around 85, Oil has started to correct and dropped to strong demand zone between 62 and 65.
Now, this correction seems to be over and we can have a leg up above 80 again.
I'm bullish as long as the price is above 65 and, in my opinion, dips should be bought
Wtiusd

WTIUSD Idea On M15Here is my idea for WTIUSD on M15. The price should go down, you can put a pending order on the Order Block. Trade Safe!

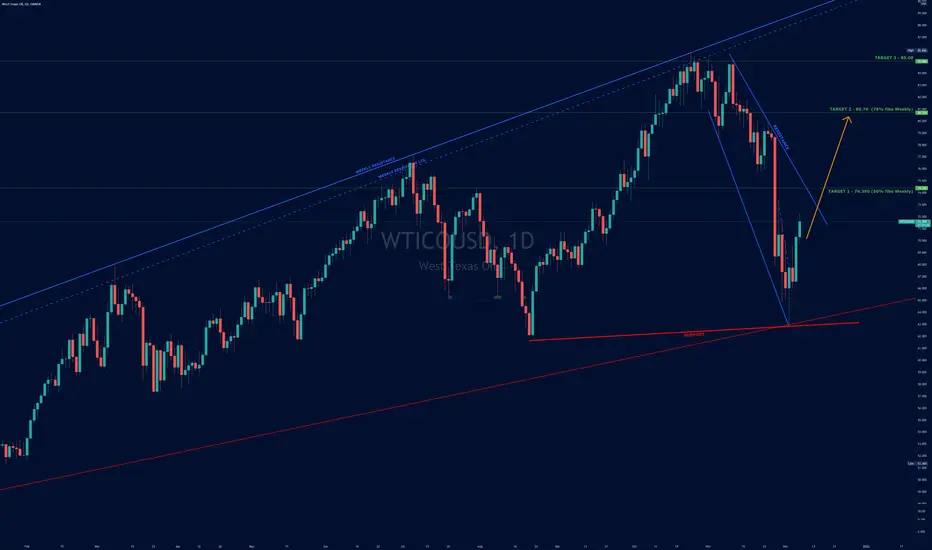
Oil BullishOil Still Bullish after MA200 Daily broke.
Targets on chart
Be carefull, patient and discipline.
This post does not provide financial advice. It is for educational purposes only! You can use the information from the post to make your own trading plan for the market.
But you must do your own research and use it as the priority. Trading is risky, and it is not suitable for everyone. Only you can be responsible for your trading.
Good trades to All.
USOILHey Traders, above is a technical overview on USOIL and the most important zones to take in consideration.
Trade safe, Joe.

Crude Oil ForecastHere is my view for Crude Oil on H1. The price should go up, you can put a pending order on the Order block or find an entry on LTF. Trade Safe!


WTIUSD Pattern on H1Here's my idea for WTTIUSD. It should be going bullish. When reaching Order Block, it's your area to look out for. You can take 10R. Safe Trade!


USOIL Bearish retracement on the daily time frameUSOIL is ultimately bullish however, I believe that we will see a retracement to $72.61 a barrel due to it's previous pullbacks to the bullish trendline as we have experienced in the past few months
Please catch the live analysis here.


OIL lowterm BullishOIL have at present positive momentum.
TP1: 84
TP2: 85
Be careful, patient and discipline.
This post does not provide financial advice. It is for educational purposes only! You can use the information from the post to make your own trading plan for the market.
But you must do your own research and use it as the priority. Trading is risky, and it is not suitable for everyone. Only you can be responsible for your trading.
Good trades to All.

WTI starting to recover from inflation driven plungeHello everyone, as we all know the market action discounts everything :)
_________________________________Make sure to Like and Follow if you like the idea_________________________________
Oil prices surged above $83 per barrel in volatile trading on Thursday, recovering from significant drops caused by concerns about rising US inflation, as OPEC reduced its 2021 oil demand prediction owing to high energy prices.
In a monthly report, the Organization of Petroleum Exporting Countries (OPEC) stated that it expected oil consumption to average 99.49 million barrels per day (bpd) in the fourth quarter of 2021, a 330,000 bpd decrease from last month's prediction.
Possible Scenario for the market :
The market is currently trading at $81.26 and looks like it going to the support line located at $80.17 where a battle will happen between the Bears and the Bulls over control, the outcome will probably be in favor of the bulls which will cause the market to increase in value reaching the first resistance at $84.08.
in case the demand for oil increases even more then we will most likely see a further push that could reach the $88.00 level by the end of the week.
Technical Analysis show :
1) The market is below the 5 10 20 MA and EMA indicating a Bearish Short-term movement, but still above the 50 100 and 200 MA and EMA indicating a Bullish Long-term trend
2) The RSI is at 51.61 showing good strength in the market with a small Bullish divergence that could be a sign of a Bearish short-term trend.
3) The MACD is above the 0 line still indicating a Bullish market, but it has a Negative crossover between the MACD line and the Signal line indicating a small Bearish movement.
Support & Resistance points :
support Resistance
1) 80.17 1) 84.08
2) 78.63 2) 86.45
3) 76.26 3) 87.99
Fundamental point of view :
OPEC expects global consumption to hit 100 million bpd in the third quarter of 2022, three months later than predicted last month.
On Wednesday, data indicated that inflation in the United States surged by 6.2 percent, the quickest rate in 30 years, owing primarily to increasing energy prices, which pushed the dollar higher while sending Brent and WTI oil down by 2.5 % and 3.3 %, respectively.
A surge in US oil supplies following the government's release of some critical reserves pushed up prices even further.
In reaction to rising inflation, US President Joe Biden stated he directed the National Economic Council to concentrate on lowering energy costs and the Federal Trade Commission to crack down on market manipulation in the energy industry in order to reverse inflation.
This is my personal opinion done with technical analysis of the market price and research online from Fundamental Analysts and News for The Fundamental point of view, not financial advice.
If you have any questions please ask and have a great day !!
Thank you for reading.

WTI: Down, Down! 🥰Within the current setup, we are expecting WTI to fall a bit further. The goal of the current movement lays around $78.59. After hitting this area, the price should massively increase again.
Happy Trading!

USOIL ShortHey traders, in the coming week we are monitoring USOIL for a selling opportunity around 83.5 zone, after USOIL breakout of the uptrend at 4h frame we will consider selling at the retracement once we receive any bearish confirmation.
Trade safe and use proper risk management.
Joe.

Technical analysis update: WTI oil (26th October 2021)WTI oil continues to rise along with other commodities. Recently, USOIL reached our short-term price target of 82.50 USD and then our medium-term price target of 85 USD. In light of these events we would like to change long-term price target of 90 USD to medium-term price target. In short-term we remain neutral as price of USOIl remains overvalued at the moment. Because of that we would not be surprised to see shortlived correction in WTI oil. Despite that we continue to be bullish on USOIL as rising demand and other fundamental factors support bullish case for it.
Technical analysis
RSI continues to move sideways in overbought territory. Its current value suggests that price is due to correct which would be very healthy for oil before next climb to 90 USD per barrel. We await reversal in RSI which will be accompanied by selling pressure. However, Stochastic and MACD remain bullish. Though, MACD loses momentum. ADX continues to grow which suggest that bullish trend is very strong and it is possibly nearing its peak.
Suport and resistance
Short-term support sits at 82.50 USD while short-term resistance sits at recent high of 85.39 USD. Support 1 lies at 80 USD and Support 2 sits at 76.95 USD. while Support 3 appears at 74.21 USD. Then major support sits at 61.58 USD.
Disclaimer: This analysis is not intended to encourage any buying or selling of any particular securities. Furthermore, it should not serve as basis for taking any trade action by individual investor. Your own due dilligence is highly advised before entering trade.

WTI watch out for a reverseWTI is for now still in strong move up and it wouldn't be a good timing to short now.
However i would look out on continuation into the 85$/90$ long term resistance in order to try for a short trade.
Before entering i would wait for the MACD to turn red and upper BB to start closing, until this 2 conditions are not meet, there is no question to short this market. Lower target would be to pullback into 76$ support area.
This will be interesting to follow next week.

WTIUSD 11 Feb 2021Looking at breaking major resistant trendline or bounce back down?
What do you think?
Fundamental: after last year oil price , future price crashing, all price reset and FRESH HIGH VOLUME buy orders trigger back!
who buying all the orders from that crash? You or institutions?
And why?
Oil price will sky rocket high! and majority people need to start rethink to use VC as alternative...
that's VC company can make large amount of profit!
Who ever sell oil good luck! Oil tanks merely stored up as backup for world logistic cargo usage... and moving into war cycle, oil will becoming more demand and ever as nation preparing oil as source of main energy to drive army force beside nuclear reactor core.

OIL Intraday. Aiming 1:10 RRRisk 1% and aiming for 10% on this trade. No indicators used. Pure price action. Like to keep my chart clean. Simply trading structure, nothing else!!
All trades closed on the same day. Entries are taken on 1 min chart. Stop loss is moved to cost after structure break. Don't chase the trades, wait for the next opportunity.
Mostly trade 12-5pm UK time NY session. Sometimes London Session. Don't like the idea of watching charts the whole day.

OIL Intraday. Aiming 1:10 RRRisk 1% and aiming for 10% on this trade. No indicators used. Pure price action. Like to keep my chart clean.
All trades closed on the same day. Entries on 1 min chart
Mostly trade 12-5pm UK time NY session. Sometimes London Session. Don't like the idea of watching charts the whole day.

USDWTI H4 - Long SetupUSDWTI H4
More major corrections are being seen now, as we pinned into that yearly high price of 76.60/barrel. Minor break and retest play was being seen as we trading amongst our interim zones.
However, a healthy correction to see us pullback between our 50/618 fib support would tie in nicely with previous S/R and could set us up nicely for a long position with the potential to break resistance and eventually set these new highs.

WTI Oil can correct to 70 zoneYesterday, after a short-lived spike above 76, WTI reversed strongly confirming this zone as strong resistance
A deeper correction can follow from this point and we can look to sell rallies under 76
A daily close above resistance would negate this scenario
