Wtiusd


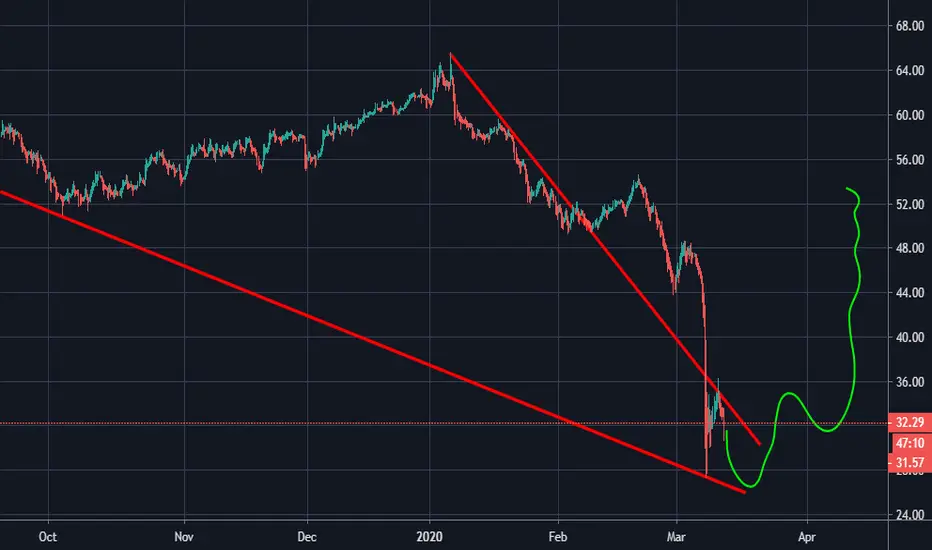

Decision time soonWe could see high 20s again if trendline breaks.
But a breakout upwards could push us back near 40 and closing the gap recently made through the drop.

OIL - the commodity they are killing for...If the oil would drop through the blue line, I start to believe that 10 dollars per barrel is coming next.Fractals in oil. What would happen in the world to send oil to 10 dollars? ..the commodity controlled by three men only... Black gold. :) Anyway, not looking good for oil... Do not take it too seriously, but consider it. Have fun, trade with smile folks.


Oil still fun with my chart hue hue ( CrudeOil )Oil still fun with my chart hue hue ( CrudeOil )
So good entry for buy.
1st buy Entry 47.84
2nd buy Entry 46.00

Buy Oil Below 50, Target: 55Waiting for long stops around 49-49.5 to get hit, with initial TP at 38.2 fib near 55 psychological level, and 2nd TP at 61.8 fib. Most likely it will go go ranging here in 50 psychological level for some quite time before rallying soon after being oversold especially with the risk of corona virus spreading being more controlled now compared to 2 months ago.
editorial.fxstreet.com
Need to be cautious still though because markets are generally still risk-off now which is fundamentally bearish for oil and a continued slide down to 42 is highly probable.
Daily:
Weekly:


GbpUsd long2 entries for long on the pair
TP and Sl updated
kindly like and share
check out my previous analysis on usdchf

USOIL - wait pullback and then down to 50.60 The minor pullback is expected to follow this quick and huge drop.
After that another leg down to follow to finish the whole WXY sideways correction.
Y should tag the former low of W at 50.60 at least.


Oil. WTIUSD Reversal soonI also do not think we are finished moving down with Oil. I think we are in a complicated expanding ending diagnol and can reach $47 range in a week or so

WTI - Sell 30/01/2020Friends, please before reading, support this idea with your Like and any Comment, thanks.
You can sell WTI from 55-56
Stop-loss at 57
You will find more trading ideas in SAV Finance community.

West Texas Oil updateANALYSIS ON WTICOUSD
Welcome to my analysis
-
1HR CHart
-
Interesting Point of interest In the West Texas Oil.
- Price below 200 day EMA.
- look for sell signals.
- Watch top for sell.
- Watch line for break out to the downside.
- MACD showing bearish divergence
Stay Tuned

WTIUSD - LongSince 1st Nov 2019 until now, there were 3 times price bouncing regarding the RSI(14) at level of 45.
There is a potential that the price possibly bounce this time. Besides, the price is above MA200, basically we are following the trend.
Trade with care, this is just my opinion sharing to you guys !
Cheers

rig .. not a bad middle east conflict hedge.Rig in an interesting spot.. put some marks on the chart that show what i imagine may happen depending on outcome. Tuff saying how it all works out. appears rig will respond though.
Kinda fun game.. Calls were on sale today! maybe puts on sale tomorrow?


OIL WTI BUY/LONG OPPORTUNITYOil has broken out of the local resistance (The red dashed line).
Longing a 40% portion and then also waiting on the daily close. If we manage to close above the dashed line I will go long further.
Will state targets once the daily closes.

USOIL could hit 62.50-64.50 to complete correction62.50 is where the 1.272x in y (white)
64.50 = 1.618 of x in y (white)
