FILL UP YOUR CARSAs you can see price is sitting at good support and has had its 3rd bounce off a well respected trend line... so we are going long.
Run out and fill your cars up now if you don't want to be ripped off ;p maybe take a few tankers and fill them up also so you can sell fuel at a premium price when prices do rocket ( don't do this as I'm sure there is laws against it... or if you do it don't get caught ;p ) This is just my business brain working overtime haha.
Wtiusd

Crude Oil sell opportunity Bearish RSI divergence and strong resistance line signaling the oil price to go down. It is relatively risky trade because of the going against the strong up trend.

WTICOUSD SELL (WEST TEXAS OIL - US DOLLAR)Hi there. Price is forming a continuation pattern to the upside. But first price needs to complete one more move to the downside.
So, watch strong price action at the current price for sell.
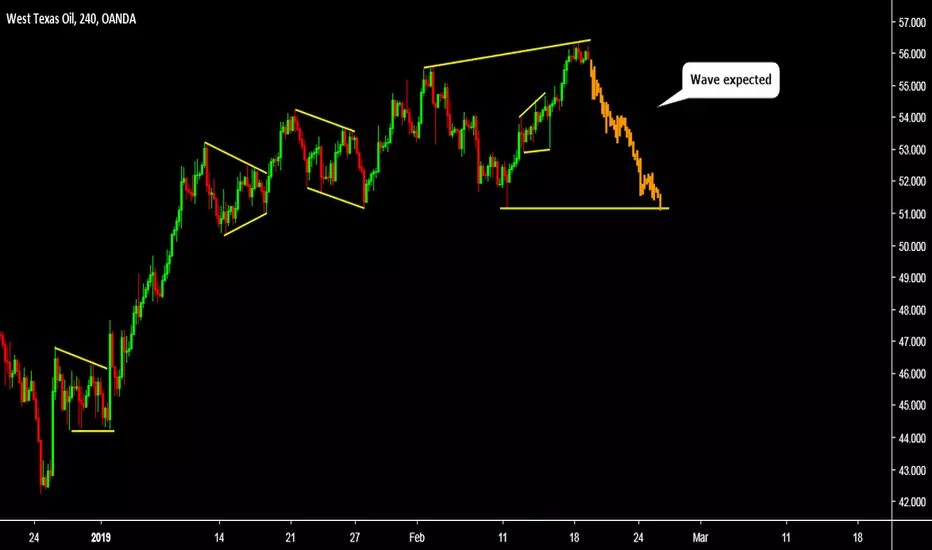
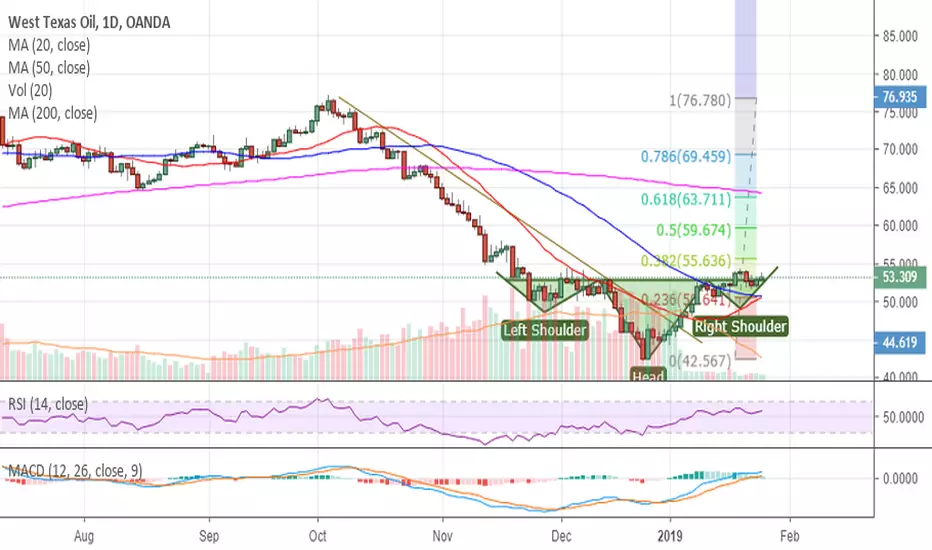
Crude Oil Technical Analysishere looking at wtiusd daily chart we have a weak head and shoulders pattern forming with a support and resistance line at 54.6 but i also added a supply and demand levels to the mix of where price might turn at and where i will be looking for buys.

Crude Oil, bullish run is starting. WTIUSD BUYCrude oil started dropping since Feb 4th, and now I believe it is great price for trend reversal. Supporting zone of 52$ is holding oil price really well. Trend line is holding the price really well too. Elliot ABCDE correction is now over, so big movement can be started by now.

OIL THOUGHTSFOMC in yellow
EIAs in light red
Still bearish AF this year but looking for perfect short

2 BTC to 20 BTC Trading Challenge - Day 31 (0.3718 BTC)Disclaimer: If you are primarily interested in copying other people’s trades then this is not for you. However, if you are willing to put in the work that it takes to learn how to trade for yourself then you have found the right place! Nevertheless please be advised that you can give 10 people a profitable trading strategy and only 1-2 of them will be able to succeed long term. If you fall into the majority that tries and fails then I assume no responsibility for your losses. What you do with your $ is your business, what I do with my $ is my business.
Click here for my Comprehensive Trading Strategy | Click here for my Comprehensive Trading Process | Click here to learn about the 2 BTC' to 20 BTC' Trading Challenge
Over the past week or two I have not seen any setups that interest me. I am wanting to get this challenge back on track and my hands were tied while there were not any desirable entries.
Doing this challenge publicly makes me feel anxious to get back into positions but I know that becoming impatient is the last thing I can afford to do right now. To ensure that is not happening I have been significantly decreasing exposure and trying my best to wait for the best possible setups.
Once I see a setup that I really like then I am waiting an extra day before entering and then I am preferring to use stop entries to make sure market is moving in my favor. Trading can be a fickle bitch and it is very much a game of: what have you done lately? It is one thing to not be results oriented while trading, but if taken too far that can clout judgement and cause delusional beliefs in one's ability.
I try my best to always remain objective and that requires constantly examining / learning from my mistakes. There were certainly some significant mistakes that were made over this past month that I am paying close attention to.
January Worst Dressed Trade
USDTRY
I got overconfident and overexposed myself before the trade moved in my favor. I love starting small to test the market and make sure that it is heading in my favor, then only adding once I have increased confidence in the trend. In this case I started with closer to 50% of my desired position size than 5%. On one hand I do not want to be results oriented, because this did have a very high probability of success and when trading hyperwaves buying a pullback to phase 3 is the best entry. 85% of hyperwaves in phase 3 go onto complete the cycle. On the other hand this one was a bit funky and I firmly believe it was a mistake to enter the position size that I did that early on in the game.
The large majority of my losses over the past month have come from being bullish the dollar and bearish the stock market. I am tentatively starting to turn bearish the USD and I am staying tf away from the stock market until I understand more what is going on there. Gold, Silver and Palladium are very, very interesting right now. I am expecting a 1 - 4 week pullback from here and will be hoping to find high probability long entries during that time.
Open Positions
Short XRPUSD
Exposure: 1,000 XRP / 0.081 BTC
Price: $0.30791
Stop: $0.27784
Risk: 9.76%
Short USDJPY
Exposure: 0.04 lots / 1.1782 BTC
Price: $108.79
Stop: $110.056
Risk: 1.06%
Pending Orders
(1)
LTCH19 stop buy entered on 1/30
Exposure: 27 LTC / 0.24867 BTC
Price: 0.00921
Stop: 0.00824
Risk: 10.53%
(2)
Stop order to long WTIUSD entered on 1/31
Exposure: 0.12 lots / 0.195 BTC
Price: $55.26
Stop: $51.39
Risk: 7%
Watchtower
XAU
Notes: Weekly green 9. Bear div in daily RSI, as well as ADX, while price tests major resistance. Massive resistance from $1,305 to $1,355. If breakthrough $1,355 then retesting ATH’s seems very likely. If not then this could pullback sharply to the $1,200 area. Pumping to $1,350 and then forming a c&h would be ideal.
Gameplan: Watching for 1-4 week correction after the 9, thinking it could form c&h. Weekly close > $1,355 is my signal to fully enter.
XAG
Alerts: Symmetrical Triangle
Notes: Testing cluster or resistance from horizontals & TL’s. On weekly green 9. Daily RSI bear div.
Gameplan: Watching for 1-4 week correction after the 9, thinking it could form Big W. Throwback to TL is another ideal entry.
ETHBTC
Patterns: Looks like 5 waves + ABC correction
Notes: Watching 3D Consensio + Stochastic. Love seeing spike and then retrace to bullish L MA. BTC market cap dominance at crucial area, could be forming descending triangle. Watching W S MA & bearish D L MA. Weekly golden cross at support.
Target: 0.065 if break triangle to upside
Gameplan: Watch D M MA + 2.5 week bear TL. Should be plenty of resistance from 0.032 - 0.034 to provide favorable entry.

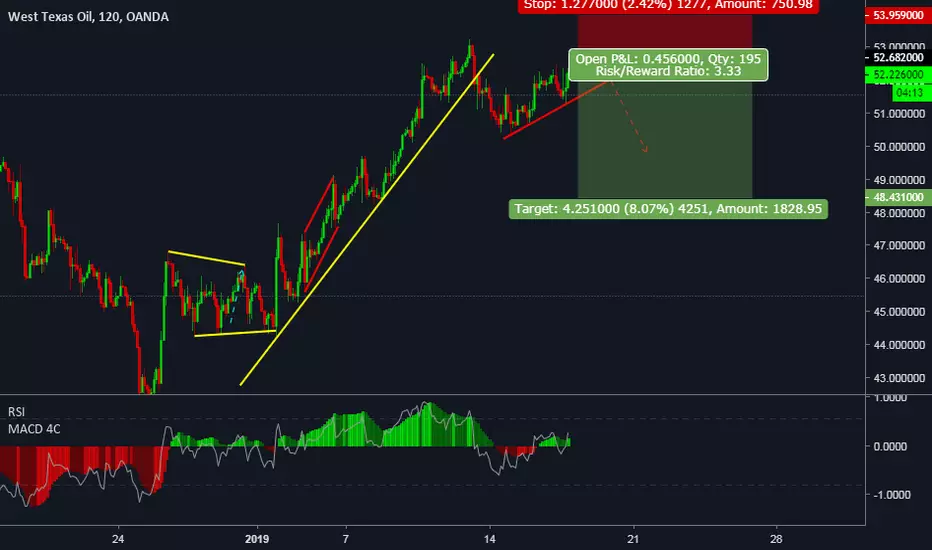
WTI - Oil looking great for a long here I have a larger play in the setup as well but do like this on a shorter time to grab a little extra cash here.

WTIUSD - Inverse head and shoulders? DXY and FOMC catalystsWTIUSD - Inverse head and shoulders? DXY and FOMC catalysts next week. Watch for break over $54.50 on WTI and target .618 Fib level. Depending on FOMC statements on rates, DXY could get saved here or go down more. EIA report Jan 23rd build of 7 Mboe vs 1MBoe expected build. Good luck!
WTI Crude Oil I H&S patternHere is a trade on crude oil. Very simple, an inverted H&S pattern with a bullish divergence on the RSI and Stoch.
Will wait for the right shoulder to fully form.
Have a buy order set in at $50.4 with another buy order set in at $49.8. Once the neckline is broken (54.6) I will then buy even more.
TP targets:
1 - 58.10
2 - 63.8
3 - 65.7
Stop loss at: 49.5


WTI Road Map The last analysis gave us a practically perfect target with big profits and a life saver for an early mistake. Now we have enough information to create a guide map for the following months.
The way in which the price interacts with the "Key Zone" will be essential to maintain the validity of this analysis. If so, we could be touching at the beginning of March the cluster of 60.
We must keep an eye on the news and geopolitical movements that may influence the development of this analysis.
Best wishes to all.


Still eyeing Oil for a longThink oil could find strength here with 200 EMA support and wave 4 nearing completion

Selling oppourtunity in US OIL at 1Hr chartFormation of Head and shoulder is about to happen
Potential 1st Take profit at 48.100
Potential 2nd Take profit at 47.000

My Optimism has been knocked off a cliffMy previous call was very optimistic but damage has been done. My view of market has flipped and the trend has changed!

WTICOUSDWeekly indicators are oversold on 1hr
If there should be a trend shift it should be now
Next support area is around 26 usd
A hedge trade on both sides with a tight stop loss will be a good idea here

The market is ALIVE for one last move higherThis is by far the BEST video that will line everything up for you by me. I gave it MY ALL with trend analysis and elliott wave. be ready and spread this video within 48 hours to help everyone for this last move higher.

WTI Crude Oil OPEC next meeting at 6th of December, Production cut is on the table + possible correction, target 1. 52.00 target 2. 54.00 target 3. 56.00


WEST TEXAS OIL / LONG OPPORTUNITY / H1WTIUSD
Trading Bias: Long
Technical Strategy: Support level + Wave Indicator Divergence + Falling Wedge
Check related idea also.

WTIUSD - Crude Oil. Not yet long, but soon..Price action next couple of days will dictate position. Neutral in next 12 hr. Lean bullish next 24-48hr.
