USDCAD Finishing up the X wave Looking for a big ShortUSD/CAD is about to reach the end of the X wave and it is common for it to retrace to .618 of the W Wave. I'm looking to short at 1.343 and I'm expecting price to reach the major trend line to finish up the Y wave.
This is also going to have an effect on Eur/Cad. While USD/CAD has been moving up the X wave, EUR/Cad has been consolidation. Once Usd/Cad finishes going to X, Eur/Cac can finish up it's B wave. I will link the EUR/CAD idea.
Wxy

BTC:USD WXY Correction 2013-15 & 2017-19 ComparisonSummary:
2013-2015 and 2017-2019 bear markets show a similar WXY count supported by a Schiff Pitchfork lower warning line hit and Fib Retracements confluences.
WXY Count & FIB Retracement:
Measured from the A wave of the W count, both the W wave and Y wave extend 1.272 in 2013-15 Bear Market. Similarly, measured from the A wave, both the W wave and Y wave extend 1.618 in 2017-19 Bear Market.
FIB Confluence:
In the ABC correction for the Y wave count in 2013-15 Bear Market, wave B extends .50 Fib and bottoms at the .786 extension creating a confluence at the 1.618 retracement. Similarly, in the ABC correction for the Y wave count in 2017-19 Bear Market, wave B extends .50 Fib and bottoms at a 1 to 1 extension creating a confluence at the 1.618 retracement.
Schiff Pitchfork:
The 1.272 retracement creates a confluence with the Schiff Pitchfork lower warning line (two standard deviations away from the mean). Similarly, the 1.618 retracement creates a confluence with the Schiff Pitchfork lower warning line (two standard deviations away from the mean).
Forecast:
Sideways movement to test the median line. More sideways movement to break through the median line, test it and finally break through the upper warning line, test it, find support and confirm a Bull Market Run.
Invalidation:
A rejection by the Median Line in the Schiff Pitchfork or any of the standard deviation lines or price is unable to cross and find support above 6,400 and/or cannot find support at the 200 Week Moving average as it retests it and breaks 2018 December Lows will trigger an WXYXZ correction pattern.

Aud/Chf buy setupLooks like a head and shoulders, but counts out incomplete in my opinion. Those are the 200 and 800 MA's crossing on 4hr. I would want to basically see a small flat. If it breaks the high of "W" it can then drop down but it has the potential to break the other high (see 1.236 extension).


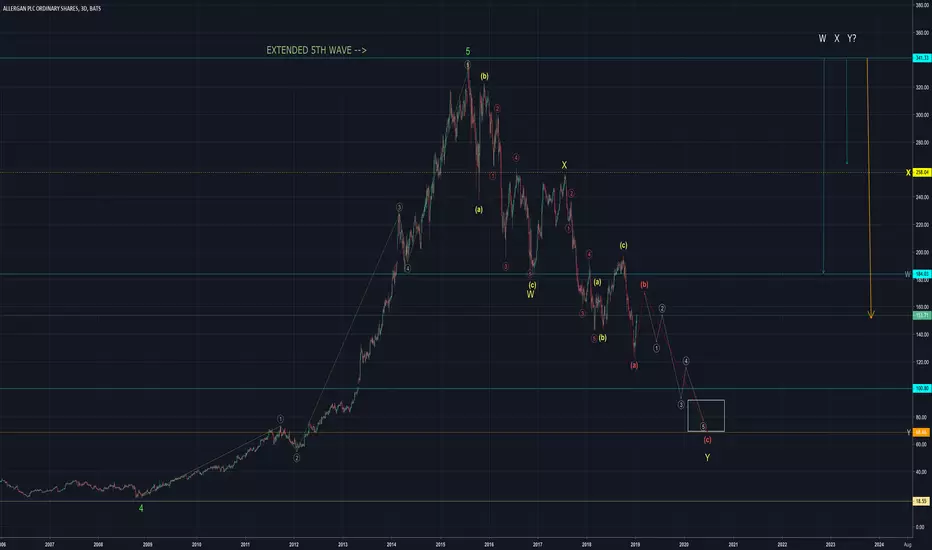
EUR/CAD (W,X,Y) Elliott Corrective PatternI was able to spot a few key rules for why this might play out the way it shows. Starting from the high on March 2018 we can begin to line up our WXY pattern. Within that WXY Corrective waves, you can find the ABC correctives. I'll leave you to interpret how you see those but I left them out to make the chart look cleaner.
- If you look at Fibonacci drawn from the High in March 2018 (0) to the Low in August 2018 (W) you can see that (X) has retraced to the .618. (You will have to place this fibs on your own as well. I have left it out to keep the chart clean.)
- Using the Fibs Extension from (0) to (W) to (X) you can hope that price will hit the .618 retracement and that will complete the (A) wave for the (Y) correction.
- The (Y) wave would be finished up at the purple resistance line. This is a resistance that has been tested for 2 decades. I've also used the distance measured from the first (0) to (W) wave to measure the (Y) wave.
PS: I'm still very new to this so I know my terminology or TA might be wonky but I hope I get some constructive criticism as in confirming my analysis or showing me a way in which I'm wrong.

EUR/CHF 1DSome view on Eur/Chf possible setup in couple of days of impulse and correction pattern. In wave C I see 3-3-5 formation is heading to complete on 4H chart, and price could possibly going down.

CHF/JPYChf/Jpy appears to be exactly following a bars pattern taken from CAD/SGD's recent correction on 4hr, take a look for yourself. It already broke trend line and is at the point in the pattern that the next move out should be the breakout to break last high, and a little more. Should it break the low again, I would anticipate a better buy from the 108-108.75 area, possibly a little lower, but that would be too easy and the bars pattern looks beautiful. Once it actually breaks out and takes off, trail your stop. Not necessary to risk that many pips.

Eur/Usd nice potential setup formingIf Eur/Usd continues to make a 3 wave corrective structure here, I would look to take it from the 800ma (blue) to the 200ma (red) on the daily.

BTC primary countBTC looking close to finishing this complex correction, hard to say if its a 2 wave or a B, my larger count suggests this is still a B wave and we will end up making a lower low and testing 3k. However it always remains possible to break impulsively up and if thats the case we should see quite a bit of strength on the next move. Order blocks daily and 4 hour are noted and the falling wedge stands out nicely. Ideal trade is the retrace on the break of the falling wedge. The strategy would be to wait for the breakout and buy the first pull back on the 1hr time frame with a stop at the low.

Chf/JPYMay have finished buys and be on the way down to complete a 7 swing. That would mean we have an expanded flat on 1 hr for downside. If it continues down I would expect it to probably reach 50% retracement. But if it breaks out to the upside from here I would be looking to get out of it. If it follows the path I have marked up, the buy would be the better trade.


Copper WXYAll Copper has been doing is expanding this WXY structure, but is came off the exact spot fib and pattern wise to go for Y.. Finally.

USD/MEXWho's in this sell I posted way back? Looking to go to 18.50-18.00 to break trend line more longer term.

AUD/NZDAN came off the 1.618 extension of what counts out like a wave 3 of a 5 wave move (which is typical). The 27% extension of "A" lines right up with the low that I am looking for it to break to go for the long term buy. Hoping for a wave 4 correction, and if so, then looking to short if corrective to break that low, then to buy later. Fingers crossed. Three potential trades here "IF" it completes the 5 wave...

chf/jpyComing off the 200 and 800MA's on 4hr. Will most likely break that high. Could have a correction here for an "X" wave to break trend line, then up, but I think headed to that zone.


USD/CADIf you consider UCAD to have made a leading diagonal (I do) then it just came of exactly the 27% extension of an expanded flat correction. In that case, we do not need to break the high and it can go all the way down to break the trend line from right here. The price action channel going up is very corrective and needs to at least correct itself at some point, but I think it is dropping. Everyone is looking left expecting it to make a triple combo just like the last big correction. Considering alteration of patterns I don't think it will repeat that.....

Eur/JpyEJ has looked very corrective since hitting the trend line. Could be a large buy potentially. Mat test or break Weekly mid bollinger band (20MA).

Gold | Bear BiasAs our last gold analysis was canceled but price moved accordingly and is still within great R:R, we have decided to re-engage this metal
-
Price has set itself a beautiful expanding channel pattern with an accompanying ABCDE corrective sequence. As price currently sets on (E) , we should see price slump down further
-
The bear scenario is currently accepted and the bias is confirmed
-
Price is set to head for the 1197 area, while anything over the 1230.5 level is considered invalid

GBP/JPYWatch out for GJ to break trend line and then the high. The link to my youtube channel is below. I went over posted setups on that video today for time purposes.

USD/MEX Swing reminderUMEX is currently breaking the trend line. It is in the zone. Notice that the .764 extension breaks previous high. We It is in a strong uptrend currently but can reverse at any time really looking at the price action. I marked some potential levels for limits and targets. This is a weekly swing. The idea would be to get a correction breaking trend line. If it follows this path, then we should get another nice buy in the future.
