$SNAP Bull Flag Continuation (Volume Analysis)The current volume analysis on NYSE:SNAP is indicating possible bullish continuation.
The pole on this bull flag saw increased demand as price continued higher, followed by falling supply as price consolidated within the flag. The bullish breakout would have to equal minimum 1/2 of the previous flag pole. A 100% extension could also result.
Bearish scenario is a breakdown below and negation of the bullish flag. Bearish stops should be placed below the previous low and bearish breakdown of the flag.
Wyckoff

BNB/USDT in Wyckoff "C" phaseHello,
BNB create a Wyckoff pattern like a school exaple. I follow the chart and drawet the pattern weeks before. It seems, that chart will be formed according to a regular wyckoff pattern. The chart is supported to reach the spring point by the DXY chart, that seems to make a correction in his downtrend up to ~ 102,5 - 103.
This theorie supports the fact as well, that the Crypto total market cap Chart has been rejected fhom the resistance level at 1.203T, and seems to fall to 1.03 or below.
The BNB formed in the few days a bearish flag, and the RSI and MACD shows too, that we have place for a downtrend.

GBPNZD - Wyckoff Up-Thrust and down we go!
We have hit Fib area
Fast Up Wave
and then Wyckoff Up-thrust signal -WU at the top and down we go
Correct entry already at 70 pips but I think it will continue

GBPAUD - Possible Wyckoff UpThrustSimple:
Broke a major resistance level - excellent location for a Wyckoff Up-Thrust
Price pulled back and the next up waves has a very high Speed Index of 27.9 which could mean price having a hard time to move up.
To confirm we did to break the blue line downwards to enter short
This is David's Weis quote "Trade is About to Happen" and book

EURUSD - Forecast to get to the FIb - ShortPVR high at tops = sellers at tops and no significant buying at bottoms
Fast wave up with 4.3 si - not justified probably fake
Very high of 31.5 = too muck effort little result
The forecast is to at least get to 50Fib which is 25 pips but can also get up to the blue line which is 70pips

BITCOIN Bearish Wyckoff Distribution 🚨 Supply in ControlWhales have been manipulating Bitcoin in a Wyckoff Distribution schematic since 12/5/23 (before the GBTC and FTX sell off.)
Currently:
🚨 Bitcoin dropped below bottom of Trading Range to create a Sign of Weakness in Phase D.
🚨 Bitcoin flipped the bottom of the Trading Range at $40,150 to resistance and created its final Last Point of Supply for shorts to enter.
🚨 With the CME Gap Fill, GBTC and FTX sell offs, Bitcoin is soon entering Phase E: Supply in Control where everyone realizes there is little chance of a bounce and everyone panic sells.

Bitcoin Wyckoff Distribution Returns 😱After the Bitcoin ETF was approved there was a 2nd Upthrust After Distribution to test remaining demand.
🚨 Supply was dominant and within 24 hours it was a "buy the rumor, sell the news event."
🚨 Bitcoin re-entered the Wyckoff trading range.
🚨 A small bounce created a Last Point of Supply, which is the ideal entry for a short position.

The Wyckoff Method working or no?Below is the exact distribution chart
I've written a lot about the Wakoff method, now we see one of the most standardized distributions, link
www.tradingview.com
but if you open your eyes it's distribution for some and accumulation for others - now almost every week there are reports that Black Rock has more and more bitcoins - maybe all the bitcoins are just being transferred from other smaller agents. But the bottom line remains the same big players are here and they are going to make a lot of money. The cryptocurrency market is still a small 1.5 TRL $.
In my previous posts with fractals, I stayed with the opinion that we have a blue scenario - LINK
But this is not about fractals
But after analyzing the chart and seeing the wyckoff on it I couldn't help but share it with you - publishing this post doesn't mean I believe it, but the correction looks logical - the other question is how exactly it will happen with the renewal of local highs or not.
Below I will show two distributions superimposed on the chart and they are slightly different
Whatever charts they show you on TV or other social networks, follow your trading plan, I buy back altcoins after 30% correction and wait for the final impulsive upward movement without extra passengers. I am not going to short
All these charts are for you to think, and maybe it's just another horizontal correction and after it the upward movement will continue until September 2025.
Best regards EXCAVO
📈 Bitcoin Analysis: Power of Three Pattern Bitcoin has been navigating within an ascending channel, respecting both the upper and lower boundaries. The recent execution of a manipulation strategy, aligning with the Power of Three pattern, involved a precise move beneath the lower trendline. This maneuver is anticipated to capture liquidity and set the stage for a rapid ascent. The expectation is for a bullish move towards $48,000.
🔄 Ascending Channel Dynamics:
Bitcoin's adherence to the ascending channel underscores the prevailing bullish sentiment. The market has consistently respected both the upper and lower boundaries of the channel, highlighting a balance between buyers and sellers within the established trend.
📉 Power of Three Pattern and Manipulation:
The execution of a manipulation strategy beneath the lower trendline aligns with the Power of Three pattern, a technical formation characterized by three distinct drives or phases. This maneuver, involving a move beneath the lower boundary, is designed to trigger stop-loss orders and capture liquidity from unsuspecting market participants.
🔍 Liquidity Grab Strategy:
The manipulation-driven move beneath the lower trendline serves a dual purpose: disrupting the established channel and providing an opportunity to grab liquidity for a swift upward move. This strategy aims to create favorable conditions for accelerated growth once the manipulated liquidity is absorbed.
🚀 Anticipated Upside Move:
The manipulation-driven liquidity grab sets the stage for a potential rapid ascent. Assuming successful absorption of liquidity and a shift in market sentiment, the target of $48,000 becomes plausible. This level represents a significant upside potential, given the strategic nature of the manipulation maneuver.
💡 Trading Strategy:
Traders should closely monitor Bitcoin's price action following the manipulation-driven move. Confirmation of absorption of manipulated liquidity, increased buying interest, and a sustained move above key resistance levels would provide favorable conditions for entry. Implementing stop-loss orders to manage risk is advisable.
🔮 Future Outlook:
The technical analysis suggests that Bitcoin is poised for a potential bullish move following the manipulation-driven liquidity grab. Traders should remain vigilant and adapt their strategies based on real-time market data. The dynamic nature of the cryptocurrency market emphasizes the importance of flexibility and risk management in trading decisions. A successful absorption of liquidity could pave the way for accelerated growth towards the $48,000 target.

WYCKOFF - A BITCOIN MOVE I have been trading this Macro pattern since before 2023 started, with the knowledge of the TRICH matrix (A Investment cycle theory invested by George Tritch) that stated that the time to buy Assetts due to the beginning of a new cycle. This cycle comes to a head in 2026.
Therefore with ths knowledge accumulating BITCOIN due to its performance history was the best approach. Here we can see the Pattern playing out perfectly, and where the 'current' position may be.
Additional to that, is recently the way 'MEDIA' trys to manipulate markets, especially retail into providing liquidity aka 'Dumb money'.

#My #SAND #Short #Order #Activated #Eddy#My #SAND #Short #Order #Activated #Eddy
It's My SAND Short Order is Activated <3 Enjoy ;-)
Also Its time to dump crypto, You Can Short Any Altcoins too ;-) Have a Good Night <3

#BTC #New #Short #Order #Activated #Eddy#BTC #New #Short #Order #Activated #Eddy
It's My New Short Order is Activated <3 Enjoy ;-)
Related Relevant Analysis of Bitcoin : (( BTC/USD )) : Check Link :

GBPAUD Time to Short - Speed Index AlertThe story :
In that huge up wave there were sellers! Why? Speed Index is telling us why. That was a hard time to move up wave 18.2 SI at the top is Effort vs Result (Wyckoff ) . The average Speed Index is 10.5 therefore the 18.2 is an Abnormal SI. If we break the beginning of the 18.2 wave downwards 1.92627, we are going down.

AUDUSD - Let's get to that Fib Long
Buyers have stepped in. High Up Volumes green is everywhere.
That last down wave with high volume has a high Speed Index 16.4, that's hard to move down
Plutus signals also Long
We should be reaching at least he Fib area

[ETH/USDT] Confirmed accumulationAfter the breakout of the trading range with strong volume indicating presence of a bigger demand, now we are at the level of testing the resistance in the Wyckoff literature this is called jump across the creek which is a higher low above the trading range now our bias is 100% confirmed

I Don't Always Chart Distributions, But When I do, I WYCKOFFHe wouldn't be afraid to show his Bullish side, If he had one.
His mother has a tattoo that reads... Bear.
On the Crypto markets, He's allowed to touch the coin.
He is, the most bearish man in the world.

#BTCD #BITCOIN #DOMINANCE #Crypto #Market #DUMP #Soon #Eddy#BTCD #BITCOIN #DOMINANCE #Crypto #Market #DUMP #Soon #Eddy
(("My analysis of BTCD"BITCOIN DOMINANCE" is like this, from my point of view, it is possible to track the position of short selling transactions on most currencies in the market."))
- What do you think? Have you checked BTCD in this time frame? Write me in the comments!
- My confirmations are based on Wykoff's review of Bitcoin in multi-time frame, as well as Bitcoin and Tether's Dominance review.
Its about Wyckoff ;-)
Also My Short Setup is Activated ;-) (( BTC/USD )) latest published chart link :

Wyckoff Schematic #1: Distribution for #BTC USDBlackRock is making a big move into Bitcoin with an ETF aimed at wealthy baby boomers. They are a huge financial company with $9 trillion in assets under management. BlackRock bought 11,500 Bitcoins, diving into the market, expecting a big comeback.
Despite the leviathan's moves, market's reaction to ETF approvals is erratic. The market is reacting to rumors with schizophrenia. Bitcoin's price drops below $43,000, and traders don't seem to be reacting much to the ETF rumors. This "sell-the-news" effect is not a sign of a positive This isn't a sign of a strong trend. It's the sound of uncertainty. It's like the crowd leaving the theater before the play is over.
And there's more. The delay in the Ethereum ETF by American bank TD Cowen disrupts market optimism. It shows that not everything is good in the rules, and not every opportunity in crypto will be accepted. This news alone could start a bearish turn. It may lead to $40K support being seen as a trapdoor to lower lows.
The market sentiment has become neutral after ETF, and it's like the calm before a storm. The dip under $42,000 is not a discount—it's a warning shot. Traders eyeing support at $40K might find themselves not at the bottom. It's a precipice with a market ready to capitulate.
Now, let's turn our gaze to the two scenarios laid out before us in the tale of two charts.
If we keep going down, the Wyckoff Method shows that we're in for a big surprise. This isn't a methodical distribution. It's a tactical retreat by smart money. Retail holders are left to play a game of musical chairs. The music has stopped and there are no chairs left.
If we surge up, breaking resistance, the recent top at $49,000 might be just a pitstop. It could be an 'Upthrust' (UT), followed by 'Upthrust After Distribution' (UTAD). This wouldn't show a market going back, but a market getting ready to jump past $50,000 like it's easy.
The market is at a turning point. Big forces are pulling in different directions. BlackRock getting into Bitcoin could have a big impact, either positive or negative. It's like a potential leader who might guide people in the wrong direction. The charts show caution. The news indicates change. The best strategy prepares for volatility with strong logic and risk control.
Prepare for the worst, hope .
To make the most out of it, just remember that the world of cryptocurrency is always changing. So, stay grounded and embrace the fact that change is the only constant. In the world of cryptocurrency, things always change. There's a chance of a big crash or a huge rally, and the risks are very high.
The aggressive play here involves more than just looking at charts and news. It's also about understanding the situation. The smart money, the institutions—they're making their moves in broad daylight. If the market goes up again, BlackRock's buying of a lot of Bitcoin when the price was low could be a great move. It shows that the current prices might just be a phase before a big increase. This isn't just how the market works. It's like a very risky game of chess, but with digital money.
If the market turns bearish, the Wyckoff structure may lead to a landslide. This would serve as a stark reminder of the law of action and reaction. The crash, if it comes, will not be gentle. When the market turns and support levels weaken, it will show how harsh markets can be.
In this volatile mix, the news of ETF approvals and delays is like throwing gasoline on the fire. It's the kind of fuel that could either ignite the market to new heights or burn the hopes of many to ashes. After ETF approvals and delays, market sentiment is uncertain. It can either lead to a big change or signal a surprising move.
This is not a market for the indecisive. This market is for people who are brave enough to handle a big drop or are sure enough to go along with a big increase. As news comes out, the story changes, and this makes the future of Bitcoin more mysterious.
In such times, be aggressive. Don't just watch, be actively prepared for contingencies. Keep your eyes wide open, your decisions data-driven, and your investments diversified. The big crash, if it's on the horizon, will be ruthless. The big rally, if it's in the cards, will be exuberant. The winner pivots with precision. They are backed by insight and unshaken by crypto currents. Proceed with caution, but proceed nonetheless. This is the world of crypto. Here, the courageous succeed and the cautious endure. Choose your path wisely.
school.stockcharts.com

#USDTD #AltCoins #Short #Crypto #Market #DUMP #Soon #Eddy#USDTD #AltCoins #Short #Crypto #Market #DUMP #Soon #Eddy
(("My analysis of USDTD and altcoins is like this, from my point of view, it is possible to track the position of short selling transactions on most currencies in the market."))
- What do you think? Have you checked USDTD in this time frame? Write me in the comments!
- My confirmations are based on Wykoff's review of Bitcoin in multi-time frame, as well as Bitcoin and Tether's Dominance review.
Its about Wyckoff ;-)
(( BTC/USD )) latest update link :

#TOTAL2 #AltCoins #Short #Crypto #Market #DUMP #Soon #Eddy#TOTAL2 #AltCoins #Short #Crypto #Market #DUMP #Soon #Eddy
(("My analysis of Total 2 and altcoins is like this, from my point of view, it is possible to track the position of short selling transactions on most currencies in the market."))
- What do you think? Have you checked Total 2 in this time frame? Write me in the comments!
- My confirmations are based on Wykoff's review of Bitcoin in multi-time frame, as well as Bitcoin and Tether's Dominance review.
Its about Wyckoff ;-)
(( BTC/USD )) latest update link :

#BONE #Wychoff #Distribution #Eddy#BONE #Wychoff #Distribution #Eddy
(("All the relevant areas and explanations on the chart are clear and clear, the trading setups need to get confirmation to enter, if you don't know how to get a trigger and confirm entering into transactions, this analysis is not suitable for you, the above analysis is for professionals. and if you are a beginner, my suggestion is that you don't destroy your capital and first learn technical analysis and basic trading along with psychology and risk and capital management from reputable sources and courses, and then enter the financial markets."))
(("The above analysis and setups and points and areas are combined with most of the combined styles such as price action, supply and demand, RTM, ICT and also with the analysis of important indicators such as Dominance Tether and Bitcoin.
If you are familiar with the mentioned styles and know how to get approval to enter the above styles, use the above analysis.
This is not an investment proposal and only my opinion, please act based on your experience and decisions."))
~~~~~~~~~~~~~~~~~~~~~~~~~~~~~~~~~~~~~~~~~~
I also suggest you to view my #Analysis of the Phases of Richard #Wyckoff #Accumulation & #Distribution on #Bitcoin #Currency from the link below :
#BTC #Bitcoin #Final #Update #Wychoff #Distribution #Eddy
~~~~~~~~~~~~~~~~~~~~~~~~~~~~~~~~~~~~~~~~~~
Analyses of Trading Ranges By : Dr. #Eddy SunShine 👨🏻💻 1/16/2024 ❤️

HOW TO: Lesson 5 - The Importance of ConfluenceLesson 5 - The Importance of Confluence
This video explains what is confluence in trading, identifies confluence structural elements and provides guidance on how to put all the pieces of the puzzle together to increase trading success rate.

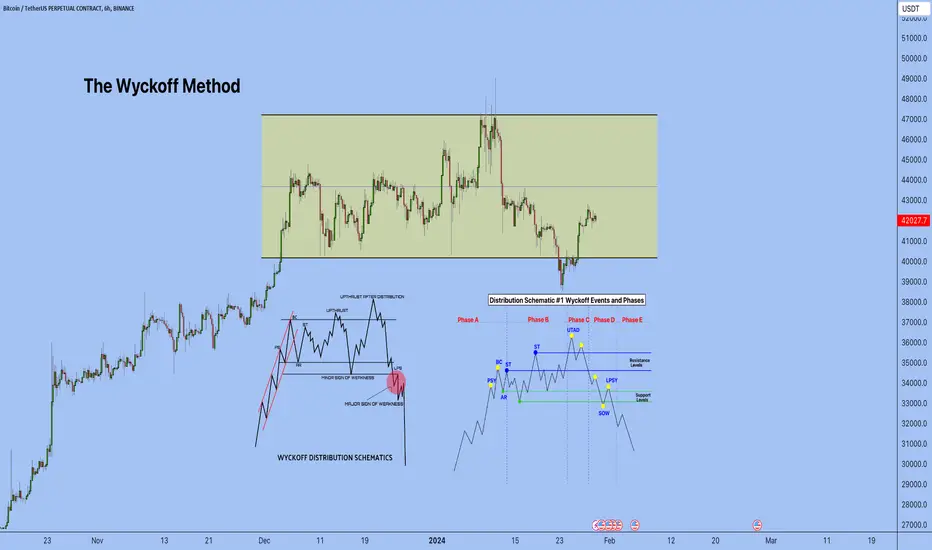
I LATE PUBLISHED THIS, BTC wyckoff schematic #1:Brace yourselves! The chart is a crystal clear warning siren for an impending crash in the Bitcoin market. What we're seeing here is the textbook setup of a Wyckoff distribution phase, a manipulative masterpiece played out by the smart money to trap unsuspecting retail investors before the rug is pulled.
Phase A was just the smart money dipping their toes, testing the waters for liquidity. Phase B, the buildup, was where they revved up the engines, creating a façade of a bullish frenzy, drawing in the crowd with the hype. But then, boom! Phase C hit with the Outthrust After Distribution (UTAD), the classic fake-out move. It's the smart money whispering, 'This is as high as we go, folks,' before they start offloading their bags onto the latecomers.
Now, as we edge into Phase D, the Sign of Weakness (SOW) has revealed itself. This isn't just a dip to buy; it's a cliff edge. The Last Point of Supply (LPSY) attempts are feeble, and the demand is drying up faster than a puddle in the Sahara.
And what's next? Phase E. The markdown. The avalanche. This isn't just going to be a correction; it's shaping up to be a freefall. The volume profile is whispering secrets of a sell-off that's ready to stampede. Those support lines? They'll snap like twigs under a boot. We're not just talking about testing lows; we're talking about rewriting the bottom line.
This is the moment where fortunes are lost, where the latecomers holding the line get burned. The chart is screaming caution. It's not a matter of if, but when. The crash is looming, and it's going to be cataclysmic. Don't be the one left holding the bag when the smart money has cashed out and left the building. This is your warning!
|
TO BE FORMAL AND PROFESSIONAL.
Here's a breakdown of the typical phases and events in the Wyckoff Schematic #1, as they might relate to your chart:
Phase A: This phase marks the stopping of the prior uptrend. Key elements include:
Preliminary Supply (PSY): Where large interests begin selling the coin and volume increases.
Buying Climax (BC): Where demand is fully satiated, and there is heavy buying from the public, leading to a sharp rally and subsequent sell-off.
Automatic Reaction (AR): The immediate sell-off after the buying climax, setting a range for the trading range (TR).
Phase B: This phase is characterized by building a cause for the new downtrend.
Secondary Test (ST): Where the market tests the supply and demand balance at the upper and lower bounds of the TR established in Phase A.
Upthrust (UT): A test above the TR that fails and falls back into the range, showing that demand is not strong enough to break through the supply.
Phase C: This phase indicates the readiness to leave the TR and begin a new downtrend.
Upthrust After Distribution (UTAD): A sign of weakness, where price goes above the TR again but attracts heavy selling from the smart money, confirming they are distributing their holdings.
Phase D: The price begins to move downward as the distribution phase is ending.
Sign of Weakness (SOW): Price action that moves below the support level of the trading range, suggesting that supply is overwhelming demand.
Last Point of Supply (LPSY): The final attempt to move up into the TR, which fails due to lack of demand.
Phase E: This is the markdown phase where the price declines.
The chart depicts a series of lower highs and lower lows, consistent with a bearish trend.
The annotations on your chart suggest that the analyst is anticipating a bearish market based on the Wyckoff distribution phases. They have marked out specific events and are forecasting a continued downtrend into the future phases (D and E). It's important to note that while Wyckoff's methodology is respected among some traders, it's not infallible and should be used in conjunction with other forms of analysis and risk management techniques.
The chart also includes some narrative annotations about market events, like SEC announcements, which the analyst is using to support their interpretation of the price action within the framework of the Wyckoff Method. These external factors are used to give context to the price movements and potentially indicate the actions of institutional investors.
I hope I was early to warn everyone but I did, just forgot to do it here in TradingView.
