Wyckoff Distribution Schematics 2Phase A: Phase A in a distribution TR marks the stopping of the prior uptrend. Up to this point, demand has been dominant and the first significant evidence of supply entering the market is provided by preliminary supply (PSY) and the buying climax (BC). These events are usually followed by an automatic reaction (AR) and a secondary test (ST) of the BC, often upon diminished volume. However, the uptrend may also terminate without climactic action, instead demonstrating exhaustion of demand with decreasing spread and volume; less upward progress is made on each rally before significant supply emerges.
In a redistribution TR within a larger downtrend, Phase A may look more like the start of an accumulation TR (e.g., with climactic price and volume action to the downside). However, Phases B through E of a re-distribution TR can be analyzed in a similar manner to the distribution TR at the market top.
Phase B: The function of Phase B is to build a cause in preparation for a new downtrend. During this time, institutions and large professional interests are disposing of their long inventory and initiating short positions in anticipation of the next markdown. The points about Phase B in distribution are similar to those made for Phase B in accumulation, except that the large interests are net sellers of shares as the TR evolves, with the goal of exhausting as much of the remaining demand as possible. This process leaves clues that the supply/demand balance has tilted toward supply instead of demand. For instance, SOWs are usually accompanied by significantly increased spread and volume to the downside.
Phase C: In distribution, Phase C may reveal itself via an upthrust (UT) or UTAD. As noted above, a UT is the opposite of a spring. It is a price move above TR resistance that quickly reverses and closes in the TR. This is a test of the remaining demand. It is also a bull trap—it appears to signal the resumption of the uptrend but in reality is intended to “wrong-foot” uninformed break-out traders. A UT or UTAD allows large interests to mislead the public about the future trend direction and, subsequently, sell additional shares at elevated prices to such break-out traders and investors before the markdown begins. In addition, a UTAD may induce smaller traders in short positions to cover and surrender their shares to the larger interests who have engineered this move.
Aggressive traders may wish to initiate short positions after a UT or UTAD. The risk/reward ratio is often quite favorable. However, the “smart money” repeatedly stops out traders who initiate such short positions with one UT after another, so it is often safer to wait until Phase D and an LPSY.
Often demand is so weak in a distribution TR that price does not reach the level of the BC or initial ST. In this case, Phase C's test of demand may be represented by a UT of a lower high within the TR.
Phase D: Phase D arrives after the tests in Phase C show us the last gasps of demand. During Phase D, price travels to or through TR support. The evidence that supply is clearly dominant increases either with a clear break of support or with a decline below the mid-point of the TR after a UT or UTAD. There are often multiple weak rallies within Phase D; these LPSYs represent excellent opportunities to initiate or add to profitable short positions. Anyone still in a long position during Phase D is asking for trouble.
Phase E: Phase E depicts the unfolding of the downtrend; the stock leaves the TR and supply is in control. Once TR support is broken on a major SOW, this breakdown is often tested with a rally that fails at or near support. This also represents a high-probability opportunity to sell short. Subsequent rallies during the markdown are usually feeble. Traders who have taken short positions can trail their stops as price declines. After a significant down-move, climactic action may signal the beginning of a re-distribution TR or of accumulation.
Wyckoff

Wyckoff Accumulation Schematics 2Phase A: Phase A marks the stopping of the prior downtrend. Up to this point, supply has been dominant. The approaching diminution of supply is evidenced in preliminary support (PS) and a selling climax (SC). These events are often very obvious on bar charts, where widening spread and heavy volume depict the transfer of huge numbers of shares from the public to large professional interests. Once these intense selling pressures have been relieved, an automatic rally (AR), consisting of both institutional demand for shares as well as short-covering, typically ensues. A successful secondary test (ST) in the area of the SC will show less selling than previously and a narrowing of spread and decreased volume, generally stopping at or above the same price level as the SC. If the ST goes lower than that of the SC, one can anticipate either new lows or prolonged consolidation. The lows of the SC and the ST and the high of the AR set the boundaries of the TR. Horizontal lines may be drawn to help focus attention on market behavior, as seen in the two Accumulation Schematics above.
Sometimes the downtrend may end less dramatically, without climactic price and volume action. In general, however, it is preferable to see the PS, SC, AR and ST, as these provide not only a more distinct charting landscape but a clear indication that large operators have definitively initiated accumulation.
In a re-accumulation TR (which occurs during a longer-term uptrend), the points representing PS, SC and ST are not evident in Phase A. Rather, in such cases, Phase A resembles that more typically seen in distribution (see below). Phases B-E generally have a shorter duration and smaller amplitude than, but are ultimately similar to, those in the primary accumulation base.
Phase B: In Wyckoffian analysis, Phase B serves the function of “building a cause” for a new uptrend (see Wyckoff Law #2 – “Cause and Effect”). In Phase B, institutions and large professional interests are accumulating relatively low-priced inventory in anticipation of the next markup. The process of institutional accumulation may take a long time (sometimes a year or more) and involves purchasing shares at lower prices and checking advances in price with short sales. There are usually multiple STs during Phase B, as well as upthrust-type actions at the upper end of the TR. Overall, the large interests are net buyers of shares as the TR evolves, with the goal of acquiring as much of the remaining floating supply as possible. Institutional buying and selling imparts the characteristic up-and-down price action of the trading range.
Early on in Phase B, the price swings tend to be wide and accompanied by high volume. As the professionals absorb the supply, however, the volume on downswings within the TR tends to diminish. When it appears that supply is likely to have been exhausted, the stock is ready for Phase C.
Phase C: It is in Phase C that the stock price goes through a decisive test of the remaining supply, allowing the “smart money” operators to ascertain whether the stock is ready to be marked up. As noted above, a spring is a price move below the support level of the TR (established in Phases A and B) that quickly reverses and moves back into the TR. It is an example of a bear trap because the drop below support appears to signal resumption of the downtrend. In reality, though, this marks the beginning of a new uptrend, trapping the late sellers (bears). In Wyckoff's method, a successful test of supply represented by a spring (or a shakeout) provides a high-probability trading opportunity. A low-volume spring (or a low-volume test of a shakeout) indicates that the stock is likely to be ready to move up, so this is a good time to initiate at least a partial long position.
The appearance of a SOS shortly after a spring or shakeout validates the analysis. As noted in Accumulation Schematic #2, however, the testing of supply can occur higher up in the TR without a spring or shakeout; when this occurs, the identification of Phase C can be challenging.
Phase D: If we are correct in our analysis, what should follow is the consistent dominance of demand over supply. This is evidenced by a pattern of advances (SOSs) on widening price spreads and increasing volume, as well as reactions (LPSs) on smaller spreads and diminished volumes. During Phase D, the price will move at least to the top of the TR. LPSs in this phase are generally excellent places to initiate or add to profitable long positions.
Phase E: In Phase E, the stock leaves the TR, demand is in full control and the markup is obvious to everyone. Setbacks, such as shakeouts and more typical reactions, are usually short-lived. New, higher-level TRs comprising both profit-taking and acquisition of additional shares (“re-accumulation”) by large operators can occur at any point in Phase E. These TRs are sometimes called “stepping stones” on the way to even higher price targets.

Wyckoff Accumulation Schematics 1PS—preliminary support, where substantial buying begins to provide pronounced support after a prolonged down-move. Volume increases and price spread widens, signaling that the down-move may be approaching its end.
SC—selling climax, the point at which widening spread and selling pressure usually climaxes and heavy or panicky selling by the public is being absorbed by larger professional interests at or near a bottom. Often price will close well off the low in a SC, reflecting the buying by these large interests.
AR—automatic rally, which occurs because intense selling pressure has greatly diminished. A wave of buying easily pushes prices up; this is further fueled by short covering. The high of this rally will help define the upper boundary of an accumulation TR.
ST—secondary test, in which price revisits the area of the SC to test the supply/demand balance at these levels. If a bottom is to be confirmed, volume and price spread should be significantly diminished as the market approaches support in the area of the SC. It is common to have multiple STs after a SC.
Note: Springs or shakeouts usually occur late within a TR and allow the stock’s dominant players to make a definitive test of available supply before a markup campaign unfolds. A “spring” takes price below the low of the TR and then reverses to close within the TR; this action allows large interests to mislead the public about the future trend direction and to acquire additional shares at bargain prices. A terminal shakeout at the end of an accumulation TR is like a spring on steroids. Shakeouts may also occur once a price advance has started, with rapid downward movement intended to induce retail traders and investors in long positions to sell their shares to large operators. However, springs and terminal shakeouts are not required elements: Accumulation Schematic 1 depicts a spring, while Accumulation Schematic 2 shows a TR without a spring.
Test—Large operators always test the market for supply throughout a TR (e.g., STs and springs) and at key points during a price advance. If considerable supply emerges on a test, the market is often not ready to be marked up. A spring is often followed by one or more tests; a successful test (indicating that further price increases will follow) typically makes a higher low on lesser volume.
SOS—sign of strength, a price advance on increasing spread and relatively higher volume. Often a SOS takes place after a spring, validating the analyst’s interpretation of that prior action.
LPS—last point of support, the low point of a reaction or pullback after a SOS. Backing up to an LPS means a pullback to support that was formerly resistance, on diminished spread and volume. On some charts, there may be more than one LPS, despite the ostensibly singular precision of this term.
BU—“back-up”. This term is short-hand for a colorful metaphor coined by Robert Evans, one of the leading teachers of the Wyckoff method from the 1930s to the 1960s. Evans analogized the SOS to a “jump across the creek” of price resistance, and the “back up to the creek” represented both short-term profit-taking and a test for additional supply around the area of resistance. A back-up is a common structural element preceding a more substantial price mark-up, and can take on a variety of forms, including a simple pullback or a new TR at a higher level.

Feb 24 CADJPY Short-term bear before LONG PositionMTF Analysis
Monthly TF had a big push up from tapping the 38.2 Monthly Fib retracement.
On a weekly TF, this retracement bounce on a Monthly 38.2 Fib is a bull run.
This weekly TF bull run has run out right at the previous month's high, previous week's high, and prev day's high -- which was the best entry point had i done Wyckoff analysis earlier
Anyway, since price has ran out of gas on this weekly bull run, it's actually about to break the weekly/daily trendline it's been bouncing off of.
My bias is that price will retrace from a Weekly TF perspective to the 38.2 weekly fib level which also perfectly aligns with the previous week's low & an H4 imbalance/inefficiency.
Fundamentals to support my bias.
JPY had a good inflation YoY rate this morning.
CAD had some wobly numbers from yesterday's economic updates.

CADCHF Update I It will explode to the upside but be patientWelcome back! Let me know your thoughts in the comments!
**CADCHF Analysis - Listen to video!
We recommend that you keep this pair on your watchlist and enter when the entry criteria of your strategy is met.
Please support this idea with a LIKE and COMMENT if you find it useful and Click "Follow" on our profile if you'd like these trade ideas delivered straight to your email in the future.
Thanks for your continued support!

Shangai Stock Index Wyckoff AccumulationJust an idea of a book trade for wyckoff accumulation schematics #1. If global economy goes down in 2023, we will see the final spring for basically all stock markets, including the chinese one.

Wyckoff never failsDistribution in AUDCAD.
During the night we had the upthrust after distribution with a pretty high volume and then the Sign of weakness with higher volumes that confirm the bearish impulse.
We had two opportunities to enter:
1) after the utad with a tight stop (risky entry)
2) after the last point of supply a few mnutes ago ( safer but with a lowest R/R ratio.
Never stop exploring!
Drago Investments.

IOTA : Wyckoff trending idea looks promisingIOTA like many other tokens looks like playing the "Wyckoff accumulation Textbook".
Let's see if this plays out.
Note that marks signed on the chart are irrelevant with time and price. They were drawn randomly and not after checking the correct period time intervals and price changes.
Not financial advice!
This post is just an idea! Do you agree? What's your opinion?

Accumulation Phase D, right shoulder incomingBitcoin is following a textbook Wyckoff accumulation 3 pattern, which would bring us one more wave down before the start of the next bull market, increasing the mounting evidence we might that the next months will see a decline in price action and opening more opportunities for long-term accumulation.
This wave would form the right shoulder in a classic inverse H&S pattern, a pattern that BTC used in the past to reverse long-term market trends.
With a timeline set to complete the shoulder at the end of Q1, the path would be open for investors to move in with fresh money at the beginning of Q2 and send the price up.
The price target for this idea is 19k.

USDCHF shortThis is for short term
Wait for Stop hunt then enter
Please DYOR before entering the trade.

BTC WYCKOFF TO SHAKEOFF RETAILThis is my first public post on here and probably the most important one ever for my crypto career haha jk.
Just a theory from what I've learnt so far - a lot of indicators confluence right here to sell stating the market is overbought temporarily.
MAINLY, BTC seems to be closely mirroring the Wyckoff pattern, all news and upcoming events (earnings etc) included.
I've entered a short position at $24100 and I intend to ride the trade all the way down to the range of 15xxx taking profits in between.
Will start entering long positions at 16k and below.
Stoploss at AR, seems like a solid trade.
I feel sorry for the retailers and late FOMOERs.
Wish y'all good luck.
This is not financial advice.

SMART MONEY TOP OF THE RANGE IMBALANCE SELL TRADE (USDCAD)Just a simple example of Top Of The Range Imbalance! SMART MONEY CONCEPTS !
I WILL BE POSTING MORE

Bitcoin entering Wyckoff Accumulation periodThere is some ample evidence fundamentally as well as technically why Bitcoin is possibly entering Wyckoff Accumulation period. There is also many other indicators saying the bottom may be in. Now this could change if the fed drastically does some more QT but so far a decent bull trap at a min is setting up.

Continue, Pullback or Markdown PhaseI feel that TSLA is in or heading into correction. $214 pullback, continue or correction. Original Thesis was $234-$238 Correction zone with Pullbacks and gap fills before big Correction.
This would also be a great BullTrap so that Wall-street can bank on the $200 Call Options this week.
*TSLA is STRONG, The Markets have been Rallying but there are Warning signs that we are in or going into correction.
Bullish Thesis Continuation idea: this is a set-up for impulse move to $223, pullback then or continue to then $238 & gap fill with big sell-off
Lots of TSLA Events coming up which is bullish for next couple of weeks
*Pullback/Correction Idea:
Measured Moves: Extension and Retracements are matching. Extension: 2 Retracement 0.618
Date Range from capitulation event to now are equally measured.
If $215 is broken then TSLA can continue to $223 for wave 5 and correct (Bullish Final Move Idea: this is pullback for pop to $223 and pullback)
If TSLA stops here and the Markets Correct then this could be the set-up for Pullback or Correction. (possible sideways trading for next 2 weeks)
*Daily Volume is showing only Buying - Small Time frame is showing Steady Selling and Impulsive Buying with Automatic sell-off. These are signs of Wyckoff Distribution Phase. *** Pullbacks being bought up are Strong Bullish signs* but TSLA Price has Moved up only 6% in 10 days...on large volume, so distribution is happening, amount of effort to move price is becoming harder to maintain price markup...but is it in correction mode yet is the question.
TSLA can still go higher to extend Impulsive wave 5* currently Wave 3 and 5 are of equal distance which could represent end of Markup. note:I am not an Elliot Wave Expert*
Bearish Sentiment:
Greed is strong
*Seasonality- Markets tend to Drop off Mid February
Vix above 20
us 2y, us10y, dxy,vix all breaking out.
Divergence of NYSE ADV/DEC
Current Sentiment: Bearish* Drop here or possible Upthrust to $223 with Hard-sell below $200
Let me know what you think

ETHUSDT Wycokoff Accumulation with Elliott Wave dynamicsIf you look at the recent accumulation phase, you can see that we are now in Phase D. Today we had the “test”, where we seen a sudden dump followed by fast pump. This should signal that we are ready to move up. The Elliott Wave was followed almost perfectly. Towards point A there was 1,3,5 impulse and at the time of writing this we completed ABC correction. If all goes well we should be going up to the next C price point.
Note: BTC and Eth are trading almost identical right now.

Wyckoff's accumulation phase for Bitcoin and cryptoHi there.
I'm not pretending I know what will come next and I'm not a trader. But also am quite confident that the human psychology hasn't changed since the latest bullrun when the Wyckoff accumulation-distribution cycle played out perfectly with a textbook chart of Bitcoin and crypto market.
I know a lot of respected traders have been saying 'the macro bottom for BTC is in' but as many of you probably know if people believe something in the markets, then it's probably wrong. At the point when those, who were calling for 12k Bitcoin became silent and 'were ashamed' - that's the very point when BTC is likely to start pivoting to that very direction. And when everyone will be shouting that we'll go lower (or simply everyone will capitulate) - then we'll indeed start to go higher.
I recommend everyone to monitor the macro picture, rate hikes, the Treasury General Account (right now around 500 bln or so), RRP (reverse repo) and other things closely, as well as anti-crypto measures such as Choke Point 2.0 etc.
Follow Arthur Hayes on Medium and Twitter, Guy's Coinbureau, Eric Krown's crypto cave, this specific chart was inspired by a recent CTO LARSSON (Youtube) video.
I also recommend you watching Benjamin Cowen's "Cryptomarkets' worst case scenario" (on Youtube). His approach may be a little bit different, but interestingly enough calls for more or less same levels of BTC bottom as those who are using Wyckoff's approach and basic support levels.
Also as usual - follow the trends and narratives and research before aping in.
I also recommend you to set up a list of whales' wallets and to watch what they are doing closely in the coming months.
Share you opinions in the comments.

102-105 puts will printNeed to test 98-99 for support before continuing to 120s.
Short it Feb 17 expiry

GBPUSD- BUY TRADE SCENARIO- Feb 14 2023CLear wyckoff reaccumulation seen on 5min tf but tradingview cannot allow me to publish on low tf.
RR: 1:10
-Charts detailed above including my entry,
RALLY-BASE-RALLY
Supply and demand with confirmation from wyckoff perspective.
:)

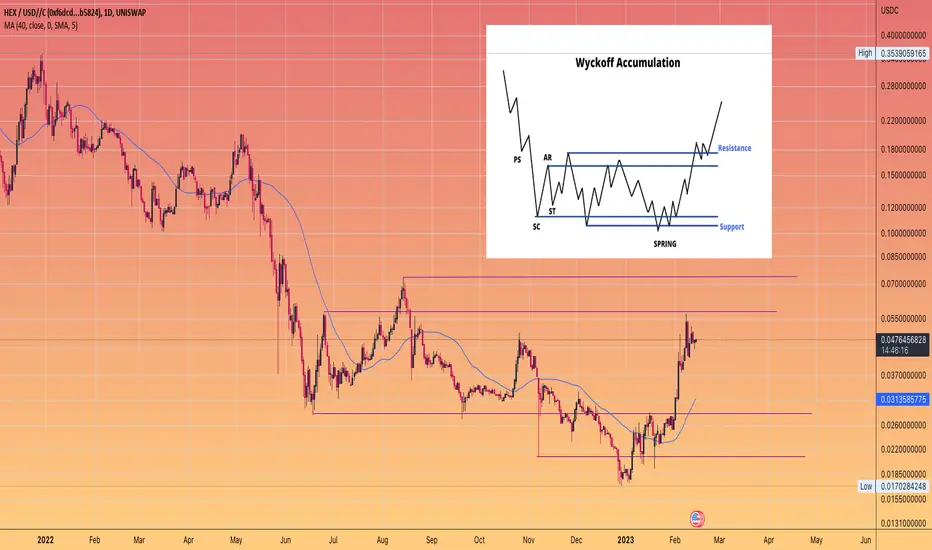
#HEX Wyckoff accumulationLike some other #altcoins
#HEXUSDC appears to be showing a #Wyckoff accumulation pattern
not textbook , but a very good guide as to what has occurred during this #bear market
could we have CPI dump today , quite possible
but I am favouring a lower CP LIE and grounds for continuation in the #stock market
Eth impulse is over FINALLY!The triple top on the golden fib marks the LPSY.
We might see a pierce through the 1k Golden fib without barely resistance and come back to retest it as resistance.
First Major stop at 600~. Major Bottom at 400¬

Potential BTC Wyckoff Distribution (Schematic #1)A potential BTC distribution is playing out, according to Wyckoff Schematic #1. Nothing obviously is 100% in (especially in crypto), but the resemblance is uncanny. This relief rally IMO has been unsustainable, so such an outcome shouldn't come as that big of a surprise. I realize this is a 2-hour chart but let's see how it plays out!

WC1302 GBPUSD Outlook: Still a bullJust Wyckoff and a couple of patterns to support my bias on GU.
In Wyckoff, whether it is a distribution or accumulation phase, it will still make that move up. (On the flip case, it will still make an AR)
Major news for the pound and dollar coming in tomorrow night!
It's amazing how we can rationalize our bias. Let's see what will happen tomorrow!

