GOLD D1: DROP WHILE DOLLAR RETRACES UP- Looking for GOLD to weaken while Dollar retraces up
- Previous breaker that took out sell-side stops needs to offer support
- Dollar should fall again after the retrace
- That would be the signal to go long GOLD again
- Upside target is 1 deviation up = GAP-resistance
Wyckoff

EUR WEAKNESS WHILE USD RETRACES UP?- Looking for EURUSD to soften while Dollar makes a retrace up
- Could be a matter of days before Wyckoff distribution pattern unfolds

XRP - Wyckoff Accumulation Accumulation within accumulation on the 4hr time frame... A spring within this 4hr accumulation would appear as a spring on the daily chart before bouncing out 30c region

Nasdaq bearish Wyckoff Redistribution Schematic, next leg down? $NQ Wyckoff Redistribution Schematic on the daily chart!💥📉
Pattern Confirmation: price breaks and holds below 11650
$nasdaq has also rejected off the 20w SMA, 21w EMA ⚠️
Looks like a potential start of the next leg down.

EURCHF M30 WYCKOFF ACCUMULATION UPDATE- Wyckoff accumulation in down-sloping channel unfolding
- Looking for a run on 1.00 big figure
- 1.00 = Weekly R2

GBPAUD DROPPING TO 1.70 ?- Looking for GBPAUD to weaken
- First target is 2nd deviation
- Second target is 1.7000

USDX RETRACE UP FOLLOWED BY DROP TO 103Looking for a retrace up in USDX
Followed by next push lower to 103

USDCAD 1 DEVIATION UPUSDCAD Wyckoff pattern unfolding
Looking for 1 deviation rise
2 deviation is 1.35 is above Weekly R1

Kotak Distribution PatternExample of trading with the Wyckoff Method.
Great volume at the beginning, test and fake rupture of the resistance, now a weaker test in the phase C and the price should fall increasing it volume until breaking the support at 1631

AUDUSD 1 DEV HIGHER TO 0.7000 ?- AUD advancement has been muted while USD weakened
- Expecting AUD to bounce of resistance, followed by next leg up to 0.7000

EURCHF M15 2 DEV UP- EURCHF intra-week Wyckoff pattern unfolding
- Looking for 2 DEV run to Weekly R2

CADJPY H4 WYCKOFF DISTRO- Looking for CADJPY to retrace to 102.50
- Pivotwise a run from Monthly Pivot to Monthly S2
- Monthly S2 = 102.50 = 3rd Deviation of Wyckoff channel

ETHUSD FROM WMS1 TO WMR2 IN WYCKOFF STYLE- Looking for bullish ranging in ETH this week
- Run from Weekly Middle S1 to Weekly Middle R2
- Also 1 deviation up from current channel
- Looking for Wyckoff schematics to unfold

GBPCAD UP TO 1.60 ?- Looking for a run from Monthly S1 to R1
- 2nd target is 1.6000 = 1 deviation up from Wyckoff-channel

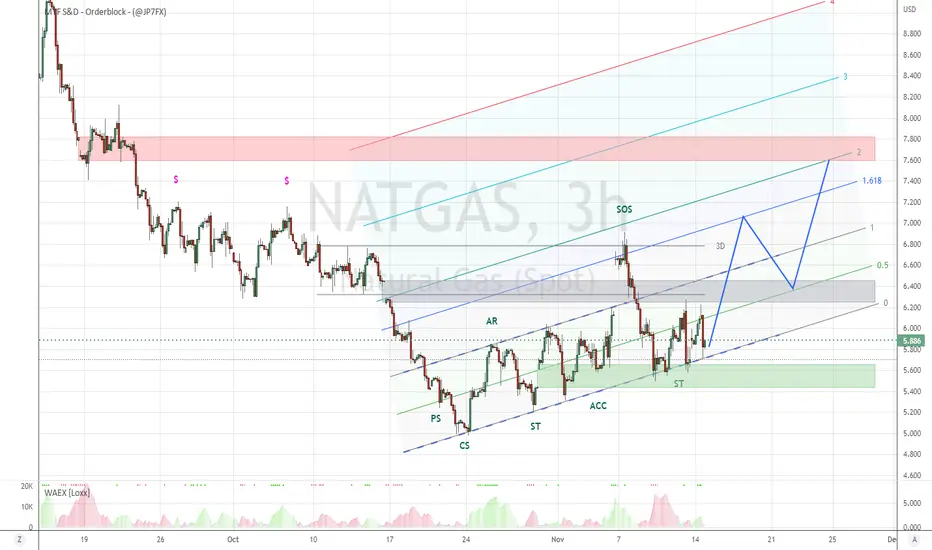
NATGAS UP AS TEMRATURES DROP ?- Tempratures are dropping in EU after a relatively soft Autumn
- Cold weather should increase demand for NATGAS
- NATGAS in a up-sloping Wyckoff channel
- Looking for a 1 deviation run higher
- Lower GAP is support
- Mid GAP should offer support once broken
- Higher GAP is target = 2nd DEV = Monthly R2
GBPJPY LOWER WHILE YEN GETS STRONGER ?- Looks like YEN is regaining some strength after the dramatic and extended weakening
- Wyckoff distribution unfolding in downwards sloping channel
- Expecting a 1 deviation drop to 160 = Monthly S2 = {revious Qarter Mid-level

CRUDE-OIL IN WYCKOFF DISTRIBUTION WEDGELooks like market is risk on
Expecting Oil to go against risk on sentiment for now
Begin DEC the EU will force price cap on Russian Oil
That would be a nice moment to go long (if it drops now)

NIKKEI PUSH HIGHER TO YEAR-OPEN ?- Looks like NIKKEI wants to push higher
- Repeated buying at OCT-VWAP
- Diagonal Wyckoff channel unfolding
- Phase E signals break-out of the channel
- 1 Deviation up is Year-Open = Monthly R2 = 29000

EURJPY BACK TO 140 ?- Will YEN-strength continue next week?
- Will YEN outperform EUR?
- Not best of circumstances to expect that
- Still Wyckoff predicts next leg lower
- If so, confluence at 140.00 = Monthly Profit Zone = Previous Quarter Mid-level

USDZAR 1 DEVIATION LOWER ?- - Weakening Dollar offers more downside perspective in RAND
- USDZAR completed Wyckoff distribution and moved 1 deviation lower
- Looking for a re-distribution, followed by another deviation lower
- Downside target = Imbalance = Previous Year Middle

COPPER BACK TO YEAR-OPEN ?- Wyckoff accumulation in up-sloping channel complete
- Looking for a 1 deviation extension into Year-Open
- Year-Open = GAP = Imbalance = 4.5000

EURCAD FROM 1.30 BACK TO 1.40 ?- Q3 was accumulation-phase
- Q4 is break-out, followed by reaccumulation in 2nd deviation
- Looking for 1 morw deviation up to 1.40 in Q4
- Pivot-wise it's a run from Quarterly Pivot to Quaterly R2

USDX IN DIAGONAL WYCKOFF DISTRO- Dollar printed a diagonal Wyckoff distribution
- Now broken lower
- Looking for a 1 deviation drop to below 104 = demand-zone
