Silver Long-Term Outlook: Wyckoff, Fibonacci & Volunacci in PlayOn the monthly chart, Silver is showing a strong setup for long-term investors. We can clearly identify two adjacent Wyckoff accumulation patterns, signaling institutional accumulation phases.
Price action is following an ascending Fibonacci channel, reflecting a steady bullish structure. After breaking out of the second Wyckoff pattern, a Volunacci projection has formed—pointing toward a potential move to retest its historical high near $48.
This alignment of classic technical patterns with volume-based projection tools strengthens the long-term bullish case for Silver.
Wyckoff

NIFTY1! (NIFTY50) Wyckoff ConsolidationNifty has most probably recorded a selling climax. Now, it's in the consolidation phase, and we're expecting a shakeout, too. It's very unlikely to go further down, but you never know. You must plan for both scenarios to stay in the game. Be market with you.

SUSHI - History Repeating Itself!Dear TradingView community and fellow traders,
I am Richard, also known as theSignalyst.
I find the SUSHI 🍣 daily chart intriguing , as it seems to be following the classic Wyckoff Cycle 📈.
If history repeats itself, we’ve just broken out of the accumulation phase ✅, highlighted in green 🟩.
As long as the bulls 🐂 remain in control, the markup phase may have just begun—potentially pushing SUSHI as high as $2.5 🚀.
❓ What's next?
Will SUSHI continue to trade higher from here, or will this cycle play out differently?
I hope you find this post useful, and I would appreciate your likes and support.
Which scenario do you think is more likely to happen first? and why?
📚 Always follow your trading plan regarding entry, risk management, and trade management.
Good luck!
All Strategies Are Good; If Managed Properly!
~Richard

Wyckoff Cycle - Practical Example (SUI)Dear TradingView community and fellow traders,
I am Richard, also known as theSignalyst.
I find the SUI daily chart to be intriguing as it appears to be following the famous Wyckoff Cycle.
I would like to apply Richard Wyckoff's four market stages/phases to this chart for analysis as a practical example.
1️⃣ Accumulation
SUI rejected the $0.50 round number and entered an accumulation phase, consolidating for several months.
2️⃣ MarkUp
After breaking above the accumulation range at $1, SUI kicked off the markup phase.
3️⃣ Distribution
SUI found resistance at the $5.50 round number, with the lower bound of its range near $4—forming a wide distribution phase.
4️⃣ MarkDown
Once SUI broke below the $4 major low and exited the distribution zone, it transitioned into the markdown phase.
🔄🔄🔄🔄🔄⬇️
1️⃣ Accumulation
After finding support around the $2 round number, SUI hovered within a range, forming another accumulation phase.
2️⃣ MarkUp
We're here 🙂 This week, SUI broke above the $2.80 major high and the accumulation range—signaling the beginning of a new markup phase.
❓ What's next?
Will SUI continue to trade higher from here, or will this cycle play out differently?
I hope you find this post useful, and I would appreciate your likes and support.
Which scenario do you think is more likely to happen first? and why?
📚 Always follow your trading plan regarding entry, risk management, and trade management.
Good luck!
All Strategies Are Good; If Managed Properly!
~Richard


$GRAB Long Term Trade IdeaTaxi and delivery service stocks all look bullish at the moment. Lyft and Grab are both a couple of my favorite longer term swing trade/investment plays just based off risk/reward and how beaten down both the stocks are.
If shown patience this trade could work wonders. I like it a lot because it gets me a little exposure to assets outside the U.S. and from a chart perspective its hard not to love a setup like this.
1. The buy side volume shown here is the highest its ever been for the stock by a long shot.
2. Price has been in a descending wedge type formation for several months now and is attempting to make a breakout, though this month's candle still has a lot of time left.
3. That hammer candle, especially considering it being printed on the 1M timeframe, is incredibly bullish in my eyes.
This chart reminds me a lot of NYSE:BABA but a bit earlier in its breakout stages. To me it is clear that accumulation has been taking place for over 2 years now and a big markup is upon us.
I have 3 take profit areas marked based off a few different Fibonacci levels I like that also have confluence with supply/demand dynamics present on the chart.
multiple daily/weekly candles below $4 could be a a good stop loss area as that would invalidate a lot of the bullish structure. Based off the current price this provides you with a minimum 2.75x RR trade and a maximum of 7x RR.
My average price is $4.25. Any pullbacks below $4.50 I will be looking at as great buying opportunities.
Will do my best to update this idea periodically over the next year or so.


#CRYPTO #BTC #ETH #WARNING #DUMP #COMING #WYCKOFF #SHORT#CRYPTO #BTC #ETH #WARNING #DUMP #COMING #WYCKOFF #SHORT
50% DUMP is coming for #Bitcoin & #Ethereum
This analysis is based on the analytical style of the Wyckoff Distribution Structure of Schematic #1.
I have outlined for you the important parts of the Wyckoff style on the one-hour timeframe on Bitcoin & Ethereum.
Currently, we are in Phase C of the Wyckoff Distribution Structure on Bitcoin & Ethereum.
We have to wait for the completion of this phase and the start of Phase D of the Wyckoff Distribution Structure.
See my analysis on Bitcoin & Ethereum now and read the full description section.
My Wyckoff Analysis of Bitcoin:
My Wyckoff Analysis of Ethereum:
The responsibility for the trade is yours and I have no responsibility for your failure to comply with the risk and capital management.
Good luck and be profitable.

#ETH #ETHUSD #ETHUSDT #ETHEREUM #Wyckoff #Analysis #Eddy#ETH #ETHUSD #ETHUSDT #ETHEREUM #Wyckoff #Analysis #Eddy
This analysis is based on the analytical style of the Wyckoff Distribution Structure of Schematic #1.
I have outlined for you the important parts of the Wyckoff style on the one-hour timeframe.
Currently, we are in Phase C of the Wyckoff Distribution Structure.
We have to wait for the completion of this phase and the start of Phase D of the Wyckoff Distribution Structure.
When will this structure be fully confirmed? When the Ethereum price falls to the 1750 support and gathers the final spring when this support is broken for the fall, we will enter a short position by getting the necessary confirmations based on our style and strategy.
💬 Note: The best entry point for short positions will be the 1720_1750 support break. if the Ethereum price UTAD and test formed, high-risk traders who are willing to trade in the opposite direction can enter a short position by getting confirmation in the time frames below 15 minutes.
Where will the targets be? The first target is 1500 and the second target can be 1000 dollars. Maybe next targets is : 800_500 dollars.
When can you safely close the position and enter a reverse trade, that is, long or buy? When a Wyckoff accumulation structure is formed at one of the targets.
The responsibility for the trade is yours and I have no responsibility for your failure to comply with the risk and capital management.
Good luck and be profitable.
I also invite you to review and view my latest analysis on Bitcoin & TOTAL3 on my page.

GAMUDA MARK UP CAMPAIGN
So, a rare schematic of wyckoff spotted. Finally.
A Type #1 Schematic of Accmulation
I have been started my position as attached, along with my clients (Red Line)
Technically :
1/ The Spring is very nice, Textbook Classic as mentioned by David Weiss
2/ The Feather's weight along with SpringBoard (Yellow LIne) prompted us to add position
With the QR, released yesterday showing an increase profit margin + revenue + earning.
PureWyckoff

#BTC #BTCUSD #BTCUSDT #BITCOIN #Wyckoff #Analysis #Eddy#BTC #BTCUSD #BTCUSDT #BITCOIN #Wyckoff #Analysis #Eddy
This analysis is based on the analytical style of the Wyckoff Distribution Structure of Schematics 1 and 2.
I have outlined for you the important parts of the Wyckoff style on the one-hour timeframe.
Currently, we are in Phase C of the Wyckoff Distribution Structure.
We have to wait for the completion of this phase and the start of Phase D of the Wyckoff Distribution Structure.
When will this structure be fully confirmed? When the Bitcoin price falls to the 91800 support and gathers the final spring when this support is broken for the fall, we will enter a short position by getting the necessary confirmations based on our style and strategy.
💬 Note: It is not exactly clear whether the market maker will act based on Schematic 1 or 2, so the best entry point for short positions will be the 91800 support break. If, based on the schematic 1, the Bitcoin price UTAD and test formed, high-risk traders who are willing to trade in the opposite direction can enter a short position by getting confirmation in the time frames below 15 minutes.
Where will the targets be? The first target is 62000 and the second target can be 46000 dollars.
When can you safely close the position and enter a reverse trade, that is, long or buy? When a Wyckoff accumulation structure is formed at one of the targets.
The responsibility for the trade is yours and I have no responsibility for your failure to comply with the risk and capital management.
Good luck and be profitable.
I also invite you to review and view my latest analysis on Bitcoin via the link below:
For altcoins, follow my analysis on the Total 3 chart.
My analysis of the Total 3 chart:

UNH Long $400 - Wyckoff Re-Accumulation SchematicWyckoff Re-Accumulation on UNH after recent ER sell off. Look for $400 to be supportive. Potentially an excellent addition the long term portfolio.
NYSE:UNH

Price breaking out of a wyckoff balance to go unbalanceMy approach the market was pointing out market had found a balance zone starting on April 9th- today. Today I notice high volume on the bull side towards one of the resistance points which it broke and retraced. One it started to retrace I went to the smaller time frame to look for a sniper entry( 5min bullish and strong delta candle stick rejecting of a low volume node and the session vwap ). The balance zone was $1450 wide so it should go imbalance for the same amount or close. This trade is really a 25rr but im going for 8rr to pass my 2nd phase in my challange. This trade will not hit instill like Wednesday maybe even to the end of next week.

wyckoff balance and unbalance tradeI believe market is going to breakout this balance zone and become imbalance on the buyers side.I'm only going for 6rr to pass my challenge but this is a easy 12rr trade

USDT.D Bearish Reversal Incoming Into a New Bullish Phase in BTCUSDT.D Update:
Its been a while since my last USDT.D update on here since i accurately forecasted and called the top in September last year from its last distribution range. Since then, Ive been expecting USDT.D and USDC.D to continue higher into deeper premiums and into monthly and 3M supply areas, taking further BSL in the process and coming into the HTF downtrend channel high, whilst the rest of the market continued bearish after the first moves from last year.
Both have done just that, pushing higher to extreme supply and heavy premium pricing. USDT.D has topped out with high volume as it come into refined extreme daily supply from the UT event in the prior distribution range, whilst taking the LQ at the 5.93% level i discussed in the market update videos. This is effectively following last points of supply from one distribution range to the next, following HTF bearish orderflow and HTF bearish structure in stablecoin dominance pairs. From the recent UTAD event we have seen bearish breakdowns on the daily timeframe on both USDT.D and and USDC.D, marking a turn in the market where things should start to get more interesting! Im looking for this again but on the weekly timeframe and monitoring for a HTF weekly close below the weekly HL, therefore putting in a LL on the weekly to give further HTF confirmations of the reversal from this area.
Whats interesting at this point is the last couple days of data on both USDT.D and USDC.D and the range conditions we are now creating.
For me, it looks pretty similar to the last top, where we created a distribution range in HTF supply after taking extreme key levels and LQ, putting the market in extreme fear, before slowly flipping bearish in the range before a full blown reversal and breakdown to the 3.73% level.
Im expecting a bounce of some degree over the next week or so in USDT.D back into the 5.57% region where the range high sits alongside some daily and refined 12H supply zones from the UTAD event. Im looking for a push into supply forming a LPSY last point of supply in phase D, before continuing HTF bearish to target SSL on the lows of this upward trend channel with my main targets between 3.73% and 3.12%. This aligns with what im seeing in BTC as posted today on TradingView and the market, expecting a pullback to demand respectively before continued upside.
I don't for see this taking the highs again above 6.24%. There is a lot of resistance and supply in this range now we have broke down and its likely we are seeing the formation of the reversal taking shape in due course.
As ive stated i the most recent BTC analysis, this is a risk on situation in my opinion and i will be allocating capital to spot bags as USDT.D hits its supply levels in the range highs and as BTC comes into the daily demand levels im monitoring between $84,000 - $76,500, buying the dip whilst expecting further upside and a HL to form in BTC and new LHs in stablecoin dominance pairs.
To finish, look at this chart on the daily, 2D, 3D, 4D, 5D, 1W, 2W, 3W charts and really look at the HTF closes on these candles at these highs. Theres been no HTF bullish closes above HTF supply or significant highs. Price has failed to put in new higher highs and is merely sweeping highs now with high volume rejections, volume dropping off, all whilst looking like a top imo with HTF weekly rejections all the way up to the monthly candle.
1D:
3D:https://www.tradingview.com/x/XtxjrvGR/
1W:
1M:

BTC on the verge of another accumulation range breakoutMorning all! So its time for a proper set of markups having spent the last few months breaking down the charts in video format for you all.
The last BTC update I gave was on 24/03, in the 4 year cycle analysis breakdown. In that video i was expecting lower pricing into SSL and the range lows once more, forming a bottoming structure before seeing a HTF bullish reversal come through, aligning with the 4 year cycle where we have time to continue higher based on past cycle data and where we are in the current cycle.
A month later and we have seen that come through wonderfully after the sweep of the range lows and its time to reanalyse now the direction is changing....
BTC has formed another accumulation range down in these discounted levels over the last couple months and there was nothing really interesting taking shape until the last couple of days thats give us some real confirmation of a trend change in this accumulation range that we can now work with. Unlike the August 2024 bottom, there isnt a massive influx of volume on the sweep event. I was able to call the bottom after such a sweep and high volume event back then just days after but in this most recent range we havent seen volume like back in August 2024, so ive had to be more cautious of further downside until we get some market shift confirmations to confirm intent and be on the safer side here whilst still holding my HTF bias of new ATHs before cycle end.
As shown on the charts, ive marked up the range and stages. We have carried out the sellers climax event, forming the range low, into the automatic rally (AR) forming the range high, moving into the secondary test (ST) with a failure swing back to the lows which forms the secondary test in phase B. From there we continued to range before putting in another range low deviation in the Spring event, with tests of the range low before seeing this explosive move come through from the spring event back to the range highs.
Volume also supports price action with a high influx of volume on the sellers climax low, stopping the prior trend, decreasing volume in the range into supply with a further increase in buyer volume as we deviate the lows in the spring event.
We have also broke structure bullish in the range and formed a HH, with a HL yet to be formed....
**So whats next? **
It seems a lot more clear now after the last couple days, and also confirms intent behind the range and i think its safe to say we have formed a bottom here and my focus is now on the upside on BTC from here. After this range high deviation into supply, in this new HH, i wouldn't be surprised to see BTC pull back to the midpoint of the range between $84,000 - $76,500, back into demand and form a last point of support/demand in the accumulation range forming a HL, before another leg higher as shown.
With how price has set up, with the demand left behind in the range and the bullish intent, my focus is on BTC forming a HL from demand before a continuation higher in line with my HTF bias that we will see new ATHs again before the cycle end. This is also supported in what im seeing on USDT.D and USDC.D where they are distributing in their ranges in supply with breakdowns in both and moving to a bearish trend.
Therefore, when price corrects into these levels i will be looking to allocate risk into the market during the discount of the HL and I will be looking for my buys on DOGE and any other opportunities, where im expecting higher lows in the market before continuations higher across the board. This doesnt mean everything though as many alts are yet to catch up and flip bullish, so my focus will be on the higher quality, stronger coins such as DOGE, but i expect the rest of the market to catch up eventually as BTC runs higher from these lows.
1D:
3D:
1W:
1M:

PECCA MARKING UPPecca, an Atypical Type of Schematic #2 Wyckoff Re-Accmulation
Why Pecca?
technically =
1. Feather's Weight (red crescent)
2. Absoprtion (Red arrow)
3. fulfilling Wyckoff 9 Buying point
TriggerBar today, as a test, for a follow through in the upcoming days.
Position initiated as attached
PureWyckoff

BTC short term Wave countAnalyzing a Bitcoin (BTC) form Wyckoff schema in a 4H chart.
We can’t determine if it’s an accumulation or distribution yet. Based on MACD and Elliott Wave Theory, I believe the chart will follow a similar pattern. However, time will determine the outcome. If BTC declines and accumulates within a shorter time frame of Elliot support levels, it could be a long trade opportunity.
(This analysis is not financial advice. Your actions are solely your responsibility.)

GOOGL 1H Swing Long Conservative Trend TradeConservative Trend Trade
+ long impulse
+ 1H / 1D level coincide
+ T2 level
+ support level
+ biggest volume 2Sp-
Calculated stop limit
1 to 2 R/R take profit
Daily Trend
"+ long impulse
+ JOC test / T2 level
+ support level
+ 1/2 correction"
Monthly Trend
"+ long impulse
+ T2 level
+ support level
- before 1/2 correction"
Yearly Trend
"+ long impulse
- T1 level
- resistance level"

OGKB 5M Investment Aggressive CounterTrend TradeAggressive CounterTrend Trade
- short impulse
+ biggest volume T1 level
+ biggest volume 2Sp-
+ weak test
+ first bullish bar close entry
Calculated affordable stop limit
1/2 yearly level take profit at 0.459
1H Counter Trend
"- short impulse
+ biggest volume TE / T1 level
+ support level
+ volumed 2Sp-"
1D Trend
"+ long impulse
+ JOC level
+ support level
+ 1/2 correction
+ volumed manipulation"
1M Trend
"+ long impulse (in 1d 4h)
+ neutral zone"
1Y CounterTrend
"""- short impulse
+ 2Sp-
+ perforated support level"""

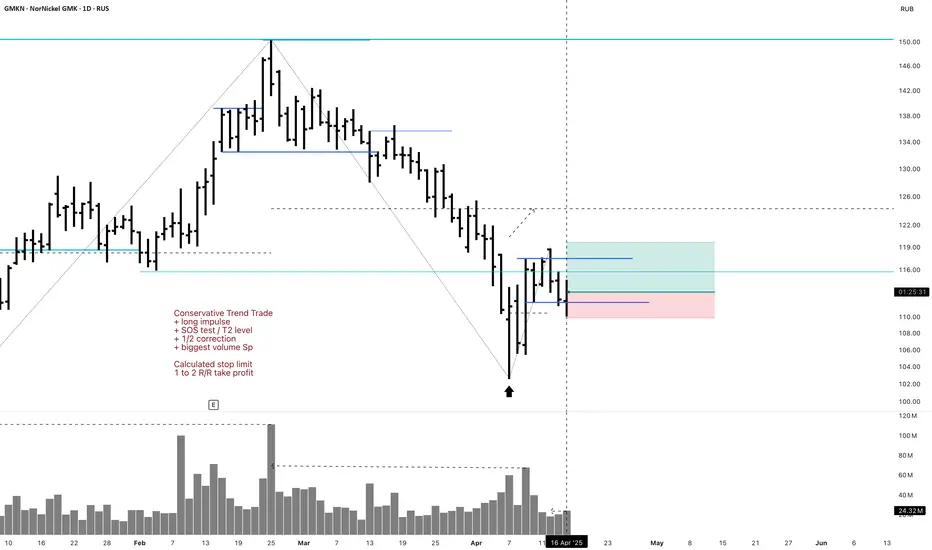
GMKN Long 1D Investment Conservative Trend TradeConservative Trend Trade
+ long impulse
+ SOS test / T2 level
+ 1/2 correction
+ biggest volume Sp
Calculated stop limit
1 to 2 R/R take profit
Monthly Trend
"+ long impulse
- SOS reaction bar level
+ 1/2 weak correction"
Yearly Trend
"+ long impulse
- below SOS
+ 1/2 correction"
ALRS 1D Long Investment Aggressive CounterTrend TradeAggressive CounterTrend Trade
- short impulse
+ volumed T1
+ support level
+ biggest volume Sp
+ weak test
+ first bullish bar close entry
Calculated affordable stop limit
Take profit
1/3 - 1 to 2 R/R
1/3 - 1D T2 / 1M T2
1/3 - 1/2 of 1Y
Calculated affordable stop limit
Take profit
1/3 - 1 to 2 R/R
1/3 - 1D T2 / 1M T2
1/3 - 1/2 of 1Y
Monthly CounterTrend
"- short impulse
+ volumed TE / T1
+ support level
+ volumed Sp
+ test"
Yearly Trend
"+ long impulse
+ 1/2 correction
+ T2 level
+ support level
+ manipulation"

$NVIDIA ─ Wyckoff Distribution #4 aka Rising Wedge PatternVANTAGE:NVIDIA ─ Wyckoff Distribution #4 aka Rising Wedge Pattern
Although Rising wedge turning into more like Rising Channel distribution idea is still valid.
#2 Long Trade TP1 Hit so far 🔥
------------
------------
Note: This is the most positive outcome possible.
As always, my play is:
✅ 50% out at TP1
✅ Move SL to entry
✅ Pre-set the rest of the position across remaining TPs
It's important to take profits along the way and not turn a winning trade into a losing trade.
