BTC – Textbook Pullback. New ATHs. What’s Next?Back in mid-June, I published a BTC update calling for a local correction into HTF demand while most were screaming bear market and waiting for deeper breakdowns.
Price action played out exactly as forecasted.
BTC swept the $100k swing low, front-ran my first demand zone by $400, and launched into a powerful reversal — just like it did back in April, where it also front-ran the key HTF demand before rallying.
That move took us straight into new all-time highs (ATHs) — now trading comfortably around $118k.
🧠 What Happened?
✅ Liquidity sweep of the prior low
✅ Front-run demand zone (perfect HTF structure)
✅ Strong bullish reaction and higher high
✅ Confluence from USDT.D rejection at 5.25%
✅ Alts showing signs of strength as BTC rallies
The entire setup aligned perfectly across BTC, USDT.D, TOTAL, and OTHERS.D — all of which I’ve been tracking in tandem.
🔮 What Now?
With BTC now in price discovery, I expect continuation higher — but not without the possibility of a short-term pullback.
📉 A potential retest of the $108k zone isn’t off the table. This level aligns with:
- Prior breakout structure
- Range high retest
- Local demand before continuation
But even if we go straight up — I remain HTF bullish into the final phase of this cycle, supported by:
- USDT.D structure still bearish
- BTC.D showing signs of distribution
- ETH.D and OTHERS.D gaining momentum
- Altseason rotation already starting to pick up
🧭 The Macro Outlook
The 4-year cycle projection still points to a Q3 2025 top — likely between August late and September based on historical cycle timing, but this could deviate.
That gives us a window of 2–3 months for this final leg to unfold — and it’s already in motion.
Stay focused. Stick to your plan. Ride the trend, don’t chase it.
Let me know what levels you're watching next, and whether you think we get that $108k retest — or we go vertical from here.
1D:
3D:
4D:
1W:
1M:
— Marshy 🔥
Wyckoffaccumulation
POLAND - WIG20 - ALLEGRO going UP soon (MID THERM)Im watching this asset few months now with all its latest ups and downs. There is my trading plan for near future. Based on Elliot waves theory and Wyckoff accumulation schematic i think that we are see higher tops soon.
Elliot: Currently in the beginning of third impulse wave. Second wave ended at 0.618 of first wave.
Wyckoff: End of phase C / beginning of phase D
First target 38-39 PLN
Second target 42-45 PLN
Third target (end of 3rd impulse wave) 49-52 PLN.
Let me know what you think in the comments below, happy trading.
Its only my opinion, not investing advice.

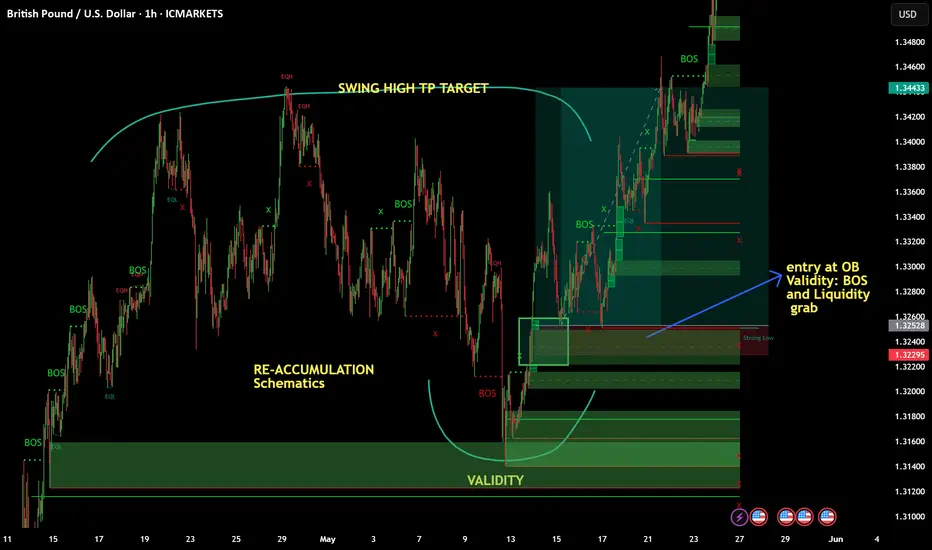
May 25 2025- BUY TRADE LIMIT order activated GBPUSDHi folks!
-Been busy lately so I dont consistently post. Attached here is the chart of GBPUSD, A classic re-accumulation in 1H timeframe. Before I got this trade It took me 1 week to monitor the schematics of this wyckoff re-accumulation. It came to fruition last Thursday so I monitor for buy Limit order entry within 1H to 15 min. charts. Validity here was the liquidity grab of re-accumulation ( check the image for clear caption).
TP: 8RR
Risk: 0.05% of Account
-Proprietary Trader
#wyckoff
#supplyanddemand
#refinement
Another Microcap ready to pop? Overall liking the structure with current PA. Granted could see a bit more of a pullback as volume is quite high relative to up bars over the past 3 months. Would target the supply structure
*note arrows not indicating time analysis

Another small cap primed for a breakout?Very clean range formation on the verge of a breakout. Price has rallied nicely into the top of range. We just need to see where the pullback comes to but overall, a great area to start accumulating. Ideally a bullish candle close on the monthly would indicate a “safer” entry. A quick and easy target would be the EQ of the FVG which is around the macro 50% level
*note the arrows are not time analysis just price pathway.

Breakout after a brutal ~10 year Range? A great risk to reward trade in play with price pulling back and printing bullish hammer into the covid low demand structure, major 50% and near previous ATH zone. Expect price to move quickly up through the range here for a potential breakout of a brutal 10~ year range.
Great place to buy are the LPS (pullbacks) and trail SL on the monthly swing bottoms.
The 100% extension is a minimal target with price potentially slicing through it after such a long consolidation.
*Arrows are not based on time analysis just a path for PA

MERL Markup phase inbound? Overall, PA has been building up nicely on the daily TF with a clean Wyckoff range building. In phase D we’re seeing increased volume on up bars with larger spreads than the pullback candles. Market could be ready to move into Phase E (markup) after the SOS and pullback. The pullback is sitting nicely on the range top, range 50% level and FVG of Thursdays 22/5 candle.
Daily swings 1 bar and weekly 1bar/2bar swings are up.
Could enter now for more aggressive play as 25 May daily high is broken indicating continuation of trend with SL under the low. However, have to be careful as BTC is primed for a potential pullback to around 98-100k~

PEAQ — Fibonacci Meets Wyckoff Structure +100% SetupAfter more than 70 days of sideways action, PEAQ is finally showing signs of life — with a well-defined structure that suggests accumulation is giving way to a potential new trend.
What we’re seeing aligns closely with a classic Wyckoff Accumulation pattern. A local bottom formed around the psychological $0.10 level, followed by a clean breakout — marking a potential Sign of Strength (SOS).
Now comes the real opportunity.
Wyckoff Accumulation Structure
Following the long consolidation range:
🔹 Phase D: Breakout from range = Sign of Strength (SOS)
🔄 Current: Pullback = potential Last Point of Support (LPS)
The recent correction has now retraced into the 0.786 Fib zone of the impulse wave — a deeper but still healthy retracement for Wyckoff structure. Notably, this level also coincides with the previous highs that PEAQ broke out from, now flipping into support. A perfect test of demand.
🔍 Confluence Zone Breakdown
0.786 Fibonacci retracement: ~$0.1312
Previous highs: ~$0.14
Monthly open: $0.1289 (ideal invalidation level)
These overlapping signals create a tightly packed support zone that defines the next high-probability long setup.
🟢 Long Setup — 0.786 ($0.1312)
Entry: $0.1312
Same stop-loss: $0.125 (below mOpen)
Targets: $0.2589 and 1.618 Trend-Based Fib Extension target at $0.2694
R:R: ~16:1+
Potential upside: +100%+
📘 Educational Insight: Wyckoff Meets Fibonacci
This setup is a combination of Wyckoff theory and Fibonacci structure:
SOS breakout signals strength
LPS pullback into 0.786 Fib = high-probability continuation zone
Previous highs now acting as support
When structure, confluence, and psychology align — you don't chase. You wait.
📌 Summary
✅ 70+ days of accumulation
✅ SOS confirmed
🔁 Now retracing to LPS around $0.131
🔒 Monthly open provides clear invalidation
🎯 Targets: $0.2589 and $0.2694
💰 Potential R:R: 16:1+
Each chart is a lesson. Read it with patience, trade it with purpose.
___________________________________
If you found this helpful, leave a like and comment below! Got requests for the next technical analysis? Let me know.

Crypto - Dogecoin - Wyckoff Accumulation LPSDogecoin is completing a wyckoff accumulation. It is at the LPS step. So we expect it to run up to the SOS step. We have a hammer candle at the bottom of a retrace which is bullish.
STO appears to have bottomed at 50 and is ready to run.
RSI has turned at 59 which means buyers are in control.
Price is 0.1740
Target 1 is 0.20 which is 15% without leverage.
Stop Loss should be around 0.164 so 6% max loss.

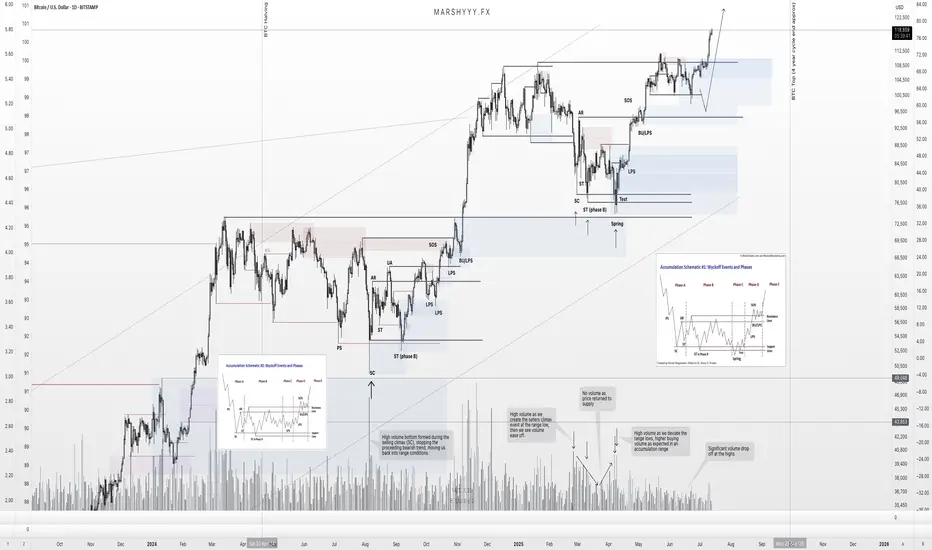
BTC on the verge of another accumulation range breakoutMorning all! So its time for a proper set of markups having spent the last few months breaking down the charts in video format for you all.
The last BTC update I gave was on 24/03, in the 4 year cycle analysis breakdown. In that video i was expecting lower pricing into SSL and the range lows once more, forming a bottoming structure before seeing a HTF bullish reversal come through, aligning with the 4 year cycle where we have time to continue higher based on past cycle data and where we are in the current cycle.
A month later and we have seen that come through wonderfully after the sweep of the range lows and its time to reanalyse now the direction is changing....
BTC has formed another accumulation range down in these discounted levels over the last couple months and there was nothing really interesting taking shape until the last couple of days thats give us some real confirmation of a trend change in this accumulation range that we can now work with. Unlike the August 2024 bottom, there isnt a massive influx of volume on the sweep event. I was able to call the bottom after such a sweep and high volume event back then just days after but in this most recent range we havent seen volume like back in August 2024, so ive had to be more cautious of further downside until we get some market shift confirmations to confirm intent and be on the safer side here whilst still holding my HTF bias of new ATHs before cycle end.
As shown on the charts, ive marked up the range and stages. We have carried out the sellers climax event, forming the range low, into the automatic rally (AR) forming the range high, moving into the secondary test (ST) with a failure swing back to the lows which forms the secondary test in phase B. From there we continued to range before putting in another range low deviation in the Spring event, with tests of the range low before seeing this explosive move come through from the spring event back to the range highs.
Volume also supports price action with a high influx of volume on the sellers climax low, stopping the prior trend, decreasing volume in the range into supply with a further increase in buyer volume as we deviate the lows in the spring event.
We have also broke structure bullish in the range and formed a HH, with a HL yet to be formed....
**So whats next? **
It seems a lot more clear now after the last couple days, and also confirms intent behind the range and i think its safe to say we have formed a bottom here and my focus is now on the upside on BTC from here. After this range high deviation into supply, in this new HH, i wouldn't be surprised to see BTC pull back to the midpoint of the range between $84,000 - $76,500, back into demand and form a last point of support/demand in the accumulation range forming a HL, before another leg higher as shown.
With how price has set up, with the demand left behind in the range and the bullish intent, my focus is on BTC forming a HL from demand before a continuation higher in line with my HTF bias that we will see new ATHs again before the cycle end. This is also supported in what im seeing on USDT.D and USDC.D where they are distributing in their ranges in supply with breakdowns in both and moving to a bearish trend.
Therefore, when price corrects into these levels i will be looking to allocate risk into the market during the discount of the HL and I will be looking for my buys on DOGE and any other opportunities, where im expecting higher lows in the market before continuations higher across the board. This doesnt mean everything though as many alts are yet to catch up and flip bullish, so my focus will be on the higher quality, stronger coins such as DOGE, but i expect the rest of the market to catch up eventually as BTC runs higher from these lows.
1D:
3D:
1W:
1M:

$SUPER Wyckoff Accumulation – Schematic #1 or #2 in PlayBSE:SUPER Wyckoff Accumulation – Schematic #1 or #2
My base case at the moment is Wyckoff Accumulation Schematic #2 , where the Secondary Test ( ST-B ) could mark the very bottom. This idea will be validated for me especially if we see interaction with the High Time Frame VAL .
Green Zone:
We have confluence with VAL and Green TRP Zone from HTF ReAccumulation idea.
High Time Frame Wyckoff ReAccumulation Idea:

$NIO Wyckoff Accumulation – Schematic #1 or #2 in PlayMy base case at the moment is Wyckoff Accumulation Schematic #2 , where the Secondary Test ( ST-B ) could mark the very bottom. This idea will be validated for me especially if we see interaction with the High Time Frame Channel projection.
Green Zone:
We have multiple levels of confluence around this zone:
0.786 Fibonacci Retracement from the 2020 low to the 2021 top
MO – Monthly Open level
Volume cluster from previous local consolidation
Blue Zone:
If price drops as low as VAL, I expect it to be just a quick, volatile wick breaching into the Blue Zone.
High Time Frame Channel projection:

$TRAC @trac_btc #Ordinals — Beginning of a Wyckoff AccumulationPOLONIEX:TRACUSDT @trac_btc #Ordinals 👀
— Possibly the beginning of a Wyckoff Accumulation Range—Schematic #1 or #2 are my base case for now.
If the local range POC holds as the LPS (Last Point of Support), then Schematic #2 is in play. If it’s lost, the probability shifts toward a new low and a SPRING.

LCID looks like it could hit a nice 50% popBasically been in an extended downtrend since the SPAC merger in
'21. I have seen sporadic bullish news fundamental wise but those I take with a grain of salt.
What has really snagged my attention is we broke out of the falling wedge on the weekly, made a lower low, catching out people who took the breakout early, we bounced up, double topped, generating some decent liquidity above those 5-6 highs to our immediate left.
On top of that when we came in for the 2nd bottom we put in a pretty clean accumulation schematic, volume jiving on cue.
Daily P pattern on the TPO, bull flag on the 15, the more I look, the more I like it.
Much love and good luck!

FTM ready to Go-Break out of the downtrend has been completed One of the best strategies, breakout of the down trend and retest it.
Strengths Points: one week candle has broken the blue down trend and it may continue to enter the white wide range, also reverse head and shoulders pattern formed
Target points and Stop Loss are marked on the chart.
I am Just sharing insights and market trends for learning and growing every day and it is not financial advice.

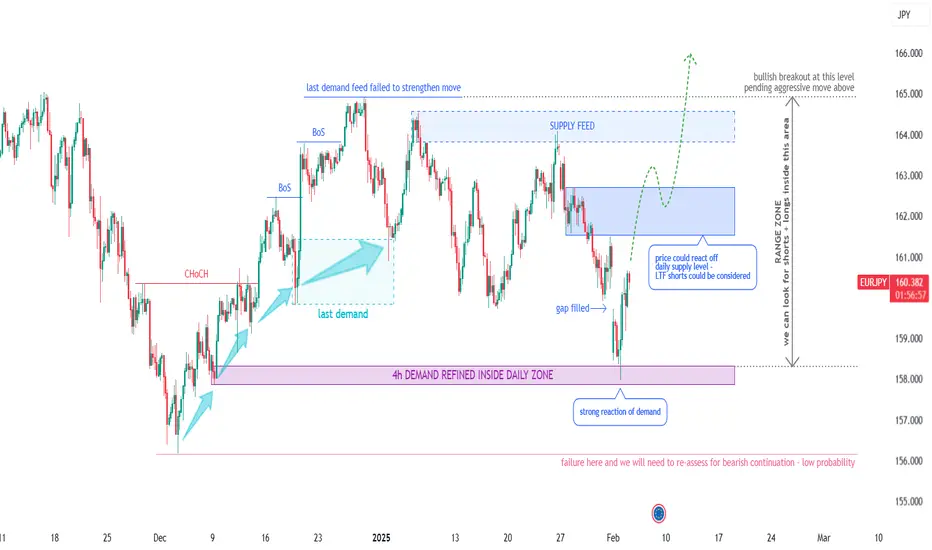
EURJPY Potential Longs - Short & Long Term (Technical Analysis)Technical Outlook:
Looking at previous price movement, we see it's been trending up since August 2024, with the last reaccumulation phase ending in early 2024. We recently saw a demand chain, but the last push couldn't quite hit new highs. Supply then took over, driving the price back down to a daily demand level. At this point, we've seen some strong bullish reactions on the lower timeframes, which is interesting and here's why -
Potential Scenarios & Probabilities:
Scenario 1 (High Probability) – Demand should regain control, leading to a bullish breakout.
Scenario 2 (Medium Probability) - Price could range within the ascending channel for a while.
Scenario 3 (Low Probability) – The bulls might disengage, resulting in a bearish break and continuation thereafter.
Trading Considerations:
Price is currently in a discounted zone within the ascending channel (158.000 – 168.000) . We can look for trading opportunities within this range, focusing on strong supply and demand areas, anticipating the eventual bullish breakout. A long position closer to the bottom of the range could turn into a swing trade. If you're trading inside the range on lower time frames, it's smart to keep an eye on volume, overbought/oversold levels, and relative currency strength.
Final Notes:
With the price moving sideways for a good six months, range trading is definitely a possibility. But the real goal is to catch that bullish breakout when it happens, and it looks like it's getting close. As always, manage your risk carefully, and don't hesitate to take the trade when the setup is right – assuming you've got a solid plan and a clear target in mind.
OANDA:EURJPY
$NIO A massive Rising Channel & Wyckoff Accumulation
NYSE:NIO has been in a downtrend for over 1,450 days—could it finally be time to shine? ⌛️
A massive rising channel: early projection based on top pivots and potential mid-range pivots. 👀
Hey community, do you still believe in NYSE:NIO ?
Are you holding 💎🖐️ and staying unfazed by the downtrend?

The Wyckoff Accumulation Method. And how it can make you money.Richard Demille Wyckoff (1873–1934) was a trailblazer in the early 20th century, known for his innovative technical methods in stock market analysis. He ranks among the five great figures of technical analysis, alongside Dow, Gann, Elliott, and Merrill. At just 15 years old, he began his career as a stock runner for a brokerage in New York. By his twenties, he had already risen to the position of head of his firm.
Wyckoff was a passionate learner of the markets, deeply engaged in tape reading and trading. He closely monitored the market manoeuvres and strategies of the iconic stock traders of his era, such as JP Morgan and Jesse Livermore. Through his keen observations and discussions with these prominent figures, Wyckoff distilled the most effective practices of Livermore and others into a set of laws, principles, and techniques that shaped his trading methodology, money management strategies, and mental discipline.
Mr. Wyckoff noticed that many retail investors were consistently being taken advantage of. In response, he committed himself to educating the public on “the true rules of the game” as dictated by major players, often referred to as “smart money.” In the 1930s, he established a school that eventually evolved into the Stock Market Institute. The primary focus of the school was a course that combined Wyckoff's insights on recognising the accumulation and distribution strategies of large operators with techniques for aligning one’s investments with these influential entities. His enduring principles remain just as relevant today as they were when he first shared them.
“…all the fluctuations in the market and in all the various stocks should be studied as if they were the result of one man’s operations. Let us call him the Composite Man, who, in theory, sits behind the scenes and manipulates the stocks to your disadvantage if you do not understand the game as he plays it; and to your great profit if you do understand it.” (The Richard D. Wyckoff Course in Stock Market Science and Technique, section 9, p. 1-2)
Wyckoff advised retail traders to try to play the market game as the Composite Man played it. He claimed that it doesn't matter if market moves “are real or artificial; that is, the result of actual buying and selling by the public and bona fide investors or artificial buying and selling by larger operators.”
Wyckoff, drawing from his extensive observations of the market activities of major players, imparted several key insights:
The Composite Man meticulously strategises, implements, and wraps up his market campaigns.
He entices the public to invest in a stock where he has built a significant position by engaging in numerous transactions, effectively promoting his stock and creating the illusion of a “broad market.”
To truly grasp the dynamics at play, one must analyse individual stock charts to discern the behaviour of the stock and the intentions of the large operators who influence it.
With dedicated study and practice, individuals can develop the skill to decode the underlying motives reflected in a chart's movements. Wyckoff and his colleagues believed that by understanding the market behaviour of the Composite Man, traders could spot numerous trading and investment opportunities early enough to capitalise on them.
One goal of the Wyckoff method is to enhance market timing when entering a position by predicting an upcoming movement that offers a favourable reward-to-risk ratio. Trading ranges (TRs) represent areas where the previous trend, whether upward or downward, has paused, creating a relative balance between supply and demand. During these TRs, institutions and large professional players gear up for their next bullish or bearish strategies by either accumulating or distributing shares. In both accumulation and distribution phases within TRs, the Composite Man is actively engaged in buying and selling. The key difference lies in the fact that during accumulation, the volume of shares bought exceeds those sold, whereas in distribution, the opposite occurs. The degree of accumulation or distribution ultimately influences the nature of the subsequent movement out of the TR.
Springs and shakeouts typically happen towards the end of a trading range (TR), providing key players in the stock market an opportunity to thoroughly assess the available supply before initiating a markup phase. A "spring" occurs when the price dips below the lowest point of the TR, only to rebound and close back within the range. This maneuver can create confusion among the public regarding the future direction of the stock, allowing major investors to acquire more shares at lower prices. A terminal shakeout, which takes place at the conclusion of an accumulation TR, is essentially an amplified version of a spring. Additionally, shakeouts can happen even after a price increase has begun, characterized by a swift drop designed to prompt retail traders and long-position investors to sell their shares to larger market players.
To sum up, while there is much more to explore on this topic, Richard D. Wyckoff's
groundbreaking contributions in the early 1900s highlighted that stock price movements are largely influenced by institutional players and significant market operators who often sway prices to their advantage. Although many professional traders incorporate Wyckoff's techniques, his comprehensive approach remains underutilised among retail investors, despite his aim to educate the public on the "true rules of the game." His methods for stock selection and investment have proven resilient over time, thanks to their detailed, systematic, and logical framework for pinpointing high-probability, lucrative trades. This disciplined strategy empowers investors to make rational trading choices, free from emotional bias. By applying Wyckoff's principles, investors can align themselves with the strategies of influential "smart money" players, avoiding the pitfalls of being on the wrong side of market movements. Mastering Wyckoff analysis demands significant practice, but the rewards are undoubtedly worthwhile.

Bitcoin and Wyckoff Accumulation D1BINANCE:BTCUSDT
Lets check classic Wyckoff Accumulation phase since drop In June. This is D1 Timeframe and if Historically October is green month with 15-60% moves up. We have an all chances break resistance and hit even 28-30K.
Hope you enjoyed the content I created, You can support with your likes and comments this idea so more people can watch!
✅Disclaimer: Please be aware of the risks involved in trading. This idea was made for educational purposes only not for financial Investment Purposes.
* Look at my ideas about interesting altcoins in the related section down below ↓
* For more ideas please hit "Like" and "Follow"!

MU ACCUMULATIONLooks Like accumulation into break-out soon or possibly last leg of Accumulation with Final Shake-Out

Predicting Bitcoin's Cycle Using the Elliott Wave Theory, Part 3Hello Traders. With the new year upon us, I think sufficient time has passed for the charts to develop from our previous #Bitcoin analysis. Having accurately forecasted the macro trends for each pivot within a reasonable margin of error, I believe we're approaching another pivotal moment this year, aligning with our previous predictions. Please take this post with a grain of salt, and more importantly, please use it to add confluence to your personal theories.
In this post, we will be diving deeper into the Elliott Wave Theory by also integrating the Wyckoff Market Cycle Theory.
By combining the two theories, the chart below represents our current position within the final leg for what could be giving us signs of a possible reversal (again, within margin of error depending on how far wave 5 extends):
Wyckoff believed that markets move in cycles, which arguably has a direct correlation to the Elliott Wave 5-wave/3-wave cycle. Wyckoff introduced a four-stage market cycle , attributing it to the actions of institutional players who strategically influence price movements to capitalize on the behavior of uninformed traders. Simply put, the theory gives us a further understanding of 'cause and effect' within the markets.
In my view, the Wyckoff cycle also does a fantastic job of representing market psychology. And if intertwined correctly with the Elliott Wave Theory, price action tends to follow patterns in similar ways. The Elliott Wave Theory and Wyckoff Theory often overlap in their application and interpretation of market behavior, but they approach the market from different perspectives. Both theories aim to understand and predict market movements based on the behavior of market participants and price cycles, making them complementary in many ways.
Commonalities Between the Elliott Wave Theory and Wyckoff Theory:
Market Cycles
- Wyckoff Theory identifies a four-stage market cycle: Accumulation, Markup, Distribution, and Markdown. The Elliott Wave Theory also emphasizes cyclic behavior through a fractal structure of impulsive and corrective waves within broader market cycles.
- Both theories suggest that price movements are not random but follow identifiable patterns driven by market psychology.
Psychological Basis
- Wyckoff focuses on the interaction between "big players" (institutional traders) and "uninformed traders," highlighting group psychology and how institutional actions exploit public sentiment.
- Elliott Wave focuses on the crowd psychology behind price movements, suggesting that mass investor sentiment drives waves in predictable patterns.
**Both theories reflect the influence of human behavior and emotions on market prices.**
Application Across Timeframes
- Both theories are applicable across multiple timeframes, from intraday trading to long-term investments. This flexibility allows traders to use them in conjunction for deeper market analysis.
Identification of Trends and Reversals
- In Wyckoff Theory, phases like Markup and Markdown align with Elliott Wave's impulsive trends, while Accumulation and Distribution phases can correspond to corrective wave patterns.
- Both approaches aim to identify key turning points in the market, helping traders anticipate trends and reversals.
-----
The Four Stages of the Market Cycle According to Wyckoff
Accumulation Phase
This is a sideways range where institutional traders accumulate positions quietly to avoid driving prices higher. During this phase, the asset remains out of the public spotlight, and uninformed traders are largely unaware of the activity. On a price chart, the phase appears as a range-bound movement between areas of support and resistance.
Markup Phase
Following the accumulation phase, the market enters a classic uptrend. As prices rise, uninformed traders begin to notice and join in, further fueling the rally. Institutional players may take partial profits or continue holding for greater gains. Short sellers caught off guard are forced to cover their positions, adding additional buying pressure and driving prices to new highs.
Distribution Phase
After the uptrend loses momentum, the market transitions into a sideways range, marking the distribution phase. Institutional players use this period to offload their holdings, while uninformed traders, still expecting higher prices, continue to buy. Some institutional traders may also initiate short positions during this phase to benefit from the subsequent price decline. On the price chart, this phase appears as a reversal of the uptrend into a sideways range.
Markdown Phase
The markdown phase is characterized by a downtrend following the distribution phase. Institutional traders add to their short positions, while uninformed traders, recognizing the decline too late, sell in panic, creating further downward pressure. The market eventually reaches new lows as selling accelerates.
The Model of Group Psychology
After the markdown phase, the cycle often repeats, moving from accumulation to markup, distribution, and markdown again. The Wyckoff cycle offers a simplified perspective on market behavior, focusing on the psychological dynamics between two groups: institutional traders (the "big players") and uninformed traders (the "small players"). It highlights how the mistakes and emotional reactions of uninformed traders often benefit institutional players.
The Wyckoff cycle provides valuable insights into market behavior but is not without limitations:
Limitations of the Wyckoff Trading Cycle
Difficulty in Identifying Phases
Distinguishing between accumulation and distribution phases can be challenging. What appears to be an accumulation phase might turn into a distribution phase, with the market unexpectedly breaking lower.
Timing Challenges
Entering trades during accumulation or distribution phases is difficult due to the lack of clear stop-loss levels. Placing stops around support and resistance often leads to being trapped.
Complexity in Trading Trends
Trading the markup and markdown phases requires skill, as they are filled with complex price action patterns. Modern markets often experience frequent trend reversals, complicating trade execution.
Irregular Cycles
The market does not always follow the textbook sequence of accumulation, markup, distribution, and markdown. Variations such as accumulation followed by markdown or other combinations are possible.
Despite its limitations, the Wyckoff cycle remains a useful framework for understanding market behavior. It is best combined with other strategies, such as price action and market dynamics, to enhance its practical applicability. While modern markets may reduce the cycle's predictive reliability, it still serves as a powerful tool for traders who know how to apply it effectively.
Proper Application of the Elliott Wave Theory and Wyckoff Overlap (in Practice):
Trend Identification:
The Markup Phase in Wyckoff often aligns with Elliott's Impulse Waves (1, 3, and 5), while the Markdown Phase aligns with corrective waves or bearish impulses.
Sideways Markets:
Wyckoff’s Accumulation and Distribution phases correspond to Elliott’s Corrective Waves (A-B-C) or sideways consolidations (Flats and Triangles).
Volume Confirmation:
Traders can use Wyckoff’s volume analysis to validate Elliott Wave patterns, especially in identifying wave 3's (typically accompanied by high volume) and wave 5's (often showing declining volume).
Timing and Execution:
Wyckoff’s emphasis on identifying support/resistance levels and trading ranges can help refine the entry and exit points suggested by the Elliott Wave Theory.
Combining the Two:
Many traders find value in combining these theories:
- Use Wyckoff to identify key price levels and market phases (e.g., when accumulation or distribution is occurring).
- Use Elliott Wave to determine the broader trend structure and anticipate the next moves within those levels.
- By integrating Wyckoff’s volume-driven approach with Elliott’s fractal patterns, traders can gain a comprehensive view of the market and improve their ability to time trades effectively.
----
By integrating the concepts from both theories and the outlined schematics, we can now take a closer look at how Bitcoin is behaving through the lens of these frameworks.
As observed, Bitcoin appears to be nearing the completion of the potential 5th wave we've been discussing over the past year. In my view, a bear market (or at least a significant correction) may be approaching. While timing is uncertain due to the unlikely nature of extensions, we can use insights from both Wyckoff and Elliott Wave theories to gauge our current position. I believe we are likely in the Distribution phase, which aligns with the 5th wave.
The 5th wave can extend as much as it wants, but it won't change the overall conclusion of the cycle. We still anticipate the cyclical behavior that Bitcoin has shown in the past. While past price action isn't necessarily a predictor of future movements, it often follows a similar pattern.

GBP USD Complete Analysis - Top Down - Structure wiseHi guys,
Below im going to go through a detailed breakdown of GBP USD for longer term swing trades and what i am looking for to confirm any trade direction.
Firstly i want to start of at the monthly time frame:
Below is a photo of the monthly timeframe clearly showing bearish structure with lower highs and lower lows:
So our monthly bias is bearish, and the last rally could just be a pull back to continue lower, However, considering that the low that was created in September of 2022 created a new all time low for the pair, i am skeptical that this pair will go any lower. Furthermore, looking at the price action from the low of 2016 till date we can see that price has been pretty much range bound, which also looks to be a Wyckoff accumulation schematic. However this will only be confirmed once price breaks above the last high marked up in the above drawing, as this will confirm bullish strength and a break of long term structure to the upside.
Conclusion of monthly time frame analysis: Trend is bearish but it seems to be at it's turning point. So we need to see confirmations of lower timeframe to determine weather price will continue to drop or go higher.
Now lets look at the daily time frame:
Looking on the daily time frame we clearly see bullish structure, with higher lows and higher highs, however remember this entire structure could just be a pull back of the monthly time frame's bearish structure.
So when will this move be considered a pull back of the bearish monthly structure? if price manages to break the recent low marked up in the above drawing at around 1.204. this will indicate a break of the bullish structure on the daily timeframe and a shift from bullish to bearish structure.
As long as price is above this low, 1.204 then the structure will remain to be bullish.
So to recap, on the monthly we are overall bearish but we are expecting that we are at the end of the bearish move, but we need to see the lower timeframes confirm if price wants to go higher. As of now, the daily structure is bullish and the structure is holding. So we can look for buys at this point.
Lets go down to the 4 hr time frame:
On the 4 hr timeframe we can see the clear bearish structure. but remember that as long as price is above the 1.204 mark then we are bullish on the daily, so this bearish structure gives us opportunities to enter long positions at lower prices. But in order to confirm that this bearish structure will not just continue to drop and shatter the 1.204 mark, then we need to see a shift in structure from bearish to bullish, which will occur when price breaks above the high in the above photo at around 1.28. This will indicate the end of this bearish pull back and a change in structure from bearish to bullish, so then we will have bullish structure on the 4 hr and the daily time frames. Entries however will be taken on the 15 or 5 min timeframes, when the time comes. For now i need to wait and see if the 4 hr structure will turn bullish or not.
Also another note on the 4 hr timeframe, structure aside, we can see some signs of accumulation where we have just done a quick sweep and stop hunt of the lows which also indicate that bullish strength may enter soon. As shown in the below photo:
So overall i am bullish on GBP USD but i need the 4 hr time frame to confirm my bias by breaking structure upwards and clearing the 1.28 mark. At that point we will scope in on the 15 min for entries on pull backs.
The other scenario is if price continues to be bearish, and breaks the low on the daily time frame at around 1.204, this will completely shift our bias from bullish to bearish, and will look for sell positions on pull backs.
So for now, we wait. Wait for price to show you what it wants to do, does it want to respect the bullish structure on the daily time frame? or does it want to shift the structure from bullish to bearish? this will be the deciding factor here. And based on that we can analyze further and look to take some good swing trades.
If you made it this far, i thank you for your time and patience, and i hope this helped you in some way.
Thank you, and happy new year to everyone!!

Wyckoff Accumulation SchematicBTC has formed a Wyckoff Accumulation Schematic on the H4 even more distinguishable on H1.
According to it, we are only in phase B, so it's a long way to go before we will see a new ATH.
Fill up your bag, it's a great buy opportunity before the crazy 2025 run.
