Wyckoff trading using the example of ADA/BTC Accumulation schemePay attention to the phases and letter designations on the graph that I showed on the ADA / BTC pair. (Cardano). A diagram of the accumulation phases is shown. Which are relevant for trading now. Several trading methods are combined on the chart:
1) Trading by the Wyckoff method.
2) Trade in horizontal channels.
3) Trade from important areas (price reversal points).
4) Trading in secondary local trends.
Now the price is at the important zone of the mirror level which, from the development of the situation, can act as support or resistance. Channel pitch 30%. You can work in two directions.
_________________________________
About Wyckoff's trading method.
The forerunner of volume analysis (VSA) is Richard Wyckoff. Roughly speaking, the whole point of the method can be expressed - trade for a major market player. The creator of this technique himself was a man who had a system-forming influence on stock trading. It was not a poor theorist who got rich after publishing books! He was a very successful trader and earned impressive capital in his day. The very method that he was allowed to achieve and the entire 40 years of experience in trading, he published in his book in the public domain is already closer to his death Wall Street Ventures and Adventures Through Forty Years. At the end of his life's journey, Wyckoff became more altruistic, and decided to share the knowledge that led him to wealth. He died in 1934.
The Wyckoff trading method was developed in the early 1930s. It consists of a number of principles and strategies originally developed for traders and investors. Wyckoff devoted much of his life experience to studying market behavior, and his work still has an impact on much of modern technical analysis (TA). Currently, the Wyckoff method is applied to all types of financial markets, although initially it was focused only on stocks.
During the creation of his work, Wyckoff was inspired by the trading methods of other successful traders (especially Jesse Livermore). Today, he enjoys the same respect as other key figures such as Charles Dow and Ralph Nelson Elliott . But for example, unlike Elliot’s theory, which is good in theory, but not always applicable in practice, the Wyckoff method is many times more effective for making money not in theory, but in practice.
_________________________________________
According to Richard Wyckoff's trading method, there are 3 laws:
1) The law of supply and demand .
2) The law of causation.
3) The law of communication efforts and results.
The first law states that the value of assets begins to rise when demand exceeds supply, and accordingly falls in the reverse order. This is one of the most basic principles in the financial markets, which does not exclude Wyckoff in his work.
We can represent the first law in the form of three simple equations:
1) Demand> supply = price increases.
2) Demand <offer = price falls.
3) Demand = supply = no significant price change (low volatility ).
The second law states that the differences between supply and demand are not a coincidence. Instead, they reflect preparatory actions resulting from certain events. In Wyckoff's terminology, the accumulation period (cause) ultimately leads to an uptrend (consequence). In turn, the distribution period (cause) provokes the development of a downtrend (consequence).
Wyckoff’s third law states that price changes are the result of common efforts that are displayed on the trading volume . In the case when the growth in the value of the asset corresponds to a high volume of trading, there is a high probability that the trend will continue to move. But if volumes are too small at a high price, growth is likely to stop and the trend may change direction.
_____________________________________
Wyckoff Price Cycles.
According to Wyckoff, the market can be understood and predicted using a detailed analysis of supply and demand . This can be done based on price action, volume and timeframe. By observing the behavior of large groups of investors, Wyckoff was able to learn to notice certain points during which preparations were made before a large price move. These moments were called accumulation (before the upward movement of prices) and distribution (before the fall of prices).
_____________________________________
“Composite person” (major player) and phases.
Wyckoff created the idea of a “composite man” (from the English composite man, composite operator), which embodies the imaginary personality of the market. He invited all investors and traders to study the stock market from the point of view if it were controlled by one subject, as this could facilitate their further following the trends.
At its core, the composite person represents the largest players (market makers), wealthy people and institutional investors. The behavior of a composite person is the opposite of most investors and traders that Wyckoff often observed, given their financial losses. This is the opposite of crowd action.
The cycle described in the Wyckoff method consists of four main phases:
1) Accumulation (accumulation).
2) Impulse or uptrend.
3) Distribution.
4) Markdown (correction, downtrend).
1 phase. Accumulation.
A composite person accumulates assets before most investors and traders begin to do so. This phase is usually marked by lateral movement. Accumulation occurs in a gradual manner to avoid significant price changes.
2 phase. Impulse or uptrend.
When a composite person takes possession of a sufficient amount of assets, while the sales force is depleted, he begins to push the market upward, forming an emerging trend that gradually attracts more and more new investors, which subsequently leads to an increase in demand.
3 phase. Distribution.
Then the “composite person” distributes the purchased assets. He begins to sell his profitable positions to those who enter the market at a late stage (“hamsters”).
4 phase. Markdown (correction, downtrend).
Shortly after the distribution phase, the market begins to fall. In other words, after the composite person has completed the sale of a significant amount of his position, he begins to push the market down. To repeat the cycle again. The hamster is not a mammoth - it will not die out. In the end, supply becomes much larger than demand, and a downtrend will follow.
_________________________________________
Approach to the Wyckoff market in five steps.
Wyckoff also developed a five-step approach to the market based on numerous principles and methods. Simply put, such an approach can be considered as the procedure for applying his work in practice.
Step one: identify the current trend.
The primary task is to determine the current trend and a superficial assumption where and how far it can go, in connection with which the following questions arise: "what is the current trend?", "What is the relationship between supply and demand?".
Step two: determine the strength of the asset.
How strong is the asset in relation to the market? Does its value move with the market or the opposite of it?
Step three: find an asset with a reason for further growth.
Are there enough reasons to open a position? Is the reason good enough for the potential benefit (consequence) to justify the possible risks in the future?
Fourth step: determine the likelihood of cost increases.
Is the asset ready for the intended move? What is its position relative to the current trend? Does the price and volume of trades correspond to possible growth? This step often includes Wyckoff tests for the purchase and sale of the selected asset.
Step Five: Your Login Time.
The last step contains all the timing information. For the most part, this is due to the analysis of a trading instrument to compare their behavior with the main market. In cryptocurrency, for example, with bitcoin .
__________________________________________
Wyckoff Trading Schemes.
Accumulation and distribution schemes are the most popular part of Wyckoff’s work, at least among cryptocurrency communities. This model breaks down these two schemes into smaller sections of five phases (from A to E), as well as several events that are briefly described below.
Pay attention to the phases and letter designations on the graph that I showed on the ADA / BTC pair. A diagram of the accumulation phases is shown. Which are relevant for trading now
ACCUMULATION DIAGRAM
PS - preliminary support (initial support) the first resistance - appears after a significant decrease in the price, the volume increases, and the price accelerates the decrease over time.
SC - the culmination of sales - there is a sharp drop in prices for large volumes.
AR - automatic rally (automatic upward movement) appears because there are very few sellers in the market, and buyers quickly raise the price up.
ST- secondary test (repeated test) - occurs to check the forces of supply and demand . There may be several ST and SC . ST can even slightly break the price level set by SC .
Spring - does not always occur, in the late stages of accumulation. The logic of false breakdown.
Test - Occurs after Spring is formed and should be on a small volume . Usually above the low at a lower level.
SOS - a sign of strength (signs of strength) the price begins to rise and stands out from the price range TR (trading range) with an increased volume .
LPS - the last support point, the last resistance level , occurs after a breakdown (SOS), this is a return of prices in the vicinity of TR with low volume and low price dynamics.
BU (back up) - the return of prices to the accumulation channel, which follows the realization of the profit of short-term investors and is a demand test. It does not always happen, for obvious reasons.
Phase A.
The strength of sales decreases and the downtrend begins to slow down. This stage is usually marked by an increase in trading volume . Preliminary support (from the English preliminary support, abbr. PS) indicates that new customers are starting to appear, but this is still not enough to stop the downward movement.
The culmination of sales (from the English selling climax, abbr. SC ) is formed through intense activity aimed at selling assets, as a result of which investors begin to capitulate. This often manifests itself as the highest point of volatility , when panic sales form high candles and wicks. A strong drop quickly develops into a jump or automatic rally (AR), due to the fact that buyers begin to absorb excess supply. Thus, the trading range ( TR ) of the accumulation scheme is determined as the distance between the minimum culmination of sales and the maximum of automatic rally.
A secondary test ( ST ) occurs when a drop in market prices crosses the sales climax ( SC ) to verify the validity of a downtrend. In this case, trading volume and market volatility are usually lower than usual. While the second test often forms a higher minimum relative to the culmination of sales, this does not always happen according to plan.
Phase B.
Based on the Wyckoff law of causation, phase B can be considered as a cause that leads to a certain effect.
Phase B is the consolidation phase in which a composite person accumulates the largest amount of assets. At this stage, the market tends to test various levels of resistance and support in the area of its trading range.
Numerous secondary tests ( STs ) may occur during phase B. In some cases, they show higher highs (bull traps) and lows (bear traps) with respect to the culmination of sales and the automatic rally, like phase A.
Phase C.
This phase is a typical period of asset accumulation. It is often the last bear trap before the market begins to show higher lows. During phase C, the composite person provides a small proposal, and in fact, those who were supposed to sell their assets have already done so.
During this phase, support levels begin to break through to stop traders and mislead investors. We can describe this as the last attempt to buy an asset at a lower price before the start of an uptrend. Thus, the bear trap encourages small investors to abandon the holding of their assets.
However, in some cases, support levels can be maintained, and the "spring" simply does not begin. In other words, there may be another accumulation scheme, which includes slightly different elements, but not “spring”. However, the overall structure of the circuit remains valid.
Phase D.
Phase D represents the transition between cause and effect. It is located between the accumulation zone (phase C) and the breakout of the trading range (phase E).
Typically, a significant increase in trading volume and volatility occurs during phase D. Usually it assumes the last point of support (from the English last point support, abbr. LPS ), demonstrating a lower minimum before the market begins to move up. LPS often precedes breakthrough resistance levels, which in turn creates higher highs. This indicates the manifestation of signs of strength (from the English. Signs of strength, abbr. SOS), as the previous resistance levels become new levels of support.
Despite a somewhat confusing terminology, there may be several last points of support during this phase. They often increase trading volume when testing new zones. In some cases, the price may create a small consolidation zone before effectively breaking through a larger trading range and moving on to phase E.
Phase E.
Phase E is the last step in the accumulation pattern. It is marked by a clear penetration of the trading range due to increased demand in the market, which indicates the beginning of an uptrend.
__________________________________________
Volume in separate phases (VSA).
A key element in the analysis of the Wyckoff method is the preservation of volume at the individual stages of accumulation / distribution.
Phase A.
In this phase, dynamic movements of prices with an increased volume occur. We have new highs / lows and climax points, followed by automatic price rallies in the opposite direction, and then retest on a smaller volume . This phase forms the border of the TR (trading range) channel, in which the price will consolidate until the rebound in phase D and E
Stage B.
Here, large investors get rid of their last position from the previous trend and prepare for its reversal.
Phase C.
This is a very important phase, because in phase C it comes to the end of the current trend. Weak players leave the market for Spring (accumulation) or UTAD (distribution). If these formations do not exist, then we are dealing with LPS , where the inability to continue the current trend is visible, the price practically does not move.
Phase D.
With signs of weakness in the current trend from phase C, the time comes to show the strength of the adversary. The price breaks the level in the expected direction, with high dynamics and increased volume .
Phase E.
Confirmation of our assumptions and completion of the accumulation / distribution process. Price accelerates in the expected direction. If we were unable to join the movement during phase D, then further problems may already arise with this. And this deal will be less profitable.
______________________________
Conclusion on the Wyckoff trading method.
Almost a hundred years have passed since the publication of the work, but the Wyckoff method is still in demand to this day. By nature, the market does not always exactly follow similar trading patterns. In practice, accumulation and distribution patterns can occur in different ways. For example, in some cases, phase B can last much longer than expected. For this reason, spring, UTAD and other tests may simply be absent.
However, Wyckoff's work offers a wide range of reliable trading techniques that are based on numerous theories and principles. His work is certainly valuable to thousands of investors, traders and analysts around the world. The accumulation and distribution schemes described in this article may be suitable for understanding the general order of cycles in financial markets.
But recently, due to the widespread introduction of algorithmic trading and the use of it by large players, it has become increasingly difficult to notice a large player on highly liquid instruments, but it is possible. According to three schemes of dialing / resetting by the position algorithm.
This analysis method is more relevant for medium-liquid instruments, where fewer algorithms and highly professional traders are clearly hard to see. One person can hide his real work, and do fake trade for dozens of people. It is clear that with good preparation, it is possible to calculate and understand what will happen next, but naturally this is not an analysis of the schedule. Analysis of the schedule in the work of a truly successful trader in fact takes no more than 20-30% of the work.
__________________________________
It is impossible to describe everything in one article. The Wyckoff method at first glance seems complicated, but it is not. The main thing is to understand the essence of the work and practice trading tools. To start, start trading with a symbolic amount.
Always remember, a theory without practice is zero.
Once again, the Wyckoff method works well on medium-liquid instruments such as cryptocurrencies, but not lower than the top 100.
Wyckoffaccumulation

$WOOF Relative Strength coming out of baseI've been long WOOF from previous post, and added to position today as now WOOF is coming out of a rounded base and closing above the 30 week MA (orange line).
Now, so long as WOOF closes above 30 week MA, I'm long and will add.
What I'd like to see is the 10 week MA (blue line) cross and for price action to sustain above to new highs.
22.8 and 25 zone are key resistance points and will be important to see how price reacts at these levels.
Fundamentally EPS have seen continued growth.
Also Frisco Trades comes from my frenchie Frisco, so I'm biased bullish on anything pet related :)
Cheers

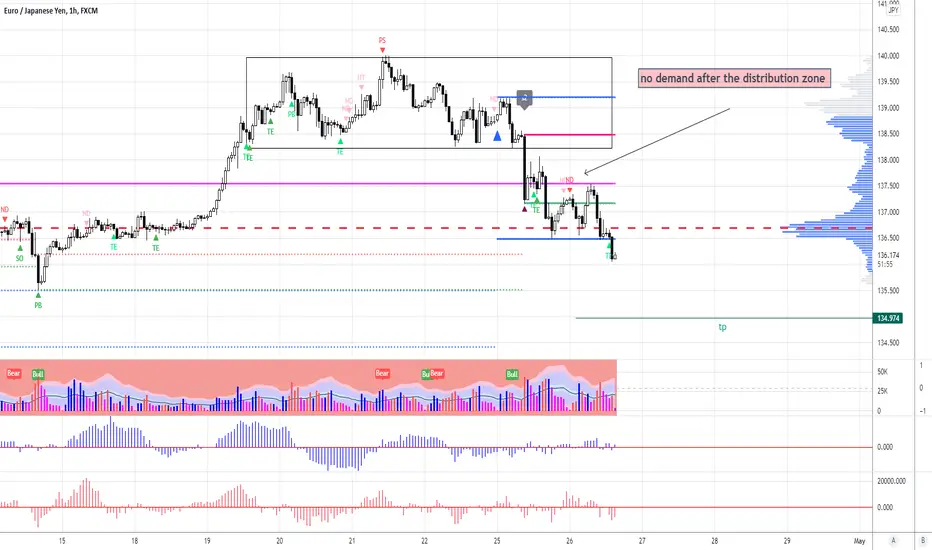
eurjpyno demand after the distribution zone
after the distribution zone we see a check of the herd on the rise in the form of no demand
Us 30 Wyckoff Point figureThe formation of a terminal shakeout always gives more chances to the bullish side .
But do not forget that it is necessary to confirm our judgments in the absence of the proposal

Eurjpy An example of my dealAn example of my deal
When the euro was well caught against the dollar on the lack of demand in the liquidity zone

US30 wyckoff analiseAccumulation zone at 12 o'clock
The price is in the high volume bar zone
Spring at 12 o'clock
Phase C Accumulation Confirmation
Looking for entry point

BTC Long To 42.2k+ Wyckoff Mark up Btc Is currently in a beautiful Wyckoff mark up setup with 2 Re accumulation Boxes. I am expecting to retest the highs very soon.

Bitcoin Wyckoff AccumulationAs the Crypto bullrun possibly comes to end, there have been suggestions of a third run to 72k - marking the wyckoff distribution pattern and the retest of the All Time High (69K) and then back down.
However, with Bitcoin and Ethereum rejecting 200MA's and 200EMA's on the 1D / 4Hour charts with weak buying volume, this is becoming less and less likely a possibility.
That coupled with higher interest rates and the stock market falling, we could be in for a tough few months, with Bitcoin ranging between 30K and 48K.
I have noticed a possible accumulation pattern that could be taking place as we speak (please see the chart and explanation below).
Our Daily SELL indicator suggests we SHORT, so we went SHORT at 41.8k to hold until the low 30's.
Suggestions of Bitcoin going lower than 28.8K is probably exaggerated - there are some very big players in the market right now such as Microstrategy, Grayscale, Tesla who's average is higher than this. You can bet manipulation will hold Bitcoin above this price and we will never go lower than 28.8K (UNLESS there is a Great Depression).
Early 2023 should mark the start of Phase C/D - 1 year BEFORE the next halving, usually a point where smart money accumulates the most coins.
I also imagine the Fed's inflation problem is going to start becoming more of a problem again, with higher interest rates not having the same effect it has in 2022.
Here is a detailed explanation of Wyckoff accumulation and the levels as shown on the chart:
Phase A: Phase A marks the stopping of the prior downtrend. Up to this point, supply has been dominant. The approaching diminution of supply is evidenced in preliminary support (PS) and a selling climax (SC). These events are often very obvious on bar charts, where widening spread and heavy volume depict the transfer of huge numbers of shares from the public to large professional interests. Once these intense selling pressures have been relieved, an automatic rally (AR), consisting of both institutional demand for shares as well as short-covering, typically ensues. A successful secondary test (ST) in the area of the SC will show less selling than previously and a narrowing of spread and decreased volume, generally stopping at or above the same price level as the SC. If the ST goes lower than that of the SC, one can anticipate either new lows or prolonged consolidation. The lows of the SC and the ST and the high of the AR set the boundaries of the TR. Horizontal lines may be drawn to help focus attention on market behavior, as seen in the two Accumulation Schematics above.
Sometimes the downtrend may end less dramatically, without climactic price and volume action. In general, however, it is preferable to see the PS, SC, AR and ST, as these provide not only a more distinct charting landscape but a clear indication that large operators have definitively initiated accumulation.
In a re-accumulation TR (which occurs during a longer-term uptrend), the points representing PS, SC and ST are not evident in Phase A. Rather, in such cases, Phase A resembles that more typically seen in distribution (see below). Phases B-E generally have a shorter duration and smaller amplitude than, but are ultimately similar to, those in the primary accumulation base.
Phase B: In Wyckoffian analysis, Phase B serves the function of “building a cause” for a new uptrend (see Wyckoff Law #2 – “Cause and Effect”). In Phase B, institutions and large professional interests are accumulating relatively low-priced inventory in anticipation of the next markup. The process of institutional accumulation may take a long time (sometimes a year or more) and involves purchasing shares at lower prices and checking advances in price with short sales. There are usually multiple STs during Phase B, as well as upthrust-type actions at the upper end of the TR. Overall, the large interests are net buyers of shares as the TR evolves, with the goal of acquiring as much of the remaining floating supply as possible. Institutional buying and selling imparts the characteristic up-and-down price action of the trading range.
Early on in Phase B, the price swings tend to be wide and accompanied by high volume. As the professionals absorb the supply, however, the volume on downswings within the TR tends to diminish. When it appears that supply is likely to have been exhausted, the stock is ready for Phase C.
Phase C: It is in Phase C that the stock price goes through a decisive test of the remaining supply, allowing the “smart money” operators to ascertain whether the stock is ready to be marked up. As noted above, a spring is a price move below the support level of the TR (established in Phases A and B) that quickly reverses and moves back into the TR. It is an example of a bear trap because the drop below support appears to signal resumption of the downtrend. In reality, though, this marks the beginning of a new uptrend, trapping the late sellers (bears). In Wyckoff's method, a successful test of supply represented by a spring (or a shakeout) provides a high-probability trading opportunity. A low-volume spring (or a low-volume test of a shakeout) indicates that the stock is likely to be ready to move up, so this is a good time to initiate at least a partial long position.
The appearance of a SOS shortly after a spring or shakeout validates the analysis. As noted in Accumulation Schematic #2, however, the testing of supply can occur higher up in the TR without a spring or shakeout; when this occurs, the identification of Phase C can be challenging.
Phase D: If we are correct in our analysis, what should follow is the consistent dominance of demand over supply. This is evidenced by a pattern of advances (SOSs) on widening price spreads and increasing volume, as well as reactions (LPSs) on smaller spreads and diminished volumes. During Phase D, the price will move at least to the top of the TR. LPSs in this phase are generally excellent places to initiate or add to profitable long positions.
Phase E: In Phase E, the stock leaves the TR, demand is in full control and the markup is obvious to everyone. Setbacks, such as shakeouts and more typical reactions, are usually short-lived. New, higher-level TRs comprising both profit-taking and acquisition of additional shares (“re-accumulation”) by large operators can occur at any point in Phase E. These TRs are sometimes called “stepping stones” on the way to even higher price targets.
And here are the terms related to what you see in the chart:
GLOSSARY:
PS—preliminary support, where substantial buying begins to provide pronounced support after a prolonged down-move. Volume increases and price spread widens, signaling that the down-move may be approaching its end.
SC—selling climax, the point at which widening spread and selling pressure usually climaxes and heavy or panicky selling by the public is being absorbed by larger professional interests at or near a bottom. Often price will close well off the low in a SC, reflecting the buying by these large interests.
AR—automatic rally, which occurs because intense selling pressure has greatly diminished. A wave of buying easily pushes prices up; this is further fueled by short covering. The high of this rally will help define the upper boundary of an accumulation TR.
ST—secondary test, in which price revisits the area of the SC to test the supply/demand balance at these levels. If a bottom is to be confirmed, volume and price spread should be significantly diminished as the market approaches support in the area of the SC. It is common to have multiple STs after a SC.
Note: Springs or shakeouts usually occur late within a TR and allow the stock’s dominant players to make a definitive test of available supply before a markup campaign unfolds. A “spring” takes price below the low of the TR and then reverses to close within the TR; this action allows large interests to mislead the public about the future trend direction and to acquire additional shares at bargain prices. A terminal shakeout at the end of an accumulation TR is like a spring on steroids. Shakeouts may also occur once a price advance has started, with rapid downward movement intended to induce retail traders and investors in long positions to sell their shares to large operators. However, springs and terminal shakeouts are not required elements: Accumulation Schematic 1 depicts a spring, while Accumulation Schematic 2 shows a TR without a spring.
Test—Large operators always test the market for supply throughout a TR (e.g., STs and springs) and at key points during a price advance. If considerable supply emerges on a test, the market is often not ready to be marked up. A spring is often followed by one or more tests; a successful test (indicating that further price increases will follow) typically makes a higher low on lesser volume.
SOS—sign of strength, a price advance on increasing spread and relatively higher volume. Often a SOS takes place after a spring, validating the analyst’s interpretation of that prior action.
LPS—last point of support, the low point of a reaction or pullback after a SOS. Backing up to an LPS means a pullback to support that was formerly resistance, on diminished spread and volume. On some charts, there may be more than one LPS, despite the ostensibly singular precision of this term.
BU—“back-up”. This term is short-hand for a colorful metaphor coined by Robert Evans, one of the leading teachers of the Wyckoff method from the 1930s to the 1960s. Evans analogized the SOS to a “jump across the creek” of price resistance, and the “back up to the creek” represented both short-term profit-taking and a test for additional supply around the area of resistance. A back-up is a common structural element preceding a more substantial price mark-up, and can take on a variety of forms, including a simple pullback or a new TR at a higher level.

Wyckoff accumulation for rune this is my theory about rune being in a accumulation zone. we should see a giant move down to the spring zone. which long term is the .618 fib. let me know if i need to simplify it more.

Wyckoff accumulation this is my theory of rune being in a accumulation stage. everything should be written out. hope you guys enjoy :)

Long BTCUSD Wyckoff Accumulation Phase Over.Beautiful Wyckoff accumulation between 40k and 40.5k in the last 7days , Spring test yesterday in the low 38.5k.
We are now in the Phase D of Wyckoff accumulation schematic.
small consolidation over 40.5k then i am expecting to see 41.5k hit.

BTCUSD: The market needs to eat before it can fly The market needs to eat before it can fly
EN
Hello to all cryptocurrency traders. I would like to share with you my current vision for $ BTC. We are creating a beautiful complex accumulation line that looks like a bear's flag on a higher timeframe, but the concept of smart money does not trade such patterns, so I expect a breakthrough and a retail trap that a terrible ride of $ 20,000 awaits us next week. However, below us is now a very strong zone, which ranging from $ 37,000 to $ 39,000 made up of strong volumes, this zone is our main support, if maintained, even a possible fake break can serve as a withdrawal of liquidity before a strong move. This is an ideal scenario when there is a false bear flag break but the daily close will be above the zone, which would mean confirmation of accumulation, the last entry of smart money on retail stoplosses and ride to 50,000 USD.
CZ
Ahoj všem obchodníkům kryptoměn. Rád bych s vámi nasdílel svojí aktuální vizi na $BTC. Tvoříme krásnou komplexní akumulační sestavu, která vypadá na vyšším timeframu jako medvědí vlajka, ovšem koncept smart money takové patterny neobchoduje a proto očekávám, že příští týden dojde k průrazu a vytvoření pasti na retail, že nás čeká děsivá jízda na 20 000 USD. Ovšem pod námi je teď velmi silná zóna, které se lemuje od 37 000 USD po 39 000 USD tvořena silnými objemy, tato zóna je náš hlavní support, pokud dojde k udržení tak i případný fake break může sloužit právě jako vybrání likvidity před silným pohybem. Je to ideální scénář, kdy dojde k falešnému breaku medvědí vlajky ale daily close bude nad zonou, což by znamenalo potvrzení akumulace, posledn ívstup smart money na retailove stoplossy a cesta k 50 000 USD.

Luna structuresJust an overview of my current theories. We'll see where to next. If the structure stays true to form who knows.

BTC LONG from 39.5k Wyckoff Accumulation SchematicGet your Long ready the accumulation phase has started, I am expecting to see BTC go up from here.
Beautiful Wyckoff Accumulation Schematic

ETH.Usdt (Y22.P1.E4).2 Strategies trade approachHi All,
#ETH #ETHEREUM
The rejection was at the 618 level, typical for a lead in trend line and the prior price action aligns with 2 macro strategies.
a) Bump and Run
b) Wyckoff accumulation
Combining these 2 is not as one looks for the bottom and the other looks for a confirmation of a bull run.
For now, I'm looking for Wyckoff accumulation schematic to find the bottom and I believe the ST in phase B is taking place and it will be 1 of 4 potential formations then after. Note the wedge and if it breaks out of that key level, short.
FYI, I'm shorting since we dropped the EMA.
To follow this story, come and join our community.
Please give me a like and share,
All the best,
S.SAri
The only issue I have to remain bullish is the cross over of the EMAs
approaching the weekly 50 EMA should expect a bounce.

GLMR.Usdt (Y22.P1.E4).Wyckoff works
Hi All,
#Wyckoff Method #GLMR #GLIMMER #MOONBEAM
If you followed my posts, even better our group, you would have made some gains with this.
Just wanted to share how accurate this Bottom reversal was aligned to one of Wyckoff accumulation model.
Previous posts below.
Please like and share,
All the best,
S.SAri
strong resistance level
1.618

A very sophisticated bullish escape/breakoutWhen I choose a side to trade I take a rather unconventional approach in theory - I trade on the side with the most sophisticated algos driving the market. We don't have access to those algos but we can track their "thumbprints." Check out why I'm personally bullish for the coming weeks:
At the 15 minute interval we have wyckoff accumulation as the general picture. Within that, however, fractal Elliots
- Blue is a running flat with a leading diagonal coming off the 3-3-5 completion
- Green is occuring at the 3-5 minute intervals so difficult to see at 15 (but 15 is the lowest interval TV lets us post so you'll if you go to the smaller intervals yourself you'll see what I'm saying).... yep, another running flat that is completing now - expect a leading diagonal out of that with waves around some critical levels highlighted below:
* apprx 451 (or SPX500USD equiv. 4525) is the gamma inversion level where we go from negative to positive gamma exposure - this is also the gap fill from the other day {expect upcoming wave 2 around here to test support after breaking through on wave 1}
** apprx 455 - this is the flag resistance thats been developing over last week, we tested that support at the bottom of the first flat (blue); excpect wave 4 to test support here before finalizing the breakout on that upcoming wave 5.
Target after breakout is SPY 473.

$TUR Turkey bullish breakoutNice breakout here on Turkey ETF TUR and close above 30week MA
I'm long shares
Technically looks like Wyckoff accumulation pattern with "Spring" action in DEC and now entering phase D
Expect a little LPS pullback , but I remain bullish above 20 zone.
First target 24 zone, implies 30 , and a possible break there , well it's been resistance since JUL 18 so would expect a massive move there.
Will add size as the trade works and on a nice pullback.

BTC-USDTWyckoff accumulation schematic
Once the Wyckoff accumulation is over, the price will move sharply higher as demand will exceed support. Buyers will experience an impulsive bullish pressure in which most money is generated from a buying position.
Target 50k +/-

LUNAUSDT Wyckoff Price CycleLUNAUSDT Wyckoff Price Cycle, showing accumulation area and distribution area.

Wyckoff ReAccumaltion in SLP? Possible bullish Although SLP has unlimited supply, technical analysis is still working in this coin. wyckoff pattern was shown last time in SLP and works properly
As you can see it works here..
Now we need to complete the Wyckoff Re-Accumulation. LPS & SOS should be visible in the next few days so SLP will go up again after this.
This will be also possible since end of MARCH origin version 3 will be launced in Axie games which will increase the investors, players and breeders. Plus new burning mechanism of SLP is on the way this year. So even in fundamentals this is a bullish news. :-)
PLEASE DYOR and this is not a financial advise. Make this chart as a guide only and do your personal TA.

ALGO.Usdt (Y22.P1.E2).Consolidation phase EHi All,
#ALGO
This is a continuation of the previous post (link below).
Based on Wyckoff stages, we are at consolidation phase E before making the big move.
All the best,
S.SAri
PREVIOUS POST, link
==========================
VET Sign of Strength RallyThe VET price had been observed in a horizontal re-accumulation trading range from Jan 22, 2022 to Mar 27, 2022. The VET price exited this re-accumulation trading range with the SOS rally.
I will make a long entry at the BU/LPS event (around $0.07) and take profit around the next resistance cluster around $0.10. The upper and lower boundaries of the re-accumulation trading range are given by the horizontal black lines.
Blue arrows mark volume spikes.
Wyckoff abbreviations: automatic rally (AR), change of character (CHoCH), sign of weakness (SOW), failed upthrust (FUT), selling climax (SC), sign of strength (SOS), back up (BU), last point of supply (LPS).
This is not financial advice. I am not your financial advisor. This is my opinion.
