Ford -- Big PictureFord + Wyckoff, from 1968 - 2021
Part of a study of some legacy stock's long-term trajectories as a comparison to a younger ticker, like AMC.
Wyckoffdistribution

we got a BTC distribution Not going to elaborate much on this though there seems to be a distribution thats been going down at the top of this massive ascending channel starting back in the summer,
Winter is here boys and girls, I see a small little upside followed by the ending phase of this distribution and out of the ascending channel.
next support around 48k ish
That's all folks

Bitcoin Wyckoff December 2021 Prediction Sunday 11/28 (Bitcoin currently $54,270)
This analysis was inspired by the video "BITCOIN MEET WYCKOFF - URGENT VIDEO" by Market Makers. In his video he explained how Bitcoin could reach $42.9k. Please watch the video first for more context. At first I couldn't believe that could happen but after doing some analysis on my own I realized that he could be right. Below is my prediction of where the Bitcoin price could go within the next month or so.
Prediction: The Distribution from early February - mid May had Bitcoin test the .5 fib level ($46,775) before going slightly above the .786 fib level ($57,000). After that it dumped to the 0 fib level ($28,868). I could see Bitcoin doing something very similar. This is my prediction; Bitcoin could retest the .382 level ($52,853) then pump to just above the .786 fib level ($63,408). From there it'll drop to the 0 fib level ($42,893).
Analysis: $42,893 is the price target out of the ascending channel and $42,893 makes sense as the bottom when I tried to draw the fib retracement.

Bitcoin test demand zone 52k ? BTC Wyckoff distribution analysisHello there,
This is BTC analysis by Wyckoff method
After testing the trade range in LTF, BTC maybe in a distributed structure.
It could test demand zone around 52k.
This will be confirmed when we have SOW.
Here, there is a selling opportunity with the Quasimodo structure.
A short-term trade with low risk.
Z Concepts is a free blog sharing how to use Wyckoff theory, supply and demand , Price Action and some other modern technical analysis methods.
Follow to update more effective gold trading cases!
------------------------------------------
Attention:
React to price action based on specific trading plans, rather than predictions.
This is my personal idea and analysis, please just see it as an example for reference.
You also need your own judgment, analysis as well as a trading plan to manage risks when trading Forex.
If you find the article useful and interesting, please leave a comment !

$BTC Wyckoff Distribution Pattern Potentially seeing this pattern play out, its tracking pretty well so far.
Will be paying close attention.

GOLD WYCKOFF THEORYGold Price Forecast: XAU/USD hangs near multi-week low, bears flirt with $1,800 mark
Gold struggled to preserve its modest intraday recovery gains from a near three-week low.
Hawkish Fed expectations, elevated US bond yields, stronger USD contributed to cap gains.
COVID-19 jitters could lend support to the safe-haven metal and help limit the downside.
Gold gained some positive traction during the first half of the trading action on Tuesday, albeit struggled to capitalize on the move. The XAU/USD has now surrendered a major part of its intraday gains and was last seen trading just above the $1,800 mark, around the lowest level in nearly three weeks touched in the previous day.
The recent US dollar rally got a strong boost on Monday after US President nominated Jerome Powell to serve as the Fed chairman for a second term. The fact that investors considered the other leading candidate, Lael Brainard, to be the more dovish of the two, the announcement reinforced bets for higher US interest rates. This, in turn, pushed the USD Index to a 16-month peak and prompted aggressive selling around the dollar-denominated gold.

Will Gold downward to 177x ? Unique gold idea with QML setup This post is analyzed according to the Quasimodo structure.
Gold was be distributed from top trade range.
XAUUSD is most likely bearish at the 4h timeframe.
There is a Quasimodo (QML abbreviated) structure if the price returns to 177x level.
Waiting for confirmation structure on lower time frame (LTF).
The QML is Quasimodo level. This is an strong reversal structure.
------------------------------------------
ATTENTION:
We are not trying to predict price, but just react to price action with specific trading plans.
This is my personal idea and analysis, please just take it as an example.
You need judgment and a trading plan to manage your risks when trading Forex.

Wychoff Distribution In BitcoinNew to charting and T/A but I couldn't help but notice this pattern. Does anyone else see this? What am I missing? If this pattern is correct, we could see a bounce around here followed by a significant decline.

Can we short USDJPY? Wyckoff analysis indepth, RR 12:1This post is analyzed according to the Wyckoff method and find the entry point according to the Quasimodo . structure
USDJPY is most likely distributing at the 4h frame.
There is a Quasimodo (QML abbreviated) structure after the price returns to the Trade Range.
Wait to sell at LPSY when there is confirmation structure on small time frame ( LTF ).
Reward - Risk Ratio, 12:1
The QML is the area from the left shoulder to the top of the Quasimodo setup.
------------------------------------------
ATTENTION:
We are not trying to predict price, but just react to price action with specific trading plans.
This is my personal idea and analysis, please just take it as an example.
You need judgment and a trading plan to manage your risks when trading Forex.

Wyckoff DistributionIn my opinion this would fit to the volume profile and to the market sentiment as well to the time. This does not offer me an entry.. but it may can protect people from losing money ;)

BTCUSDT wyckoff distributionFew months back we had a completed accumulation phase on BTC which led us to attaining new ATH. Since then BTC has been in a state of consolidation ... By wykoff BTC is presently in a distribution phase. As you can see the uptrust (UT) has been achieved. And BTC is presently in a demand zone which should be able to hold and pull price to creating new ATH , aiming a bit above the recent ATH to create the uptrust after distribution (UTAD). And from here. It's advisable to look for short positions as we might then have a Mark down. Taking all FOMO buyers as liquidity next line of action I would be looking at is 48k zone. A financial advice. ( Don't be part of the FOMO traders to avoid rekt)

NAS100 Short Position.Short The Market NAS100. Spring test, Market Will Probably Make 1-3 Tests of available Supply. So Stay within your position

GOLD short @ LPSY ( 1862).. 17/Nov/21.Short Gold at 1) LPSY ( Last Point of Supply ) Zone AND 2) Volume Profile ( POC) near 1862 .After Price re bounce near SOW ( Sign of Weakness ) Support. Stop Lost at 1876.95 ( Plus your broker spread )

BTC Bitcoin prior fractal playing out?I took the prior Wyckoff distribution fractal from March-May 2021 range and copied it to the current price. Could we see the price increase from this point before we start the Wyckoff distribution pattern again? It looks eerily similar.
What are your opinions on this? Comment below, hit the like and follow me. Thank you!
Check out more below for recent Altcoin, Bitcoin and Stock Ideas.
Disclosure: This is just my opinion and not any type of financial advice. I enjoy charting and discussing technical analysis . Don't trade based on my advice. Do your own research! #cryptopickk #bitcoin #altcoins

second Wyckoff distribution making another top?Looks like we are following another distribution pattern.
This would be invalidated by a break of 71K.
Otherwise wait for the next test of 67K to 2 "sell the top"

Wyckoff distribution was played. bull run end?Basically taproot date was the LPSY. I do hope this is just a spring

GOLD seem in Wyckoff's Distribution Stage.( Bull Trap).16/11/21GOLD's price seem like "Squeezing" @ :- 1) Major Down Trend line ( Yellow Dotted) 2) Supply Zone ( Red Rectangle Box ). PLUS + its price shown we're " in " Wyckoff's Distribution Stage" with VSA ( Volume Spread Analysis) ...Conclusion :- Price structure doesn't look good for Bull Run...Properly Maintain "bearish outlook" at around 1870

EURAUD RE-DISTRIBUTIONWell! well! WellLook at what we have here EA has a offerred an amazing text book re-distribution pattern that I am very much in love with.
This is basically Free money loading.
Happy charting, Have a blessed week y'all

BTCUSD is getting ready for PullbackBTCUSD is looking to test 50K Levels in upcoming trading weeks. The particular level that I've mentioned where Bulls are waiting to hit BTCUSD again.
So, if anyone wants to book your profit, This is the time to close your trades, or better to sell who are holding BitCoin in your wallets.
Thank you!

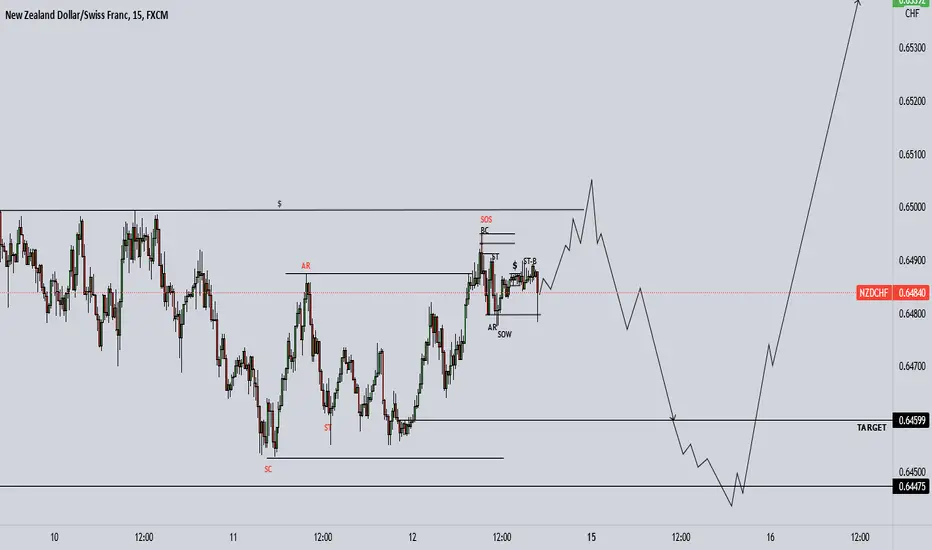
NZDCHF - NEXT TRADE LEVELSThese are the expected price moves of NZDCHF, you can enter this with your own confirmation!, you can try to catch this for both side trades
Put your comments!
AUDCHF FOR THE SELLRedistribution for the continuation play to the downside. Found a institutional candle that needs mitigation within the LPSY that formed during NY Session which holds significance from my recent backtesting. Found a few full volume candles at my POI on different timeframes which shows correlation and confluence. Measured the 50% & 80% as these two percentages are levels where market likes to react from based on backtesting. Have set sell limit at 80% of the 5M candle and SL just above the high of the particular candle of 3.5 pips.

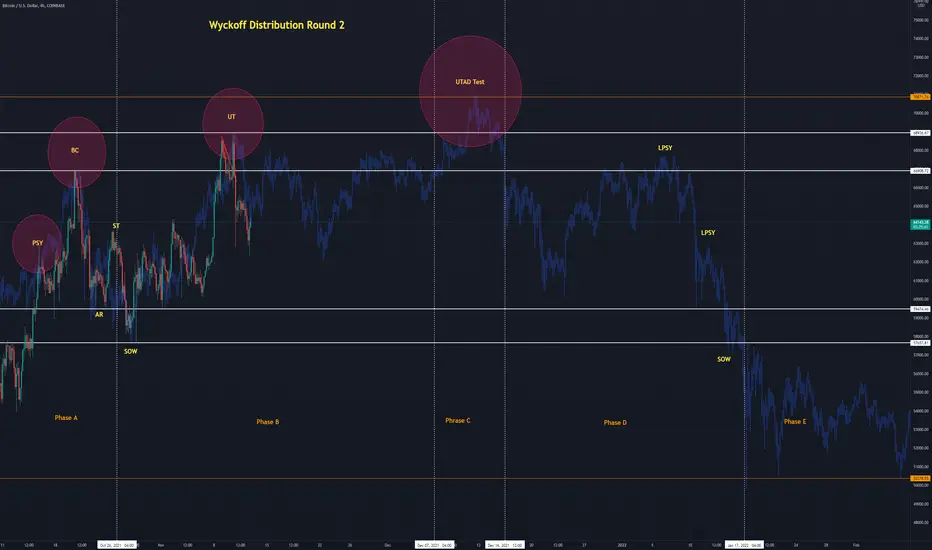
Bitcoin Wyckoff Distribution (Round 2)Using the percentage measured moves from Wyckoff Round 1, looks like the targets would be $70,800 and $50,400.
USDJPY - TRADE FORECASTHere I'm sharing the next move of USDJPY in upcoming weeks. Take advantage of it with your own entry and exit rules. Thank you.
