Wyckoff Distribution in DxyWyckoff Distribution in Dxy and Bearish RD in weekly
looking to hit the lower end of the rising channel
Wyckoffdistribution

GOLD D1 Wyckoff distribution price cycleGOLD D1 Chart Analysis using #Wyckoff distribution, mapping gold pattern to Wyckoff distribution price cycle. Let we see more possibility in gold trading.

Wyckoff Redistribution - 22.8k to 18.3kWyckoff Redistribution to 22.8k
First, the fundamentals:
Bitcoin is currently in a clear distribution phase, as supported by volume and the fact that big players are selling and small players are buying (seen by the amount of BTC wallets holding BTC increasing, with those wallets having smaller number of BTC in them).
Next:
A shark pattern has emerged on the 4 hour chart, and BTC has bounced around the 1-0.886 retracement area. Usually in a circumstance like this, Take Profit would be around 50% of BC, which in this case is around the same area of 22.8k. The bounce point from C-D leg would complete the bullish harmonic pattern and can potentially signal the continuation of the downtrend.
If we measure the 1.618 of OX we get 18,250. If we measure the 2.236 of a potential CD at 22.8k we get the exact same point - 18,250. Now this is more than just coincidental given the PSY level on the Redistribution schematic.
Next, the 2.236 level in harmonics are usually seen in patterns like the Crab, Gartley, Shark or Partizan. This bearish leg can bounce at 1.618 (19.5k) and continue to fall straight down to 2.236 (18,250) which is likely. This is where we close our SHORT and flip LONG.
Wyckoff Law mentions how we can have an extreme impulse towards BC (Buying Climax) to test the previous Preliminary Supply. Now there is a reason we are not choosing 23.5k for this (as you can see in the pattern on the right hand side, the point next to the letters "Phase A" is likely to be 23.5k.
An automatic rally (AR) can occur when selling volume has diminished. There are likely going to be buyers buying at the 0.5 or 0.618 retracement of CD before last chance SHORT retesting UT/ST around 22.7k.
Finally, stocks look like they are about to crash and should drag Bitcoin down with it. DXY is also rallying and showing no signs of slowing down mid term.
Also, the 200MA weekly is not that important here but a good resistance level in case we somehow break 22.8k. I think not likely though.

My idea for Gold, Wyckoff DistributionHere is a potential move on Gold to the downside, based on recent Bullish mitigation events and the fact we touched a major Weekly Supply zone, and that the bullish trend from 1680 is long due for a small correction down to an estimated 1770 or 1753.
(Disclaimer, NOT FINANCIAL ADVICE)

BTC End of year runThis is a full chart of my current thinking.
And the first part in many new trend charts i am going to post.
NOT TO BE FOLLOWED

Wyckoff Distribution? EUR/USDviewing the wyckoff schematics this looks like distribution to me. i will be keeping an eye on this when market opens

Don't fall for the trap.The market is gonna confuse you to buy and sell and take away all the money!!
Keep trading money apart from investing money. Make a strategy and follow it. Don't gamble off your hard-earned money. DCA but with proper knowledge you know when to invest in...

WYCHOFF REDISTRIBUTION SCHEMATIC?!The failure to generate new highs signals the start of the distribution phase. This phase displays rangebound price action similar to the accumulation phase but marked by smart money taking profits and heading to the sidelines. In turn, this leaves the security in weak hands that are forced to sell when the range fails in a breakdown and new markdown phase. This bearish period generates throwbacks to new resistance that can be used to establish timely short sales.
Price can go around 25000 and then falls back. It looks like a fake pump. Bearish divergence as well.

BTC Reaction at Re-Distribution Trading Range Upper BoundThe BTC price continues to be observed within a Wyckoff re-distribution trading range (to be confirmed or to fail) with the upper bound given by the automatic rally (ARa) daily high and the lower bound given by the selling climax (SC) daily low.
The secondary test (ST) on July 3 had a Spring-like effect, catalyzing a very nice rally (+19%) that wicked above the trading range upper bound. I expect the BTC price to test the point of control (POC) around $20,472. Let’s see how the BTC price reacts at the POC (e.g., Will it fall through the POC support or reverse direction?).
With regard to the Phoenix Ascending (PA) indicator (lower panel), upward momentum (Energy, grey) is diminishing. We will be observing downward momentum soon. The blue line at level 70 will provide support for the BTC price. Given the levels and likely trajectories of the blue and red lines, a steady, step-wise move down (similar to the reaction from June 26 through July 3) seems likely.
Wyckoff abbreviations: automatic rally (ARa), selling climax (SC), secondary test (ST), upthrust (UT), upthrust after distribution (UDAT), preliminary supply (PS), failed upthrust (FUT), last point of supply (LPSY), shakeout (SO), sign of weakness (SOW), Phase A (Ph A), Phase B (Ph B), Phase C (Ph C), Phase D (Ph D), Phase E (Ph E).
This is not financial advice. I am not your financial advisor. This is my opinion.

Nasdaq 100 in Wyckoff Re-Distribution Trading RangeThe Nasdaq 100 index (NDX) price continues to be observed in a down trending Wyckoff re-distribution trading range. The NDX price broke the support of the previous trading range on Jan 18, 2022 and the downward price move was halted several days later with the selling climax (SC) event.
Here I offer two scenarios for the future NDX price: (1) a bullish scenario, and (2) a bearish scenario.
For the bullish scenario to play out, the NDX price needs to break the closing price on May 25 ($11,935), May 26 ($12,282), and May 27 ($12,665). Failure to do so would invalidate the bullish scenario.
For the bearish scenario, the price would need to reverse then break the trading range support ($11,334). If this were to occur, the NDX would likely find support at around $10,500. Failure to break the trading range support would invalidate the bearish scenario.
Given the strong positive correlation between the NDX and BTC, which can be viewed as a risk-on stock, Bitcoin HODLers will be watching these events play out with great interest. Happy trading!
Wyckoff abbreviations: automatic rally (ARa), selling climax (SC), secondary test (ST), upthrust (UT), failed upthrust (FUT), shakeout (SO), sign of weakness (SOW), upthrust after distribution (UTAD).
This is not financial advice. I am not your financial advisor. This is my opinion.

Wyckoff Logic Supply and DemandGBPCAD
Technical analysis
Cause, re-distribution, equilibrium sequence between demand and supply between quotas , supply zone 1.60951 & 1.57746 demand zone .
Supply greater than Demand!
Implications, bearish!
Pattern Drop base Drop!
Effect generated by approx
416 pips.
SL 1.57459
Entry , sell! 1.55645
TP 1.51461
⭕ = circle
⏹ = square
🔺️ = triangle
Unit = ⭕ market
Polarity = 🔺️demand & 🔻supply
Equilibrium = ⏹ range ("the ratio between supply and demand is =")
PRINCIPLE OF DEMAND AND SUPPLY
The law of supply and demand
- here the analysts study the relationship between supply and demand , having as a reference point the price and
volume over a period of time as shown on the chart.
KEY DEFINITION
The law of supply and demand is of the utmost importance. If the application to
buy an instrument (currency pairs, stocks, commodities , metals, bonds, cryptocurrencies)
is higher than the available supply, the only way the demand can be met is
for the price to rise to a level that attracts enough supply to match demand.
When this point is reached, the price does not advance. If the offer to sell is
higher than the demand to buy, the only way the supply will be absorbed is as
the price drops to a point that attracts enough demand to absorb all
the amount. When that happens, the price doesn't go down.

BTC LONG Until 21.4k / 22.3k then SHORT to 16.3k!I made a previous Wyckoff chart too early on and I imagine lots of Bears were expecting a dump a lot earlier than how it actually happened.
Now we are at this point, the situation is very clear.
I can see this whole dump has been circled around the Monthly close.
Now sometimes, there will be an initial Bull trap pump on the Monthly close, so I won't be setting Limit orders at 21.4k because I could wake up rekt. I am aware this could take us to 22.3k. (Apologies, my 2nd red squiggy line should have drawn it to 22.3k)
However a max of 21.4k here is also a possibility, before we finally dump. I will be Market ordering based on what I see on the 1 minute charts during these levels.
I am currently LONG 20,680 with a TP of 21,390.
Something tells me I won't be getting much sleep 1st-2nd July!

BTC Big Short and Buy of this current cycle bottom.Thank you Wyckoff for educating us.
Please read from top to bottom.
Be careful, don't trust the moon boys. You are just getting dumped on by the smart money that came in at 3,000 to 7,000.
Buy the FUD. Sell the FOMO.
Think long term.

BTC to Test Support of a Wyckoff Re-Distribution Trading RangeThe BTC price continues to be observed in Phase B of a Wyckoff re-distribution trading range. We should consider this a re-distribution trading range (to be confirmed or to fail based on market events) rather than a re-accumulation trading range as the BTC price has been in a down trending environment for the past 6 or so months. This Wyckoff re-distribution trading range (upper bound = $31,520; lower bound = $25,340) is interesting in that the price has spent the majority of the time in the upper portion of the trading range (green shading, lower boundary of the upper portion is given by the low of the preliminary support (PS) event). In most cases, the price would test the trading range support level ($25,340) several times as it moves through the range so, in this regard, the trading range is a bit atypical.
That said, it appears that BTC will be testing the trading range support level ($25,340) soon as it already has broken support at the PS event and the BTC price is observed in the lower portion of the trading range (red shading, lower boundary of the lower potion is given by the selling climax low) in what might be a shakeout/sign of weakness (SO/SOW) event. This idea is consistent with the Phoenix Ascending (PA) indicator, given in the lower panel. I expect both the red and blue lines and likely the BTC price to continue on their downward trajectory.
Note the low volume over the last week compared to the climatic volume observed at the PS and selling climax (SC) events. This tells me two things: (1) The BTC price is able to move downward through the trading range with relative ease. If the trading range support is to hold then demand needs to be observed. (2) As the beginning and the end of Wyckoff trading ranges are typically marked by climatic level volume, BTC will likely continue within this trading range.
Significant bars, which help define important areas of support and resistance, are given by the blue shading. Wyckoff abbreviations: automatic rally (ARa), selling climax (SC), secondary test (ST), upthrust (UT), preliminary support (PS), failed upthrust (FUT), last point of supply (LPSY), shakeout (SO), sign of weakness (SOW), Phase A (Ph A), Phase B (Ph B), Phase C (Ph C), Phase D (Ph D), Phase E (Ph E).
This is not financial advice. I am not your financial advisor. This is my opinion.

Wyckoff Logic Supply and Demand
EURCAD
Technical analysis
Cause, distribution, equilibrium sequence between demand and supply between quotas , supply zone 1.37680 & 1.33910 demand zone .
Supply greater than Demand!
Implications, bearish!
Pattern Drop base Drop!
Effect generated by approx
789 pips.
SL 1.36096
Entry , sell! 1.34197
TP 1.26250
⭕ = circle
⏹ = square
🔺️ = triangle
Unit = ⭕ market
Polarity = 🔺️demand & 🔻supply
Equilibrium = ⏹ range ("the ratio between supply and demand is =")
PRINCIPLE OF DEMAND AND SUPPLY
The law of supply and demand
- here the analysts study the relationship between supply and demand , having as a reference point the price and
volume over a period of time as shown on the chart.
KEY DEFINITION
The law of supply and demand is of the utmost importance. If the application to
buy an instrument (currency pairs, stocks, commodities , metals, bonds, cryptocurrencies)
is higher than the available supply, the only way the demand can be met is
for the price to rise to a level that attracts enough supply to match demand.
When this point is reached, the price does not advance. If the offer to sell is
higher than the demand to buy, the only way the supply will be absorbed is as
the price drops to a point that attracts enough demand to absorb all
the amount. When that happens, the price doesn't go down.


Gold trading today, XAUUSD analysis and estimating targetDid you analysis XAUUSD today?
Here's a Wyckoff scenario for Gold.
We have a distribution schematic in 1h time frame.
What is the potential gold price target?
This is estimate target of Wyckoff distribution for taking profit of short orders above.
So we have safe target at 1817.5 (for above positions).
We're using P&F chart & measure movements.
Today, we'd like to see a pullback to LPSY for new short entries.
Let's see price action there.
We measure movements to take profit and find new timing zones for next orders.
Hope this post could help you make better XAUUSD analysis.
Do you want to see more posts about Gold trading?
---------------------------------------------------------------
* This is Pre-plan and an education post
Our Gold's analysis based on Wyckoff method, Gann trading and price action.
That means my view can change, depending on how the price will arrive at the level and what will be happening on the M5 in my level of interest for entry. Then I will decide if I will enter or not. So please don't just blindly follow this. The FX market is a quickly changing environment and it requires full focus on the levels for the precise entry with low risk.
* DISCLAIMER
We are the only one person who is responsible for our health, relationships, success, and money in our lives. So taking a risk on the markets based on this idea is only and only your decision. You deserve the profit and you are responsible for your potential loss. Any opinions, news, research, analyses, prices, or other information discussed in this presentation or linked to from this presentation are provided as general market commentary and do not constitute investment advice. The author of the analysis does not accept liability for any loss or damage.
* Legal Risk Disclosure
Trading foreign exchange or CFD on margin carries a high level of risk, and may not be suitable for all investors. The high degree of leverage can work against you as well as for you. Before deciding to trade foreign exchange you should carefully consider your investment objectives, level of experience, and risk appetite. The possibility that you could sustain a loss of some or all of your initial investment and therefore you should not invest money that you cannot afford to lose. You should be aware of all the risks associated with foreign exchange trading, and seek advice from an independent financial advisor.

GBPUSD possible distribution next weekWe've been bullish with GU since mid-may. Now the price is reaching 1.27-1.28 area possibly forming a distribution structure.
Once we'll have reached that supply area, we'll be looking for SELL opportunities, but only after the price gives us signs for that (Break of Structure to the downside), pull back to the area and then entry.
However, if the price goes above our supply within the next few days, we'll stay bullish, with the outlook for BUY opportunities. Only time will tell.
Safe trading everyone!

EURUSD possible upcoming distributionEU is reaching a significant daily resistance zone between 1.08 and 1.09. If it manages to reach 1.085 we can start seeing some more signs of potential distribution here (+fib 0.618-0.786 area confirmation). After that we'll start looking for SELL positions (preferable once we've broken the upcoming structures to the downside).
If that happens we can see the price reaching 1.066 (or a push to 1.055 is also a possibility) in the upcoming weeks.
However, if we'll see a strong momentum breaking 1.085 and going higher, this setup will no longer be valid and we'll start to look or BUY opportunities.
Happy trading!

Bitcoin Analysis 5/19/22 (Wyckoff Distribution Schematic #2)Bitcoin appears to be following the Wyckoff Distribution Schematic #2 on the 3 Day Chart.

BTC in Phase B of a Wyckoff Re-Distribution Trading RangeIn my previous publication, I opened a long position at what I thought at the time was a selling climax (SC). My analysis was incorrect, as what I thought was a SC was, in fact, a preliminary supply (PS) like event. The PS is known as the first concerted attempt to stop the down trend. Lesson learned.
Nevertheless, the BTC price has entered another Wyckoff re-distribution trading range, which is to be confirmed or to fail based on market events.
We are in Phase B as we’ve observed the SC and the automatic rally (ARa). Therefore, I’d expect the price to test the lower boundary of the trading range in the form of a secondary test (ST). This idea is consistent with the Phoenix Ascending (PA) indicator, given in the lower panel. I expect the red line to be rejected near level 50 then turn back down and for the green line to continue moving downward. The energy fall below 50 soon, indicating downward pressure on the price.
Significant bars, which help define important areas of support and resistance, are given by the blue shading.
Wyckoff abbreviations: automatic rally (ARa), selling climax (SC), secondary test (ST), upthrust (UT), upthrust after distribution (UDAT), preliminary supply (PS), failed upthrust (FUT), last point of supply (LPSY), shakeout (SO), sign of weakness (SOW), Phase A (Ph A), Phase B (Ph B), Phase C (Ph C), Phase D (Ph D), Phase E (Ph E).
This is not financial advice. I am not your financial advisor. This is my opinion.

Wyckoff Distribution Schematic On DJIWhich comes first, the chicken or the egg?
With recession talk being forced upon the economy, and many negative economic factors likely playing a huge role, it begs the question.
With a understanding of Wyckoff and how large institutions transfer money, one could see how the looming recession may not be such a unlucky series of events?

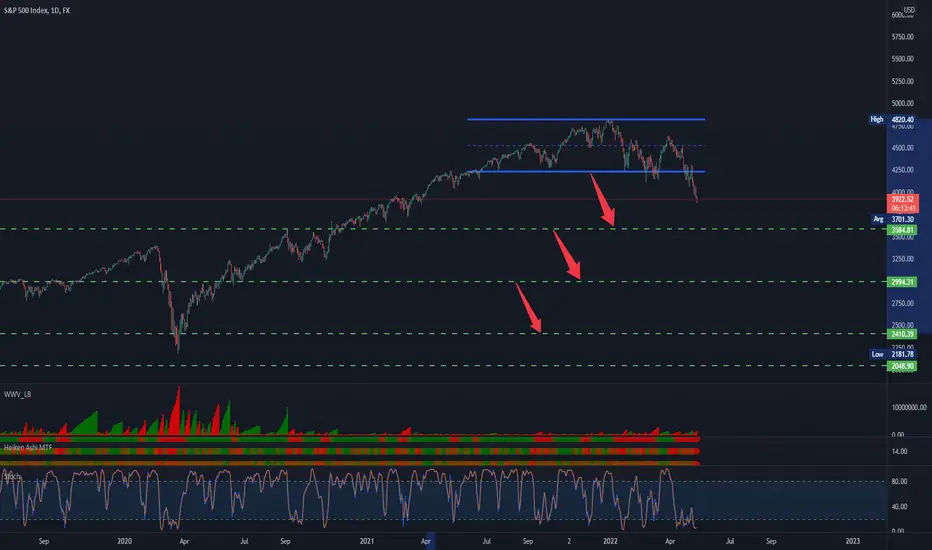
Wyckoff Logic Supply and Demand
SP500
Increases the probability of a fall of approx -50% , bear market