CARVANA - LongGood Day!
Have been tracking this idea for a while, and we've seen excellent upside so far.
Retracements could provide further opportunities to increase positions.
What do you think about above?
Best,
Figuring Out Finance
Wyckoffmethod

Wyckoff Logic Supply and DemandBTC TF-H4 technical analysis
Today on 30.07.2022, the price at which bitcoin is traded is 24572 USD. Approximately 6 weeks the price action is in a period of consolidation that is between the quotas;
* 21606 USD upper limit ( supply zone )
&
* 17599 USD lower limit ( demand zone )
We also have an elliott wave sequence with three impulsive waves and 2 completed berish corrective waves.
The initial cause was the redistribution consolidation area between the quotas with;
* 45843 USD upper limit ( supply zone )
&
* USD 33100 lower limit ( demand zone )
Conclusion
The general sentiment is predominantly depreciating.
But the consolidation area between the quotas
* 21606 USD upper limit ( supply zone )
&
* 17599 USD lower limit ( demand zone ), plays a crucial role that can bring about a change in the direction of depreciation.
From the point of view of logical wyckoff analysis, on TF-H1 we are in a consolidation sequence after a depreciation trend with the formation of the cause that passed from phase A with the change of character from the down trend in a consolidation structure and transition to phase B of the campaign.
It remains to be seen whether this campaign is one of accumulation that will have an implication of appreciation or redistribution that will have an implication of depreciation of the Bitcoin asset.
Update
we have confirmation that the consolidation sequence is of accumulation type, the demand exceeds the supply, appreciation implication!

Wyckpff Logic & Supply and DemandNZDUSD
Technical analysis
Cause, re-accumulation, equilibrium sequence between demand and supply between quotas , supply zone 0.62724 & 0.61851 demand zone .
Demand greater than Supply !
Implications, bullish!
Pattern Rally base Rally -Drop Base Rally!
Effect generated by approx
95pips.
SL 0.61907 (SL move to pozitive)
Entry, Buy! 0.62710
TP 0.63649

CLVS signs of Life? Break outAfter following this since hit flat lined at .81 cent I saw clear cut signs of accumulation and break out. Right at the end of the option chain cycle. Which ended today. The fact that it jumped to above a $1 on this day shows to me that its serious about bouncing off the bottom. Otherwise it could have just stayed below $1 until after today. It jumping above a dollar today means someone lost money or that they dragged it so far down that even if it came up it didnt matter..... Now we have a full month in this option call to run. does it go parabolic? or does it re-accumulate from here to inch its way back up?
i marked two key areas in blue for when obvious change tot he price action can happen.
by iCantw84it
06.17.22

Wyckoff Re-Accumulation idea for gold.Here is my take on current gold PA.
We have successfully tested last week's highs and given a very choppy shakeout for bears to feed on.
So far everything looks set for a re-accumulation, with FOMC as the catalyst for this move.

ADAUSDT - Stop Hunt with Wyckoff Method📉📈Hi Traders, Investors and Speculators
Ev here. Been trading crypto since 2017 and later got into stocks. I have 3 board exams on financial markets and studied economics from a top tier university for a year.
A quick look at Cardano / ADAUSD / ADAUSDT . I believe that we are currently in the market cycle of accumulation , according to the Wyckoff Method market phases. The four phases of the market cycle are accumulation, markup, distribution, and markdown.
During the accumulation phase, a new cycle begins that generates a trading range. The pattern often creates a strong resistance zone / failure point / spring . This is the precursor to another bull cycle, but it can last an extended period of time. The final moments of this phase will attract algorithm trading driven stop hunting , often observed near downtrend lows, where price drops just underneath key support and then triggers a sell-off. This is followed by a recovery wave that lifts the price back above support.
So - What Is Stop Hunt ?
Stop hunting is a strategy that attempts to force traders out of their positions by driving the price of an asset to a level where many people have chosen to set stop-loss orders. The triggering of many stop losses at once typically creates high volatility and this is often very obvious during the accumulation phase of the Wyckoff Method.
If we take all of the above into consideration, the price of Cardano can still drop and fall within a range multiple times until a clear bottom is established and the next markup phase / bull cycle starts. In the video above, I take a look at possible bounce zones and a target for the SOS ( sign of strength, a price advance on increasing spread and relatively higher volume ). I have also highlighted the next phase of the accumulation cycle, the BU (back-up). At this point, short-term profit-taking occurs and a test for additional supply around the area of resistance. A back-up is a common structural element preceding a more substantial price mark-up (SOS) .
Here, I did an analysis on Bitcoin / BTCUSD / BTCUSDT using the Wyckoff Method:
Related news Highlights in Crypto :
📢Elon Musk claims crypto is not contributing to an environmentally sustainable future, also says that Tesla has not sold any of its Dogecoin holdings and he will be open to increase Bitcoin holdings again after recently selling 75% of Tesla's btc holdings
📢 Jed Mccaleb closes his infamous “tacostand” XRPUSDT account
📢UK Finance Minister announces that a bill for stablecoins will be introduced this week
📢Crypto exchange Bitstamp will charge inactive users a monthly fee of $10.20
📢XRP flips BUSD and becomes worlds 6th largest crypto by market cap
📢US Senator Cynthia Lummis says crypto regulation bill will only be considered in 2023
_________________
👀Follow us here on TradingView for daily updates and trade ideas on crypto , stocks and commodities 📉
Hit like & Follow 🔔
We thank you for your support !
CryptoCheck

Grab. Trading in elliotwave & wyckoff method. 21/July/22Grab. A unicorn “big player” in South East Asia e-hailing which also just “owned” local “supermarket called Jaya Grocer” few months ago..Its stock price structure look “attractive “..

Wyckoff Method - Target 30kAccording to Wyckoff, the market can be understood and anticipated through detailed analysis of supply and demand, which can be ascertained from studying price action, volume and time. As a broker, he was in a position to observe the activities of highly successful individuals and groups who dominated specific issues; consequently, he was able to decipher, via the use of what he called vertical (bar) and figure (Point and Figure) charts, the future intentions of those large interests. An idealized schematic of how he conceptualized the large interests' preparation for and execution of bull and bear markets is depicted in the figure below. The time to enter long orders is towards the end of the preparation for a price markup or bull market (accumulation of large lines of stock), while the time to initiate short positions is at the end of the preparation for price markdown.

Wyckoff Logic Supply and Demand AUDJPY
Technical analysis
Cause, re-accumulation, equilibrium sequence between demand and supply between quotas , supply zone 94.529 & 92.578 demand zone .
Demand greater than Supply !
Implications, bullish!
Pattern Rally base Rally !
Effect generated by approx
250pips.
SL 92.915
Entry , Buy! 94.110
TP 96.641
⭕ = circle
⏹ = square
🔺️ = triangle
Unit = ⭕ market
Polarity = 🔺️demand & 🔻supply
Equilibrium = ⏹ range ("the ratio between supply and demand is =")
Accumulation with the 5 phases and the 9 events!
1. Phase A- Stopping the previous trend
2. Phase B- Construction of the cause
3. Phase C- Competition assessment
4. Phase D- Beginning of trend movements
5. Phase E- Confirmation of direction
An accumulation interval is a lateral movement of the price preceded by a downward movement on which an absorption maneuver is performed by large traders in order to accumulate stock in order to sell it at higher prices in the future and make a profit from the difference.

Bitcoin - Bottom with Wyckoff MethodHi Traders, Investors and Speculators 📉📈
Ev here. Been trading crypto since 2017 and later got into stocks. I have 3 board exams on financial markets and studied economics from a top tier university for a year.
With this chart, I propose my idea of a potential Bitcoin / BTCUSD / BTCUSDT bottom by using the Wyckoff Method . The Wyckoff Method can be extremely technical and complicated, with many phases, sub-phases, sub sub phases etc. The four main phases of the market cycle are accumulation, markup, distribution, and markdown . On this specific chart, we're taking a look at the accumulation cycle.
In this example, I'm pointing out all of the main phases with the turquoise anchor notes. You can scroll over them to see which phase it represents.
I used time cycles (at the top of the chart) as a mere point of reference, I am by no means claiming to know what will happen on which date. As I tried a few things, this time based cycle just so happens to fit well into the time frame that I have in mind for these phases.
Here are some terms and definitions you may find helpful when scrolling over the turquoise note anchors:
PS—preliminary support - where substantial buying begins to provide pronounced support after a prolonged down-move. Volume increases and price spread widens, signaling that the down-move may be approaching its end.
SC—selling climax - the point at which widening spread and selling pressure usually climaxes and heavy or panicky selling by the public is being absorbed by larger professional interests at or near a bottom. Often price will close well off the low in a SC, reflecting the buying by these large interests.
AR—automatic rally - which occurs because intense selling pressure has greatly diminished. A wave of buying easily pushes prices up; this is further fueled by short covering. The high of this rally will help define the upper boundary of an accumulation TR.
ST—secondary test - in which price revisits the area of the SC to test the supply/demand balance at these levels. If a bottom is to be confirmed, volume and price spread should be significantly diminished as the market approaches support in the area of the SC. It is common to have multiple STs after a SC.
SOS - sign of strength, a price advance on increasing spread and relatively higher volume. Often a SOS takes place after a spring, validating the analyst’s interpretation of that prior action.
LPS - last point of support, the low point of a reaction or pullback after a SOS. Backing up to an LPS means a pullback to support that was formerly resistance, on diminished spread and volume. On some charts, there may be more than one LPS, despite the ostensibly singular precision of this term.
BU - “back-up”. This term is short-hand for a colorful metaphor coined by Robert Evans, one of the leading teachers of the Wyckoff method from the 1930s to the 1960s. Evans analogized the SOS to a “jump across the creek” of price resistance, and the “back up to the creek” represented both short-term profit-taking and a test for additional supply around the area of resistance. A back-up is a common structural element preceding a more substantial price mark-up, and can take on a variety of forms, including a simple pullback or a new TR at a higher level.
Furthermore, a brief look at the phases:
Phase A
Marks the stopping of the prior downtrend. Up to this point, supply has been dominant. Selling climax (SC) occurs here.
Phase B
Institutions and large professional interests are accumulating at relatively low-prices in anticipation of the next markup. The process of institutional accumulation may take a long time (sometimes a year or more) and involves purchasing at lower prices and checking advances in price with short sales.
Phase C
It is in Phase C that the price goes through a decisive test of the remaining supply, allowing the “smart money” operators to ascertain whether the stock is ready to be marked up.
Phase D
If you've plotted the phases correctly, what should follow is the consistent dominance of demand over supply. This is evidenced by a pattern of advances (SOSs) on widening price spreads and increasing volume, as well as reactions (LPSs) on smaller spreads and diminished volumes.
Phase E
Price begins to behave bullish as demand is in full control and the markup is obvious to everyone. Setbacks, such as shakeouts and more typical reactions, are usually short-lived.
All of the above in mind, I believe we are currently trading in Phase B of the Wyckoff Method Accumulation phase. This means that we may still test support zone / resistance zone multiple times, until a clear bottom has been established. This, according to my analysis, could be around $12K, which has been a previous support zone during NOV/DEC 2020.
_________________
👀 Follow us here on TradingView for daily updates and trade ideas on crypto , stocks and commodities 💎
👍Hit like & Follow 🔔
We thank you for your support !
CryptoCheck


Bitcoin Wyckoff Analysis P&F Chart v.2Revising my #Bitcoin down target to $15,500👌
In the redistribution range, I should have counted from LPSY → AR instead of LPSY→ SC...

Wyckoff Logic Supply and Demand BTC TF-H4 technical analysis
Today on 16.07.2022, the price at which bitcoin is traded is 20605 USD. Approximately 4 weeks the price action is in a period of consolidation that is between the quotas;
* 21606 USD upper limit (supply zone)
&
* 17599 USD lower limit (demand zone)
We also have an elliott wave sequence with three impulsive waves and 2 completed berish corrective waves.
The initial cause was the redistribution consolidation area between the quotas with;
* 45843 USD upper limit (supply zone)
&
* USD 33100 lower limit (demand zone)
Conclusion
The general sentiment is predominantly depreciating.
But the consolidation area between the quotas
* 21606 USD upper limit (supply zone)
&
* 17599 USD lower limit (demand zone), plays a crucial role that can bring about a change in the direction of depreciation.
From the point of view of logical wyckoff analysis, on TF-H1 we are in a consolidation sequence after a depreciation trend with the formation of the cause that passed from phase A with the change of character from the down trend in a consolidation structure and transition to phase B of the campaign.
It remains to be seen whether this campaign is one of accumulation that will have an implication of appreciation or redistribution that will have an implication of depreciation of the Bitcoin asset.

Bitcoin Wyckoff Analysis P&F ChartBitcoin Wyckoff Analysis P&F Chart
Chart Settings:
Box: 250
Reversal: 3

BTC Reaction at Re-Distribution Trading Range Upper BoundThe BTC price continues to be observed within a Wyckoff re-distribution trading range (to be confirmed or to fail) with the upper bound given by the automatic rally (ARa) daily high and the lower bound given by the selling climax (SC) daily low.
The secondary test (ST) on July 3 had a Spring-like effect, catalyzing a very nice rally (+19%) that wicked above the trading range upper bound. I expect the BTC price to test the point of control (POC) around $20,472. Let’s see how the BTC price reacts at the POC (e.g., Will it fall through the POC support or reverse direction?).
With regard to the Phoenix Ascending (PA) indicator (lower panel), upward momentum (Energy, grey) is diminishing. We will be observing downward momentum soon. The blue line at level 70 will provide support for the BTC price. Given the levels and likely trajectories of the blue and red lines, a steady, step-wise move down (similar to the reaction from June 26 through July 3) seems likely.
Wyckoff abbreviations: automatic rally (ARa), selling climax (SC), secondary test (ST), upthrust (UT), upthrust after distribution (UDAT), preliminary supply (PS), failed upthrust (FUT), last point of supply (LPSY), shakeout (SO), sign of weakness (SOW), Phase A (Ph A), Phase B (Ph B), Phase C (Ph C), Phase D (Ph D), Phase E (Ph E).
This is not financial advice. I am not your financial advisor. This is my opinion.

Wyckoff Logic Supply and DemandAUDUSD
Technical analysis
Cause, distribution, equilibrium sequence between demand and supply between quotas , supply zone 0.72650 & 0.68297 demand zone .
Supply greater than Demand!
Implications, bearish!
Pattern Drop base Drop!
Effect generated by approx
460 pips.
SL 0.69269
Entry , sell! 0.68155
TP 0.63476
⭕ = circle
⏹ = square
🔺️ = triangle
Unit = ⭕ market
Polarity = 🔺️demand & 🔻supply
Equilibrium = ⏹ range ("the ratio between supply and demand is =")
PRINCIPLE OF DEMAND AND SUPPLY
The law of supply and demand
- here the analysts study the relationship between supply and demand , having as a reference point the price and
volume over a period of time as shown on the chart.
KEY DEFINITION
The law of supply and demand is of the utmost importance. If the application to
buy an instrument (currency pairs, stocks, commodities , metals, bonds, cryptocurrencies)
is higher than the available supply, the only way the demand can be met is
for the price to rise to a level that attracts enough supply to match demand.
When this point is reached, the price does not advance. If the offer to sell is
higher than the demand to buy, the only way the supply will be absorbed is as
the price drops to a point that attracts enough demand to absorb all
the amount. When that happens, the price doesn't go down.

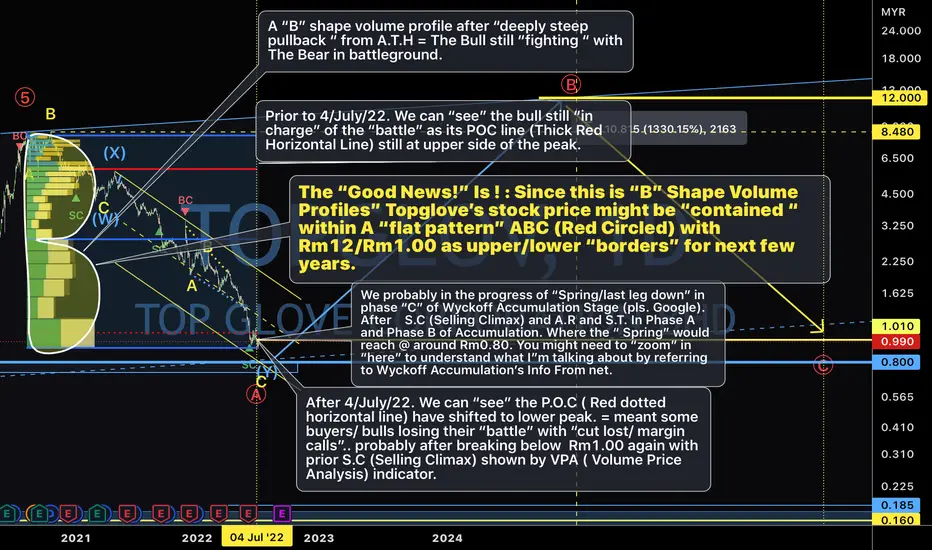
Topglove’s volume profile & Wyckoff method. 11/July/22.Topglove chart again!? It must be very “boring” as I “re-access ” my ideas again and again on Topglove chart..BUT since I personally invested on it I never treat my hard earned money lightly..
Wyckoff Logic Supply and DemandEURUSD
Technical analysis
Cause, re-distribution, equilibrium sequence between demand and supply between quotas , supply zone 1.07903 & 1.03509 demand zone .
Supply greater than Demand!
Implications, bearish!
Pattern Drop base Drop!
Effect generated by approx
260 pips.
SL 1.04734
Entry , sell! 1.02844
TP 1.00251
⭕ = circle
⏹ = square
🔺️ = triangle
Unit = ⭕ market
Polarity = 🔺️demand & 🔻supply
Equilibrium = ⏹ range ("the ratio between supply and demand is =")
PRINCIPLE OF DEMAND AND SUPPLY
The law of supply and demand
- here the analysts study the relationship between supply and demand , having as a reference point the price and
volume over a period of time as shown on the chart.
KEY DEFINITION
The law of supply and demand is of the utmost importance. If the application to
buy an instrument (currency pairs, stocks, commodities , metals, bonds, cryptocurrencies)
is higher than the available supply, the only way the demand can be met is
for the price to rise to a level that attracts enough supply to match demand.
When this point is reached, the price does not advance. If the offer to sell is
higher than the demand to buy, the only way the supply will be absorbed is as
the price drops to a point that attracts enough demand to absorb all
the amount. When that happens, the price doesn't go down.

Nasdaq 100 in Wyckoff Re-Distribution Trading RangeThe Nasdaq 100 index (NDX) price continues to be observed in a down trending Wyckoff re-distribution trading range. The NDX price broke the support of the previous trading range on Jan 18, 2022 and the downward price move was halted several days later with the selling climax (SC) event.
Here I offer two scenarios for the future NDX price: (1) a bullish scenario, and (2) a bearish scenario.
For the bullish scenario to play out, the NDX price needs to break the closing price on May 25 ($11,935), May 26 ($12,282), and May 27 ($12,665). Failure to do so would invalidate the bullish scenario.
For the bearish scenario, the price would need to reverse then break the trading range support ($11,334). If this were to occur, the NDX would likely find support at around $10,500. Failure to break the trading range support would invalidate the bearish scenario.
Given the strong positive correlation between the NDX and BTC, which can be viewed as a risk-on stock, Bitcoin HODLers will be watching these events play out with great interest. Happy trading!
Wyckoff abbreviations: automatic rally (ARa), selling climax (SC), secondary test (ST), upthrust (UT), failed upthrust (FUT), shakeout (SO), sign of weakness (SOW), upthrust after distribution (UTAD).
This is not financial advice. I am not your financial advisor. This is my opinion.

AUDJPY Dropping after reaccumulationSo I've been wondering how to differentiate between accumulation and redistribution. Today I realized that it's possibly just a matter of watching what happens after the sellers climax / Spring:
If after the SC we directly get aggressive AR (breaking previous Lower highs) and some STs (AR morphing into BC) then we'll wait for the UT and know we've switched back into distribution from accumulation

BTC LONG Until 21.4k / 22.3k then SHORT to 16.3k!I made a previous Wyckoff chart too early on and I imagine lots of Bears were expecting a dump a lot earlier than how it actually happened.
Now we are at this point, the situation is very clear.
I can see this whole dump has been circled around the Monthly close.
Now sometimes, there will be an initial Bull trap pump on the Monthly close, so I won't be setting Limit orders at 21.4k because I could wake up rekt. I am aware this could take us to 22.3k. (Apologies, my 2nd red squiggy line should have drawn it to 22.3k)
However a max of 21.4k here is also a possibility, before we finally dump. I will be Market ordering based on what I see on the 1 minute charts during these levels.
I am currently LONG 20,680 with a TP of 21,390.
Something tells me I won't be getting much sleep 1st-2nd July!

Farm Fresh Bhd - a candidate for defensive playAs proxy for defensive sector play, we choose Consumer Staple and new-IPO company (growth consideration as added value). The price is the lowest range since IPO, so we think the value has emerged for accumulation and will monitor the progress.

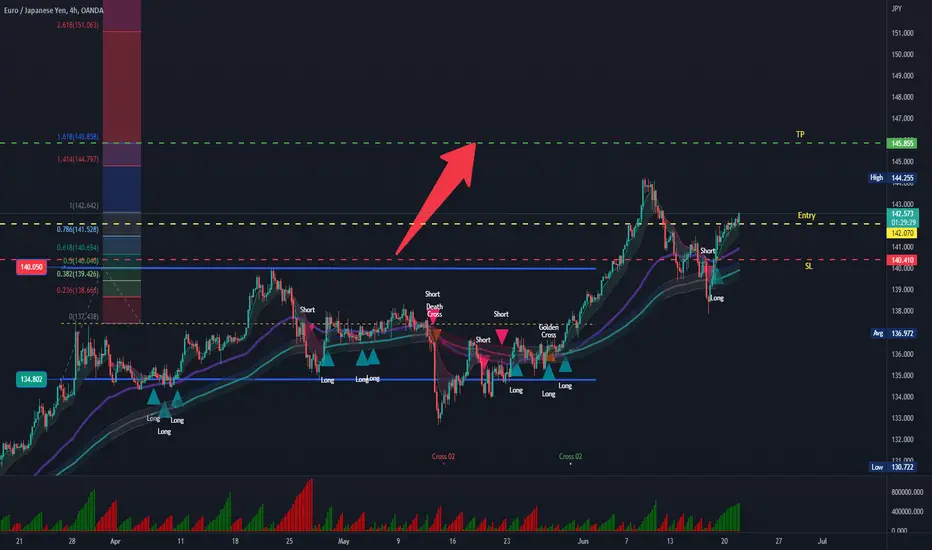
Wyckoff Logic Supply and DemandEURJPY
Technical analysis
Cause, re-accumulation, equilibrium sequence between demand and supply between quotas, supply zone 140.050 & 134.802 demand zone .
Demand is greater than Supply !
Implications, long!
Pattern Rally base Rally !
The effect generated by approx
378 pips.
SL 140.410
Entry, buy! 142.070
TP 147.000
⭕ = circle
⏹ = square
🔺️ = triangle
Unit = ⭕ market
Polarity = 🔺️demand & 🔻supply
Equilibrium = ⏹ range ("the ratio between supply and demand is =")
PRINCIPLE OF DEMAND AND SUPPLY
The law of supply and demand
- here the analysts study the relationship between supply and demand , having as a reference point the price and
volume over a period of time as shown on the chart.
KEY DEFINITION
The law of supply and demand is of the utmost importance. If the application to
buy an instrument (currency pairs, stocks, commodities , metals, bonds, cryptocurrencies)
is higher than the available supply, the only way the demand can be met is
for the price to rise to a level that attracts enough supply to match demand.
When this point is reached, the price does not advance. If the offer to sell is
higher than the demand to buy, the only way the supply will be absorbed is as
the price drops to a point that attracts enough demand to absorb all
the amount. When that happens, the price doesn't go down.