The Laws of Wyckoff: Effort Vs ResultIntroduction:
---------------------------------
Richard Demille Wyckoff (November 2, 1873 – March 7, 1934) was considered one of the five “titans” of technical analysis , along with Dow, Gann , Elliott and Merrill.
Wyckoff was an avid student of the markets, as well as an active tape reader and trader. He observed the market activities and campaigns of the legendary stock operators of his time, including JP Morgan and Jesse Livermore. From his observations and interviews with those big-time traders, Wyckoff codified the best practices of Livermore and others into laws, principles and techniques of trading methodology, money management and mental discipline.
Laws of Wyckoff
---------------------------------
Wyckoff Analysis is fundamentally based off the Three Laws of Wyckoff, which can be found and recognized across many different types of Analysis, the Laws help give insight to our analysis and choice of buying/selling.
The Three Laws of Wyckoff are:
Supply & Demand
Effort vs. Result
Cause & Effect
Law #2: Effort vs. Result
---------------------------------
Wyckoff states that every effort should lead to a result in the financial markets.
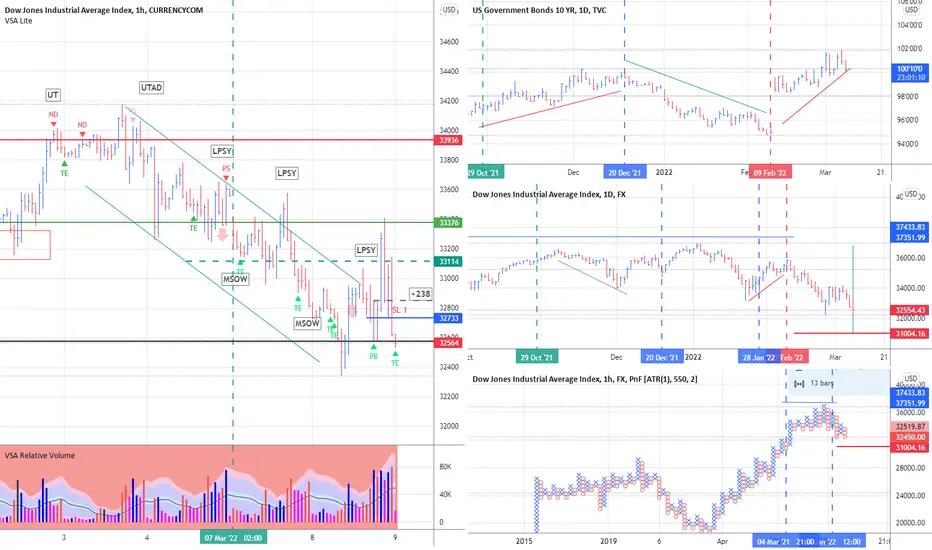
The above example describes the concept of Effort vs Result in a Trading Range (Parallel Channel) using Volume & Price Based Analysis
This statement is applied to our charts by using data found on Trading View from the Volume Indicator. When we see abnormally large trading volume at key areas on the chart, such as a defined "TR (Trading Range)" we can usually expect a continued move in that direction, this is called the Breakout of the range.
But if buyers cannot gather enough momentum to continue the Breakout action, they may become trapped, and as prices fall back inside of the defined area, their Effort has produced no Result. That abnormally large trading volume can give us a potential sign that the participants betting on the market to move in that direction failed to gather enough momentum to do so (Light Blue), which leads to them being trapped (Dark Blue) and then a reverse in the opposite direction in price (Purple).
This kind of Analysis is not just "fixed" to the bottom or top of a Trading Range, Effort vs Result can be interpreted a number of ways, for example in the below image we can see that the Effort in this case was not outside of the range, but a failure from the buyers to hold prices INSIDE the range:
---------------------------------
Thank you and if you found this writeup insightful and informative don't forget to hit Subscribe, Like & Comment to show your appreciation. Visit my signature for further education on these concepts in action
Wyckoffmethod

BTC 6.2 RR Wyckoff Accumulation.Great trade, based on Wyckoff Method coupled with 2x VWAP/100ma/Volume setup for price action.
Exit at 44k respected beautifully.
Bitcoin could be on the road to healthy bullish recovery if we pass 45k.

Chainlink: 3 Bullish Signs#LINK #Chainlink has been dormant and bearish for quite some time. There are a few key things to note:
1. Whales are increasing buying of the token
You can visit www.whalestats.com to see the top ETHEREUM wallets and what they are purchasing/holding, many are starting to acquire LINK
----------------------------------------------------------------------------------------------
2. Selling volume decreasing on the chart with trapped sellers
This trading range has been going for quite some time yet the sellers were not able to secure a successful downwards breakout
----------------------------------------------------------------------------------------------
3. Fitting Wyckoff Schematic quite nicely
The Wyckoff Schematics help us identify the different between Accumulation and Distribution Trading Ranges - In a Trading Range the price Zig Zags up and down until eventually a breakout occurs, using the Wyckoff Accumulation Schematic we can see there are some clues in the similarities of the chart and the schematic that tell us LINK may be ready for a test of the upper bounds of the Trading Range.

DOT's accumulation behaviorTaking SC as the boundary to start the interval calculation, DOT has shown many positive volume and price events, the more obvious low-level and huge turnover with effort and causal deviation, and the rush for supply in the second test. After the spring, the price revealed a strong holding behavior, indicating that the floating supply has been largely cleared.We can expect to see a LPS which is the best buying point to test the trend. If it falls below the vertical demand column, it means that the marketmaker still intend to continue to suppress the price and extend the shock range.

AUDUSD WYCKOFF DISTRIBUTION SCHEMATIC #1Traders, if you liked this idea or if you have your own opinion about it, write in the comments. I will be glad 👩💻
This is not financial advice, always do your own research.

Wyckoff Tape Reading - $AA - BullishBackground - Mar 20, 22
* 🐂
* Maybe at an oversold condition
Current Condition
* I don't see SOW 🚫 🐻
* Reactions on decreasing volume
* Coming to reaction -> re-rest at 90
What am I looking for
🐂 - high vol absorption at 90
🐂 - low vol reaction to 71 support and buy spring
🐻 - Don't see anything in the immediate future
Video Analysis cln.sh

BTCUSD to hit $49500 by April 14 2022Based on Accumulation and distribution the charts are showing that bitcoin has finished absorbing the float and should start moving aggressively to the $49500 price mark.
by iCantw84it
03/19/22

IntcHello friends !
The INTC campaign begins its journey and now we are in the testing phase of the climate action

HD Bullish Wedge Break $50-70 move Just reposting this witha regular chart ignore the Strategy below I am not using that.
by iCantw84it
03/16/22

Rune looking hopefulIt's a beautiful view on the weekly. Decreasing volume over the whole trading range, then a spring-like pop at the end just recently. Currently testing the MA200 and a break out of the COG (bottom) looks likely if the MA200 is broken. Dunno, I like it though. I think we have a potential accumulative scheme over this whole structure and I expect a test to the top of the structure in the coming weeks/months.

FTM Trading RangeI'd speculate on this structure being distributive. Which is a contentious call, given the fervour of the FTM community and HODLers. I really hope it doesn't play out, honestly... but .. it seems very off to me. Check out the volume, no volume at all during the lower structure, but heaps on the tests to the top of the range, a lot of passing the supply over from pros who have made 4000% already and are offloading to people who think it's going to the moon. Hey.. I hope I'm wrong.. I'm just a noob anyway so don't listen to me.

Luna speculative structuresPinning down suspected structures.. zooming out to the Weekly chart looks to be an accumulation range overall. These are smaller local structures I'm finding within that, usually seen on the 4hr timeframe. Please, I'm by no means an expert.. just reviewing as we go along and keeping these as my own reflections.

TCOM following Bili trailing move by 9hrsTCOM will gap up tomorrow and follow bili into the same move.
Trailing this move by 9hrs
it popped 10 dollars today i think TCOM will do the same.
by iCantw84it
03.16.22

HD Bullish Divergence on the Daily 3.5 to 1 Ratio 15-25% moveHD now with a bullish divergence is set up for a run to its last previous high. 15-25% run on a 1 to 3.5 Risk Reward.
by iCantw84it
03.15.22

BTC: Sellers are getting stronger This analysis is based on the composite man theory of Wyckoff. In the following idea, I explained the principles of this analysis.
This analysis shows: The number of buyers compared to sellers (despite the constant volume of transactions) is increasing. This means that salespeople are getting stronger (composite men are on the sales side)
If continued, this could lead to lower prices, indicating that we are probably in a redistribution area.

Combining wyckoff's theory with ONCHAIN data"This is a hypothesis that needs more testing to be more precise."
Wyckoff's theory t is one of the most influential theories of market expression, and the most important components of which are lateral movement areas and trends. This theory turns the graph into something like Dots and lines (stations and paths). But it is not as easy to use as written in books. After getting acquainted with Wyckoff's theory, I read several books on the subject, hoping that they could help me identify this area of lateral movement, the area of accumulation, or distribution. But there was a fundamental drawback. It is challenging to diagnose this issue. In fact, the rules discussed in these books are highly interpretive and subjective, and two different individual traders may come to exactly opposite conclusions based on their interpretation.
But as I became more familiar with the onchain analysis, an idea came to my mind that might be useful for more objectively recognizing charts based on Wyckoff's theory.
Composite Man: Wyckoff proposed a theory to help understand price movements in stocks. this is the “Composite Man” theory. (The same concept of whales or strong hands.)
he said: “…all the fluctuations in the market and in all the various stocks should be studied as if they were the result of one man’s operations. Let us call him the Composite Man, who, in theory, sits behind the scenes and manipulates the stocks to your disadvantage if you do not understand the game as he plays it; and to your great profit if you do understand it.” (The Richard D. Wyckoff Course in Stock Market Science and Technique, section 9, p. 1-2)
In fact, composite Man is a hypothetical man who has so much money and stocks that when he wants he can gradually increase the price by buying stocks and creating demand, and when the price goes high enough he selles his stock and lower the price. The composite man is the main player in the market. Wyckoff says that if you want to make a good profit from the market, figure out what a composite man game is.
In fact, having a way of showing us where the Composite Man is in the market, can help us understand future trends
Who are the strong hands in the cryptocurrency market? (I use the strong hand word here instead of the composite man)
There are those who buy or sell more per capita than other market participants (retailers).
To understand this in the bitcoin market, I have used 3 charts and concepts:
1- Sending Addresses: The number of coins addresses making inflow transactions to the exchange.
Indicates the number of sellers' wallets (number of sellers)
2- buyers Addresses: The number of coins addresses making outflow transactions from the exchange.
Indicates the number of buyers' wallets (number of buyers)
3- Pay attention to this issue: the volume of transactions shows both the volume of sales and the buy (Volume of buy and sale is equal in the market)
Considering the above 3 issues, it can be concluded:
- If the number of Receiving Addresses is higher than the Sending Addresses (the number of people who bought compared to the number of those who sold), it indicates that more people bought and fewer people sold (given that the volume of sales and buys are the same) So the sellers were stronger hands. In such a situation, the composite man is on the sales side.
- If the number of Sending Addresses is higher than the Receiving Addresses (number of people who have sold more than the number of people who have bought), it indicates that more people have been sellers and fewer people have been buyers (given that the volume of sales and buys are the same) so the buyers were stronger hands. In such a situation, the Composite man is on the buying side.
To do this, the oscillator at the bottom of the chart divides the Number of Receiving Addresses by the Number of Sending Addresses. Numbers above 1.2 indicate that the Composite man is on the side of the sellers and should expect a price reduction in the future.
Values below 1 (or 1.2) indicate that the Composite man is on the buyers side. And we should expect price increases in the future.

Are we being fooled? Perhaps I am onto something here.Possible Wyckoff reaccumulation zone, my timeframe could be off but the picture still stands. It's my first publish please give me your thoughts and feedback.

BTC-USDT(Wyckoff Method)One of the primary reasons for using the Wyckoff method is to improve the market position by predicting the upcoming price movements, especially where a major risk/reward ratio is involved. Trading Ranges (TRs) is another concept used by the method which is used to determine the accumulation and distribution zones. These are those zones where the prices bounce between specific high and low points and a relative balance exists between demand and supply. Different institutions and traders prepare themselves for the next bull run by making buy and sell decisions using these ranges. In both the accumulation and distribution process, a composite man/mediator actively buys and sells. This volume or extent of distribution and accumulation further reveals the next moves for traders.The distribution and accumulation are considered as the most important part of the Wyckoff method in the cryptocurrency community. These schematics are divided into two sections, named distribution and accumulation. These sections are further divided into five sub-sections (ranging from A to E).

NAS100 Buy AnalysisLooking at NAS100 on 30M timeframe
We looking for potential long position
Nasdaq has been forming accumulation schematic

HDon the action we know that now the seasonal trend begins so we are preparing and looking for areas of accumulation
friends I will keep you informed
friends support me and subscribe to me

GBPCAD now we have a support point on the hourly chart developing situation so we will keep an eye on this situation and I will keep informed

Dow Jones Deal Reviewthe distribution phase was determined after which at the last point of testing the offer I entered the market
MONDAY LIVE: SPX500, USOIL, GOLD and FOREX Hi Traders,
This is my view for this week on:
- SPX500 FX:SPX500
- USOIL FX:USOIL
- XAUUSD FX:XAUUSD
- AUDJPY FX:AUDJPY
- EURUSD FX:EURUSD
- NZDUSD FX:NZDUSD
I remind you that this is only a forecast based on what current data are.
Therefore the following signal will be activated only if specific rules are strictly respected.
If you follow my strategy you will be able to identify the right filters and triggers to enter correctly the market and avoid fake signals.
I really hope you liked this video and I would like to know what do you think about this analysis, so please use the comment section below this video to give me your point of view.
------
Pit - Trading Kitchen
