Apple Breakout to UpsideApple is breaking out to the upside. It had a small re-accumulation window and will probably see a move up. Apple earnings are around the corner and provide a good catalyst for an upside move.
Wyckoffmethod

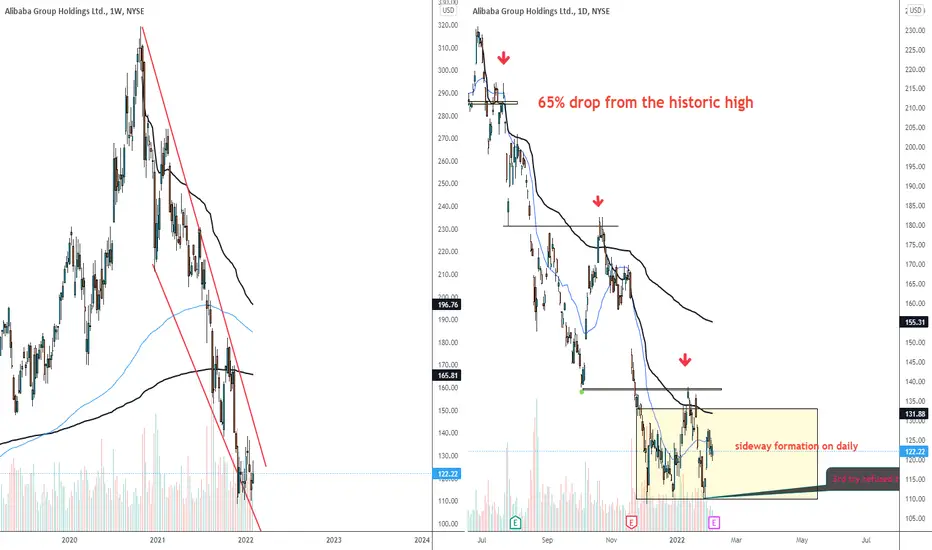
JICPT| BABA got my attention with daily sideway formationHello everyone. It's been a bloody two-year for BABA investors as it tumbled by more than 60% from late Oct. 2020.
As I analyze the daily chart, I noticed two things: firstly, the red downtrend has been soooo well respected. secondly, major daily flip levels served as good supplies.
What got my attention is not just the sideway formation on the daily. The decreased volume as well as the 3rd try failure to create new low are odds-enhancers for the bullish buyers.
I'm still loading tech ETTs with exposure to Chinese tech giants. Admittedly, current P&L is around -10% before CNY. I'm confident to breakeven and make 20-30% in 2022.
I recommend using dollar-cost-averaging strategy. We'd be patient for this setup to be paid off.
What do you think? Give me a like if you're with me.
ADA Wyckoff Re-Distribution Trading RangeThe ADA price has been in a downsloping Wyckoff re-distribution trading range from Sept 2, 2021 to the present. The upper and lower boundaries of this trading range are given by the horizontal black lines.
Wyckoff abbreviations: automatic reaction (ARe), buying climax (BC), failed upthrust (FUT), phase A (Ph A), phase B (Ph B), phase C (Ph C), secondary test (ST), shakeout (SO), sign of weakness (SOS), upthrust (UT).

EURUSD's Snap Bullish ReboundEURUSD's price action rebounded promptly from the previous swing low at 1.11250, as per the expectations of the Wyckoff method. It is now set to probe the 61.8 per cent Fibonacci retracement level at 1.12642, as adverse volatility from the war in Ukraine mounts .
The behaviour of the price action around this crucial threshold will determine the next most likely direction for the pair.

GGPI Lining up for a Push Up on all timeframesGGPI needs to come down close to these three areas before it can make its big push up. These targets will shift as price moves up and down. but should be close. I will update if they shift to much. Once these three areas are hit. The price should move pretty hard to the upside. As all time frames will be on the same stage of the Curve.

EURGBP on a Wyckoff point of viewHi Traders,
This is my view on EURGBP using Wyckoff method… what do you think?
I remind you that this is only a forecast based on what current data are.
Therefore the following signal will be activated only if specific rules are strictly respected.
If you follow my strategy you will be able to identify the right filters and triggers to enter correctly the market and avoid fake signals.
I really hope you liked this video and I would like to know what do you think about this analysis, so please use the comment section below this video to give me your point of view.
Pit
———————

Bitcoin Wyckoff Distribution We can analyze BTC as Wyckoff methods too
• Right now we are in phase E of Wyckoff Distribution
• As you see, the price reflects the AR and PSY zones of Wyckoff Accumulation (between 33-40k).
• This pattern is really similar to our 1st scenario, which I showed before you can find it here:
• It means the depth of BTC could be 29k; who knows? just we need to wait.
please see another scenario of BTC:

<TradeVSA> Technology Continue to SELL-OFF ! INARI | GREATECSign of Weakness in the chart:
1. Red Pentagon below 20/40ma
2. Upbar low volume
3. UT and ND near 20ma
4. Negative Pentagon Flow
Disclaimer
This information only serves as reference information and does not constitute a buy or sell call. Conduct your own research and assessment before deciding to buy or sell any stock

2 weeks ago the key was to wait the pullback, and now ? - LDTP#5Let's do the point !
Long time past since the last update, if you read it, I said I will wait for a pullback on the imbalances to gauge the buying force and potentially new entry setups (you can find this ideas attached to this one). And so ... Here we are. And another time PATIENCE was the key to not fall too rapidly in (maybe) a bull trap for retailers.
So, we had a first stop on the first imbalance area, no signal in it so that why I waited this second area to post another update. Furthermore we already have an interesting thing : on lower timeframe (5 minutes) we have an accumulation pattern of Wyckoff in construction and I will post picture of it with more details later in this idea. This setup is for me the first to focus on because if we fail in the spring I expect the price to go down to $35,000 AND SO the fail of the pullback on the imbalance AND SO a retest of the support area in the next days. If the Wyckoff pattern succeed, it will be a good opportunity to see nice pressure candle on higher timeframe (4 hour probably) AND SO the opportunity to see the basic pattern = Exhaust - Pressure - Volumes.
I want to add that for the moment volumes aren't convincing, they don't show interest for the level or from buyers, so buying volumes will have to be brutals to expect a long term bull conclusion.
Don't forget : "Making money in trading is math and respect of strategy, so never let your emotions guide you in uncomfortable positions"
PS : Like, follow or comment if you like, it give me some strength to continue! This idea will be probably update until I did a new idea.

EURUSD With a New Wyckoff Cycle The price action of the EURUSD is currently behaving as per the expectations of the Wyckoff method, and this week's economic releases are likely to bolster this trend.
There was a temporary break in the new Markdown, which was represented by the formation of the Flag pattern. However, the breakdown below the 38.2 per cent Fibonacci at 1.13524 indicated the continuation of the Markdown.
At present, the price action is probing the major support level at 1.13190, underscored by the 500-day MA (in blue). A breakdown below it would allow for a dropdown towards the 61.8 per cent Fibonacci at 1.12642. The previous swing low at 1.11400 represents a deeper target.

LULU 2to1 Option play for $10 gain over the next 30 daysLulu Looks ready for the taking ont his move. Yes I have all kinds of seizure induced indicators up....but if you look where there is no indicators you will find your trade. Looking a 3% move of $10 over 30 days. I feel like that is ample time to hit that target and if you are playing the option call you should make $1000 on one option call.
by iCantw84it
02/16/22

19 RR Trade, Wyckoff AccumulationOne of my best trades to date.
The price fell asleep along the breakout VWAP and exploded to target overnight, despite the FOMC meeting that same evening.
Really happy to have I caught that move.

<TradeVSA> Daily Stock Ideas - KABSign of Strength in the chart:
1. Green Pentagon Bullish signal
2. Market Stages with Pullback
3. Pullback with Spring and NS
Disclaimer
This information only serves as reference information and does not constitute a buy or sell call. Conduct your own research and assessment before deciding to buy or sell any stock

NZD/JPY 4H Wyckoff 23:1 Risk to Reward RatioWyckoff Trading Method is amazing to understand the market and the big players who move the market. The idea is to understand when the market consolidates and wether it is in a distribution/re-distribution phase or accumulation/re-accumulation phase.
Wyckoff gives you a big Risk to Reward Ration if entered right.
In the NZD/JPY attached picture, the price consolidated and before it there was a change of character, there I have identified the PS (Point of Supply). Then the SC (Selling Climax) and AR (Automatic Rally) were identified alongside ST (Second Test) to mark the end of Phase A. Trading Ranges are identified by SC & AR.
Phase B had an Ultimate Thrust followed by an ST for Phase B.
Phase C is where the big players trick you into thinking the price will go down while in fact the want to push it up. That is called the Spring which is then followed by a Test. The Test usually happens to gather the hedge funds companies to join along.
Phase D is where we see Signs of Strength and could be followed by a Last Point of Supply for any companies to join along.
You could enter a trade in Phase C or Phase D only and you could even go on lower timeframes for better entries.
You have to have patiences when trading Wyckoff because you could have Re-accumulation instead of Accumulation. In our online courses, we'll teach you how you can identify the difference :)
Please share and support and let me know what you think in the comments section. Thanks !

Dnex : Reaccumulation after DeclineJust showing here the example of reaccumulation type 1 that happens to Dnex

BTC USD Nearing Support in the Daily TimeframeShown here is a brief re-accumulation trading range (Jan 22, 2022 to the present) for BTC USD in the daily timeframe. The upper and lower boundaries of this trading range are given by the horizontal black dotted lines. The gray shaded areas show support and resistance zones. Significant bars, which help define important areas of support and resistance, are given by the blue shading. The upper and lower bounds of the linear regression channel are given by the solid green and red lines, respectively. The solid black line is the midpoint of the linear regression channel. In this case, I expect the upper bound of the linear regression channel to act as strong resistance and the lower bound of the linear regression channel to act as strong support.
Shown in the bottom panel is the Phoenix Ascending indicator, comprised of the green exponential moving average (EMA), red stochastic relative strength index (sRSI), blue least squared moving average (LSMA), and the grey energy (GE). The ideal long entry occurs when the red sRSI is on the upswing and is about to be contacted by a green EMA on the upswing.
Wyckoff abbreviations: automatic rally (ARa), back up (BU), last point of supply (LPSY), last point of support (LPS), phase A (Ph A), phase B (Ph B), phase C (Ph C), phase D (Ph D), phase E (Ph E), secondary test (ST), selling climax (SC), sign of strength (SOS), sign of weakness (SOW), upthrust (UT).
With regard to Wyckoff events, opening a long position on the BU/LPS typically is a pretty safe entry. The Phoenix Ascending events suggest that it isn’t quite time to open a long position. For example, it’s generally a bad idea to open a long position with the sRSI trending downward. It would be better to wait until it trends upward again. Patience is key to consistently profitable trading.
I would consider opening a long position around $41,600 and closing the position around $48,500. Let’s keep our eyes on this and act accordingly. I will provide an update with regard to my actual trade.
This is not financial advice. I am not your financial advisor. This is my opinion.

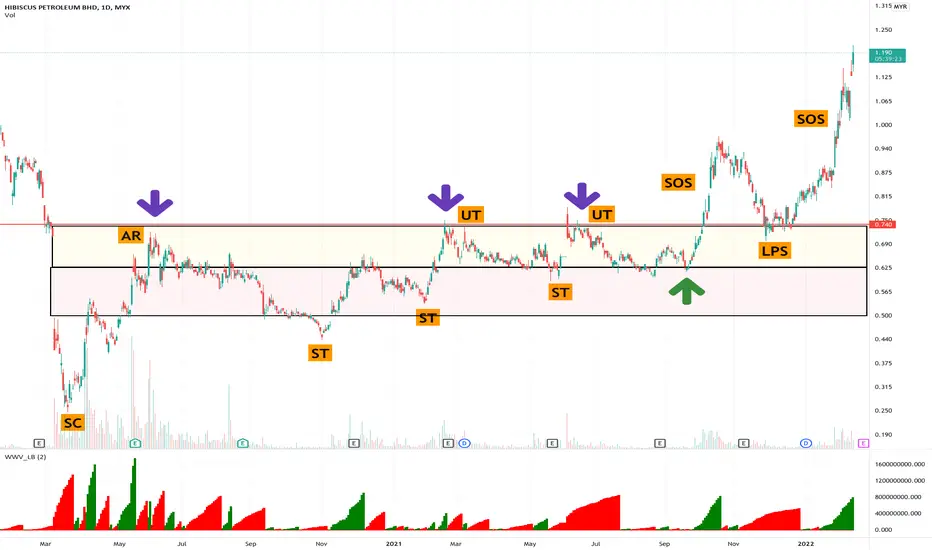
Oil and Gas : Hibiscus, Carimin in focusJust for record on beautiful ascending triangle channel (without spring) schematic of accumulation for Hibiscus.
ionQ to make a 46% move in 30 days on 12 hour.This is a longer setup then i normally play but that should equal a stronger move.
by iCantw84it

MONDAY LIVE: SPX500 AND FOREX - FEB14Hi Traders,
This is my view for this week on:
- SPX500
- XAUUSD
- AUDJPY
- EURGBP
- EURJPY
- EURUSD
- GBPUSD
I remind you that this is only a forecast based on what current data are.
Therefore the following signal will be activated only if specific rules are strictly respected.
If you follow my strategy you will be able to identify the right filters and triggers to enter correctly the market and avoid fake signals.
I really hope you liked this video and I would like to know what do you think about this analysis, so please use the comment section below this video to give me your point of view.
PIt
———————

JICPT| Tencent in the late stage of accumulationHello everyone. It's been a while since I published ideas regarding Tencent. After analyzing the global market to identify the sweet spot to park the assets for my client, Tencent again got my attention.
From the daily chart, we can see the key anchored level around HKD412 is well respected after massive sell-off with above the normal volume. In my opinion, Tencent is in the process of accumulation, perhaps, the late stage.
The upper boundary of the sideway channel is HKD515 to HKD528. I'm looking for big size candle with high volume to take over it.
By setting the alert, let's see how it reacts to the boundary this time. The next target after confirmed breakout is HKD644.
What do you think? Give me a like if you're with me.

Wyckoff UpdateWe still appear to be on track for this move, adjusted fractal based on the updated timescale of the movement.

US30 ANALYSIS CONTINUATIONA substructural view of US30 breaking highs and giving potential buy signal

RE : AUD USD - Why i am looking to SellA Sniper Entry Trade has been entered. I'm looking to hold the trade to the Target level. This is going to have a VERY HIGH RISK TO REWARD RATIO.. First i've ever gotten. Let's GOO !
