EURUSD will push higher now, upon reacting to LTEURUSD has been making corrective structure since the Sellers Climax(SC), with the touch of 1.17750 (confirmation zone of LQP) and liquidity push to the upside, we can confirm that was the last touch. it will push higher up into the 1.1920 area before coming down to correct the structure to once more pushing higher.
1.17750 is end of Larger second wave of Elliot wave counting.
Wyckoffmethod

Another Wyckoff Accumulation forming + Bullish Gartley.Looks like another Wyckoff Accumulation pattern is forming inside of a Wyckoff accumulation. Yesterdays crash to 31500 was the spring of the pattern which also was a completion of a bullish gartley. We are currently in Phase C of the Wyckoff accumulation pattern on this smaller accumulation. Remember, the Wyckoff accumulation pattern is a manipulation of the lows which is clearly visible on the chart. There are also bullish divergences on the RSI and the MACD! Really good entry for a long position after the test of the spring. Targets to look out for would be the 41-42k area. Don't forget to follow for more trade setups. Good Luck traders!

Wyckoff on EUI loved this markup because it shows me I'm thinking better about charting and WHY a move is made.
So This played out nice. I think it will still clear a bit more liquidity at the top before heading back down IF the downward trend is over this is a good place to go higher.
There was several OB's unmitigated that got filled the last 2 days. After the news drop it went back up then down and on its true path.
The buy and sell were off unmitigated OB's with entry from 5M TF
So this started a a sell yesterday that turned into a buy today.

OIL PRICES RISE | POSSIBLE PULLBACKOil prices rise over 2% on Friday as the market reacted to falling U.S. inventories, and signs of strong Asian demand from both China and India added support. However, a possible pullback before upside continuation.

Wyckoff GoldGold didn't go as low as I would have liked but the short sell it made was good.
Waiting for the low for the buy move off the OB but there is an Imbalance (IMB) at top that Gold my go to to mitigate that area.
Wyckoff Schematic that BOS to confirm move. BUT took a while for confirmation to come for down move.
Best view on 1M but can't do 1M here.
If interested use the OE (order entry) price to view what I saw and the BOS downward.

Wyckoff on NASThere was so many Wyckoff Spring entries today (pink) along with unmitigated areas and liquidity created.
Yesterday was a good day also with Wyckoff.


Wyckoff Distribution PhasesDisclaimer: This is a personal observation, I don't intend to claim this facts as the absolute truth of the events that are happening in the market.
As we can observe, the Wyckoff Distribution Model suggests that BINANCE:ADAUSDT is standing on the Last Point of Support and (supposedly) should bounce back looking forward to get back on track with the B ull market .
It will take a while for the price to show this sentiment, but if this continues, we would definitely see Cardano getting back on the $1.40 level.
Trade safe.
Cheers.

EURJPY, Setting Up For A Potential Long.EURJPY
"Our goals can only be reached through a vehicle of a plan, in which we must fervently believe, and upon which we must vigorously act. There is no other route to success" - Pablo Picasso.

Wyckoff Accumulation, Last chance to get in before the big move!So I know many people are saying that this Wyckoff accumulation pattern has been invalidated due to the lower highs and lows we have been getting but I still believe this is part of the wyckoff accumulation and we are really close to the markup stage. Here is my argument to why its still valid. So first off wyckoff patterns are never 100% accurate and we can prove that by looking at previous charts and history. They all play out the same way in the end but the process might vary from chart to chart and coin to coin. These past lower lows we have been getting look really familiar with the distribution phase we had when BTC reached 65k. So I went back and looked at the distribution phase of BTC and inverted the scale so that it looked like a wyckoff accumulation instead of a distribution. As you can see: BTC did the same exact thing it is doing right now by forming lower highs and lower lows trying to shake the last retail investors before finally rallying up to 40k. In the image I posted BTC went for about 25 days from the (spring) stage to the launch up (inverted ofcourse). On this chart right now Its only been 20 days from the spring to where we are right now. If we add 5 more days that would put us at the 17th of July which is where Im personally expecting this big move to happen. Now if BTC breaks out of the falling wedge and retests that resistance as support that's a strong sign of bullish momentum. Also as soon as BTC breaks my green box around 36k it should according to the wyckoff accumulation pattern go straight up to 41-42k and form the pennant. Now this was quite a long post and I would really appreciate a follow or a like. If there is anything that isn't clear, feel free to ask me in the comments! As always, good luck traders!


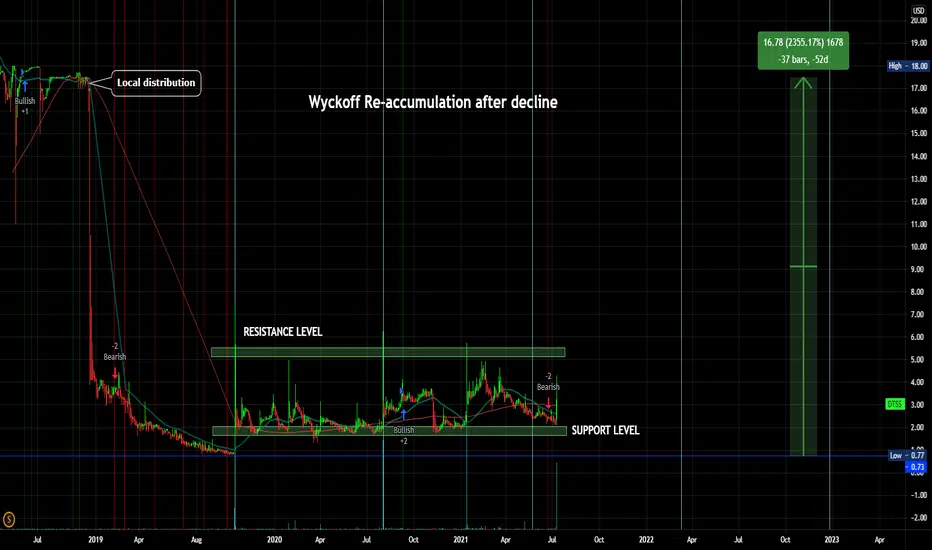
$DTSS Wyckoff Re-accumulation after decline$DTSS Wyckoff Re-accumulation after decline, between Spport and Resistance levels
Datasea Inc., through its subsidiaries, provides smart security solutions in the People's Republic of China. It develops big data security and smart 3D security platforms, safe campus security systems, scenic area security systems, and public community security systems, as well as epidemic system. The company offers its smart security solutions primarily to schools, tourist or scenic attractions, and public communities through its own sales teams, partner agents, and newly founded operating entities. It also develops and offers education-related technologies to build campus networks, education management systems, education cloud platforms, science education platforms, and other education systems used in schools. The company was formerly known as Rose Rock, Inc. and changed its name to Datasea Inc. in October 2015. Datasea Inc. was incorporated in 2014 and is headquartered in Beijing, the People's Republic of China.
USDCAD RE-ACCUMULATIONo
Last week I thought price would go down and fill the imbalance left but boy was I wrong.
Far from speculation I have concrete evidence that usdcad will not see a new low form coupled up with a very nice narrative for the pair. So here we go:
We saw usdcad complete the accumulation phase after taking out all liquidity below. What follows next in the wycoff cycle is a series of reaccumulations and the first one has just being completed
After showing a sign of strength, the pair closed at a 4HR institutional candle where they have their buy orders. i.e Not expecting price to go below that candle
For a low risk set up I would look for a wycoff accumulation in the lower time frame next week.
Beware of high impact news on wednesday and friday that affect the pair.
A spring is most likely to happen on friday but I would rathher wait for price to show me its hand.
Find previuos analysis atached below,

AUDJPY - ShortThe very first time that Volume in down movement is greater than upward, it means we are ether in pullback after PSY, ST(A), or ST(B). All in all, it means we are close to the end of the uptrend.
After that, we will see that the movement to the down has more volume than up movements.

DXY Wyckoff DistributionNice and clear Wyckoff Distribution on Dolar Index. I will explain below what all the letters on this chart mean so that you can understand it better.
PSY—preliminary supply, where large interests begin to unload shares in quantity after a pronounced up-move. Volume expands and price spread widens, signaling that a change in trend may be approaching.
BC—buying climax, during which there are often marked increases in volume and price spread. The force of buying reaches a climax, with heavy or urgent buying by the public being filled by professional interests at prices near a top. A BC often coincides with a great earnings report or other good news, since the large operators require huge demand from the public to sell their shares without depressing the stock price.
AR—automatic reaction. With intense buying substantially diminished after the BC and heavy supply continuing, an AR takes place. The low of this selloff helps define the lower boundary of the distribution TR.
ST—secondary test, in which price revisits the area of the BC to test the demand/supply balance at these price levels. For a top to be confirmed, supply must outweigh demand; volume and spread should thus decrease as price approaches the resistance area of the BC. An ST may take the form of an upthrust (UT), in which price moves above the resistance represented by the BC and possibly other STs before quickly reversing to close below resistance. After a UT, price often tests the lower boundary of the TR.
SOW—sign of weakness, observable as a down-move to (or slightly past) the lower boundary of the TR, usually occurring on increased spread and volume. The AR and the initial SOW(s) indicate a change of character in the price action of the stock: supply is now dominant.
LPSY—last point of supply. After testing support on a SOW, a feeble rally on narrow spread shows that the market is having considerable difficulty advancing. This inability to rally may be due to weak demand, substantial supply or both. LPSYs represent exhaustion of demand and the last waves of large operators’ distribution before markdown begins in earnest.
UTAD—upthrust after distribution. A UTAD is the distributional counterpart to the spring and terminal shakeout in the accumulation TR. It occurs in the latter stages of the TR and provides a definitive test of new demand after a breakout above TR resistance. Analogous to springs and shakeouts, a UTAD is not a required structural element: the TR in Distribution Schematic #1 contains a UTAD, while the TR in Distribution Schematic #2 does not.

BTC and Wyckoff? There is a possilbity that big players are already buying the dip without the public noticing it. What do you guys think? Comment below your views.

Last flight Bitcoin Max 82/000 Before the historic fallIt is being formed according to the
Wyckoff Method
And the Bitcoin accumulation model. The price of Bitcoin now should be 79,000, but it is at the price of 34/800
It will soon reach its historical peak
Min = 72/000
Max = 82/000
Plan A
It is anticipated
And in the worst case scenario B
In any case, the ascent to 42 occurs

VIPS MACD Divergence by MADO how I use it to predict Breakouts2VIPS
First I want to give mad props to MADO for his/her Divergence MACD Indicator. I found this last night and this is what I have found while using it. Although it doesn't preplot every divergence I would like to see and there are a lot of other things I wish it did...maybe some programmer or Mado themselves would like to help put what I see all together into one indicator. That Said while using the indicator I found that not only can you predict when it will break out but also what it will do when it does, and how far it could go. I have only tested this on a few stocks as I just found this out and wanted to post it while I was discovering it. So its not polished and its not withheld in any way its exactly as I am discovering it. I will make a video again as the first 2 errored out due to my poor internet. lol
@MaDo if you are viewing this I want to give you mad props on this indicator. By far the best one I found and yes im using it not as intendid but thats how i use all indicators. If you are interested in helping me make a version of this with my twist to it I would gladly help you see it the way I see it so that you could. Feel free to reach out anytime.. That goes for any programmers that come across this. I see a lot of things most people dont due to my acquired savant syndrome and would like to share that with the world.
by iCantw84it
07.09.2021

CPNG its like a small Chinese AMZN -Bill Gates and Warren BuffetWhy: Warren Buffet and Bill Gates moved most if not all of their stocks out of tech and into other Sectors....At the bottom of the list of their stocks they heavily invested in was this stock...I found it odd out of the bunch it was the only one I didnt recognize. So it peaked my interest. From what I gather its kind of like the Chinese AMZN but smaller. Taking that into account I did my key algo and found this path for it. I wanted to make sure it had plenty of time to do its thing and go the distance so I got option calls for 10 all the way out in Sept 2021.
by iCantw84it
07.09.2021

Wyckoff's Accumulation phaseThis is Wyckoff's Accumulation phase that is tricky to understand, Wyckoff's methods are real smart money concept. Actually Wyckoff's understand how SM place their orders. So after a long time by studying markets sir Wyckoff distributed his knowledge between public. And reality is Support and Resistance work but not so nicely SM know how retail traders trade the market. So they break the retail levels induces public and collect their orders and reduce public From trades. Concepts are little bit complicated to apply in real time chart, but it actually works.
If anyone wants to learn those concepts then they can search on Google 'Wyckoff's method'.

MACD Divergence by MADO and how i use it to predict breakoutsFirst I want to give mad props to MADO for his/her Divergence MACD Indicator. I found this last night and this is what I have found while using it. Although it doesn't preplot every divergence I would like to see and there are a lot of other things I wish it did...maybe some programmer or Mado themselves would like to help put what I see all together into one indicator. That Said while using the indicator I found that not only can you predict when it will break out but also what it will do when it does, and how far it could go. I have only tested this on a few stocks as I just found this out and wanted to post it while I was discovering it. So its not polished and its not withheld in any way its exactly as I am discovering it. I will make a video again as the first 2 errored out due to my poor internet. lol
@MaDo if you are viewing this I want to give you mad props on this indicator. By far the best one I found and yes im using it not as intendid but thats how i use all indicators. If you are interested in helping me make a version of this with my twist to it I would gladly help you see it the way I see it so that you could. Feel free to reach out anytime.. That goes for any programmers that come across this. I see a lot of things most people dont due to my acquired savant syndrome and would like to share that with the world.
by iCantw84it
07.09.2021

NDX/SPX Looks like a slower BTCUSDThere are a lot of technical facts displayed on the charts that should make the case very clearly that NDX/SPX (QQQ/SPY to get volume data) have very remarkable similarities with NDX/SPX is on the three day chart and BTCUSD on the daily chart. As such I think it is fair to use BTC as a leading indicator for what could be happening with NDX/SPX.
For those paying attention to crypto it has been taken over in part by the Wycoff patterns and people are scrambling to apply those patterns to their analysis. Plenty of work was done on BTCUSD and now people are looking for accumulation at these levels. I think that is a major mistake. Just as their is accumulation and distribution there is reaccumulating and redistribution where you reset for continuation. You can zoom in on NDX/SPX and do the exact same Wycoff analysis and you will be getting much the same results. I may do that as another post over the weekend as it deserves its own right up.
With NDX/SPX looking so bearish and the inter-relationship between all markets (due to prevailing interest rates, globalization, and the traders behind the screen) it seems that ultimately BTCUSD will be setting some lower lows and chartists should be looking for re-distribution, not accumulation. If none of this makes sense then I recommend you do a whole bunch of your own research and re-iterate looking for these patterns on trading view ideas for proper and improper applications. Here is the important thing... I heard way to many people say that the Wycoff Distribution Chart looked to perfect so they thought that it had to be fake somehow. But no, it triggered.
The main prediction of this analysis is that NDX is going to dump against SPY and in a very big way. There may even be a point where NDX is going down and SPX is going up for some considerable time but I think that is very unlikely. I think we are getting a very big move globally to the downside. I don't know what the news will be that will trigger the dump but it seems that it is coming within the next couple of weeks or so.
Initial Targeting for a Sensible bear market
As NDX/SPX is moving slower I also look at higher a higher time frame on the Keltner channels to help do some target setting and look for concurrence. With the monthly NDX/SPX on the left and BTCUSD on the weekly on the right we see that the charts still seem every similar in many respects. Price action was above the respective KCs and is now in the process of working its way downward.
If we get a high level of fidelity when it comes to the subsequent consolidation we could also see the same potential head and shoulders pattern beginning to take shape. Now BTCUSD hasn't triggered just yet. I suspect some more sideways action and when NDX/SPX is more completely in its bulltrap both will trigger close to one another.
A look at NDX and SPY shows that previously NDX has respected the Keltner Channels a lot more than SPY, and SPY often finds itself out of the monthly Bollinger Band. Might be interesting to see if that trend flips here during this next dip.
NASDAQ Bubble Pop Targeting
Unless we have a Great Depression like the 1920s and 30s the target setting for NDX/SPX is below the quarterly Keltner Channel. If you look closely you can see it seems that someone with a lot of money has used this chart before for the NDX/SPX price action to act so precisely at the orange arrows.
I am also not much comforted by the fact that these major indices are so close to major targets
Because BTC failed at its major target
disclaimers
This post requires a lot of patience to implement. You won't need to be so lightning fast to make these trades as you do on crypto though, and the crypto exchanges often go down so you don't get your order filled so buying the dips on and trying to sell the top could be more manageable. But if a bubble is ending individual equities could be blowing their top off so shorting too soon is a very big problem. Also I am not a financial advisor nor am I a CMT or other certified chartist.
If you are familiar with my TA then the chart below should be familiar. It is very bearish that the MTF VSTOP has appeared on NDXSPX. This will be a chart to watch and I think in short order price action will be slipping the 20 week again. If not and it is tested as support then this TA is in the process of being negated.
This idea is an expounding on my linked post which looks at higher time frames if you would like to see that analysis.

Bitcoin – Accumulation: A Wyckoff Study With BTC breaking down below $32.7k, it appear to me that we have just completed a wave 4 corrective triangle, within the final wave 5 of a larger 3-3-5 correction. All that is left is the final capitulation to complete the last element of this corrective structure.
Read in the context of the Wyckoff Method, this gives the technical structure for what I show as a Redistribution, and the final capitulation into a selling climax that will invigorate the Bulls into value buying, and trigger the Spring that has been so long in the waiting.
Looking at the Fibonacci projection for the larger corrective structure, and the Fibonacci Channel that has defined the trading range since late May, it appears that the bottom of the correction and the Spring is around $26k.
At least that is how I see it.
