BTCUSDT - Wyckoff AccumulationFollowing up on Uncomplication's call of the Wyckoff Distribution Scheme currently in Accumulation stage. If this continues to develop I will update the idea with the remaining of the schematics.
No financial advice, my personal studies only.
Wyckoffmethod

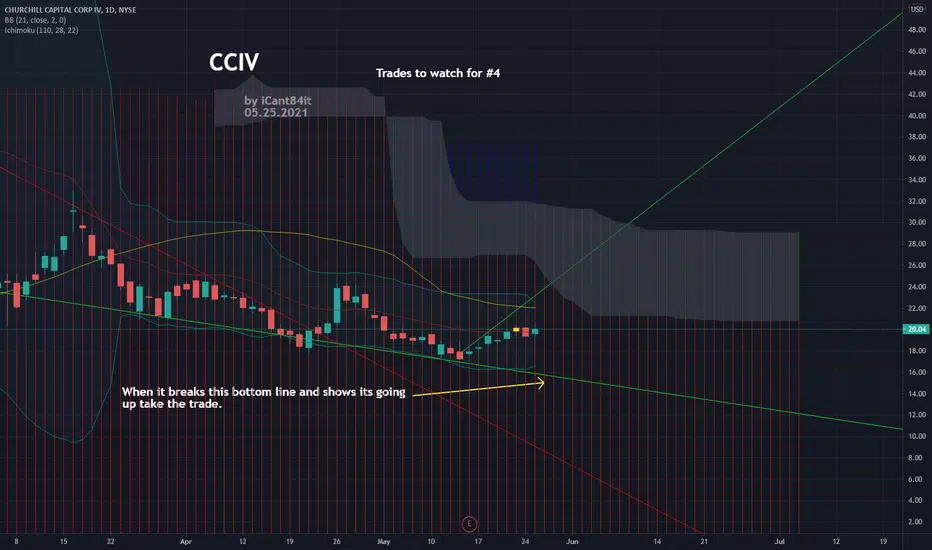
CCIV Lucid Motors Merger Looking for a place to get in?by iCantw84it
05.25.2021
SPAC Churchill Capital IV gains after Lucid Motors tweet about event tomorrow
May 25, 2021 12:06 PM ETChurchill Capital Corp IV (CCIV)Churchill Capital Corp IV (CCIV)By: Josh Fineman, SA News Editor3 Comments
SPAC Churchill Capital IV (NYSE:CCIV) rose 3.6% after a Lucid Motors tweet about a Lucid User Experience event tomorrow.
Electric car maker Lucid Motors is going public through a deal with SPAC Churchill Capital IV .
Earlier this month, Lucid Motors CEO won't commit to 20,000 electric cars in 2022.
See Seeking Alpha Catalyst Watch about CCIV event scheduled for tomorrow.
Textbook Range Play on the USDCAD The USDCAD has been behaving as per the expectations of the Wyckoff Cycle for quite a while now, which provides an insightful outlook on the likely behaviour of the price action in the near future.
Following the completion of the last Markdown, the pair went on to start establishing the current Accumulation range. Its existence is confirmed by the ADX indicator, which has been threading below the crucial 25-point benchmark since the 14th of May.
The development of a Hammer candle, which entails rising bullish pressure around the lower boundary of the Accumulation (at 1.20250), means that the price action has indeed bottomed out at the lower end of the Accumulation.
Hence, the price of the USDCAD is now ready to head towards the range's upper boundary at 1.21350. Before it can do so, however, the price would have to break out above the 50-day MA (in green) and the 100-day MA (in blue).

UEC about to go defcon 5 on this move...Uranium cheap at this $$Get your radiation suits on were about to go Nuclear....UEC has just hit Critical mass and is about to explode.....
by iCantw84it
06.01.2021

Johnson and Johnson Struggling Below a Historic Resistance The share price appears unable to break out above the historic resistance level at 170.00, which represents a very strong bearish signal.
Moreover, the price action has recently established a broad 1-5 impulse wave pattern, as postulated by the Elliott Wave Theory, as well as having developed an Ascending Wedge. Both of these developments confirm the bearish expectations.
Finally, yesterday's trading session resulted in the creation of a Shooting Star candle, which could be a precursor to an imminent reversal.
Overall, there seems to be a very strong confluence of bearish indications at present.
The 23.6 and 38.2 per cent Fibonacci retracement levels represent the most likely targets for such a dropdown.

AUD/JPY BUY IDEAHey tradomaniacs,
still testing my new style but we with AUD/JPY I see a great potential to move up!
A bit concerning as always could be the upcomign RBA Statement - I think it is likely to see a more hawkish statement and that the RBA will talk about a tighter policy in the future.
Risky setup - But overall deliecious in terms of risk-reward!
LEAVE A LIKE AND A COMMENT - I appreciate every support! =)
Peace and good trades
Irasor
Wanna see more? Don`t forget to follow me

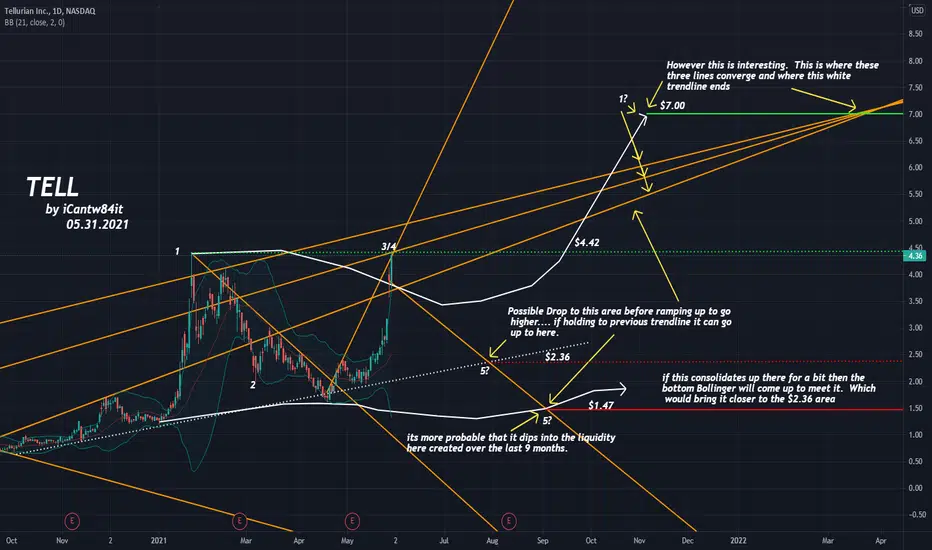
TELL me something......Why do all these lines converge up at $7.00?
Why does it dip down so far when its done going up? Seems a little extreme....
by iCantw84it by request
05.30.2021
Is BTC going through a Wyckoff Accumulation?BTC maybe going through a Wyckoff accumulation. Most of the market is currently following the overall trend of BTC so this distribution may be in play across the entire crypto market.
The yellow path is my predicted path of the market in the near future.
Please leave your thoughts below.
SOURCES:
Unable to provide original source due to account limitations. Please look at the StockCharts web page on The Wyckoff Method.

TWTUSDT WYCKOFF DISCTRIBUTION ANALYSISTrade Proposal:
There is a probability of first tp to the proposed ( 0.87 ) Direction line. So, Traders can set orders based on Price Action and expect to reach short term goals.
Technical analysis: TWTUSDT Waiting for the Range Bound and the beginning of the Ascension Trend.


SPCE Virgin Galactic Gaps up again **Update to 5.11.2021**Just an update to the 5.11.2021 call I posted.
by iCantw84it
05.24.2021

X Ready to pop Repeating Atlantis move from a month agoYes we have discovered Atlantis and you wouldn't believe what we found. Steel and lots of it!
by iCantw84it per Request
05.28.2021

BTC The Sky isn't falling and here is why..It says it all in the image. Wyckoff Method is very thorough and can be a lot to digest when price is swinging $50-100 a min. I relate this to riding a bull. If you break it up into smaller identifiable pieces you are able to maintain control of your emotions and not make decisions based off of them. I have been studying the curve for almost a year now. Everyday 12-14 hours a day. 2 Months ago I started looking for a logical explanation of what I saw in the market when I first started looking. (This is what I call the CURVE.) I didnt know what Wyckoff was back then nor did I try to find any outside help to sway me one way or the other.
I used price action and what the market was showing me everyday to come up with my own ruleset of moves, candle stick formations, and sequence on what happens on every part of the curve. A complete Visual guide to the curve. It wasnt until 2 months ago taht I found wyckoff that I found a logical explanation as to what I saw. Now I combine the two for a complete visual and tech explanation. Wyckoff and the curve are simpatico in every way. It was uncanny to me when I found it because it was the missing link.
I hope this helps people in their trading. If you like things like these please like and subscribe, put a comment below if you want me to explain anything else.
Thank you.
You can learn more about me by Google searching: WECT Scott Mele
or going to instagram and searching: iCantw84it
There you will find a news article about me and my acquired savant syndrome and my art.
My style of trading is linked to the way the acquired savant syndrome affected my brain and how I see things and know how to do things without prior understanding of them.
p.s. if you think institutional buying isnt in BTC you just need to crawl back in your hole and continue living out your existence in solitude as no one wants to talk to you.
by iCantw84it
05.28.2021

ONTX by Request on my mobile This looks like a winner to me I think the image covers it all. I hope this helps sorry I’m still out there f internet. So I did this on my phone

BITCOIN: Prediction of Perfect Point of dropHello Traders!
Well before showing your hate in the comment section think twice before what you say.
I predicted the crash when the market was near 60 but I saw very disappointing comments and after that, I Predicted the Second sell wave a few days ago and again I saw very disappointing comments. No one on Earth knows where it's heading not even manipulators. So I am trying my best with my experience.
Let's talk about Harsh truth Now,
Bitcoin is bearish since Mid April and it is still falling. It clearly formed the Wyckoff's distribution at peak then drop hard. Now it's in re-distribution form and it will drop again.
The first support is at 20,000 but it will not hold it longer. The preliminary support will be at 20K.
The bottom of the trend will hit the 11400 dollars. The market is Bearish for at least the next 100 days. Bearish Market can last 150 days.
The reason that I am expecting a 11400 price is that it is mid of the accumulation phase and this accumulation is attracting the price like a magnet. Once it hit the mid of accumulation the market try to run as quick as possible from the accumulation phase.
Don't forget to hit the like button and follow to stay connected

TME here is my .10 cent worth of info on this stock by requestI know I overcharged. I hope this helps.
by iCantw84it
05.27.2021

IMMP per request....I made another mess.Ok So I put lines everywhere from all over the place and in the confusion of it all some areas started to have some confluence.....everything kept pointing to $6.80. I appreciate the request to take a look at this.
by iCantw84it
05.27.2021
Please Like Subscribe if you would like to see more of these.

NAKD is done skinny dipping?NAKD looks like its about to repeat a 6 month Blip to a new high or at least come up from skinny dipping because its getting to prunny. One or the other we should be able to profit off it.
Done for a request, thank you!
by iCantw84it
05.26.2021

UEC Uranium Play is Ready to go DEF CON 5!I had a random thought, voice, divine intervention, I don't know what it was but out of no where I had this, more than a thought or idea, but it was clear... "Look at URANIUM! " Subtle real Subtle......*slowly starts to run away*
Anyways in my dive into Uranium Plays I looked at URA which is a ETF and good but kind of slow....and about 4 other Uranium Stocks....Then I found this one UEC. UEC is not only a Company that stock piles Uranium, they invest in other companies stocks that have uranium! ETF Warehouse of URANIUM! AMAZON of URANIUM! ok I digress you get the idea. So that said I found the bottom, drew my trend lines from the past, slapped it and called it Sally......Waited for it to dip and then bought in on some option calls. I think where it is at currently isnt a bad place to get in $3.07. The option calls are .15 out of the money and .25 in the money! I mean I dont know what gets you all excited but I couldn't stand up for 15 mins when i found this.....Mostly because My back hurt and it was locked up....but thats besides the point.
If you are looking to add some something Nuclear in your plays this is the play to get in on. Just my .02 cent worth but i mean thats all i can afford so dont listen to me......or do. Either way I'll still be sitting here not standing up.
by iCantw84it
05.27.2021

IWM what a mess i have made....but I did find the Deep V ComboOk after about an hour of breaking this down every way possible I finally see something recognizable. Theres a combo(what I call repeating moves I see in price action. Over the last 9-10 months I memorized all kinds of combos and this is the Deep V Drop move. There is a chance it can rally and go long when it pops up to hit the Upper BB. However, thats a rare one. I believe it hits upper BB might be 1 and done or could print 3 -4 candles moving diagnally hugging the BB as it does. When it finally prints a candle that isnt connected to the BB. Thats your trigger. if you arent as high risk as me. Wait for it to drop and hit the bottom bb. it will print 3-4 candles there and then pop back up to hit the mean one last time before free falling.
in the video I intertwine this with wyckoff and the curve and try to give it as much Gravity as I could.
Hope this helps,
by iCantw84it
05.26.2021

VET/USDT Price predictions what to expect in the next few daysAs VeChain has been testing a .618 fibonacci trend extension for the last 1.5 days combined with a support level based on the Wyckoff Accumulation an increase in price can be expected. However there are some major price levels that need to be recaptured, such as the 14.7-15 cents. When this level is broken the optimal scenario would be a backtest of this level after a successful test we can expect an increase to the 18-19 cent region.

Wyckoff Accumulation Bitcoin 1H At this moment the accumulation is at a critical point, in the first post about Wyckoff I assumed that the price was behaving as Schematic #1. However due to the extended fourth wave there is a possibility that it is switching to Schematic #2, this would than result in more of a trading range for the coming days instead of high volatile price action.
The retrace of last night was perfectly supported by the 0.66 (The top of an extended version of the golden pocket) of the fib retracement of the first wave. It was was also supported by the .236 fib retracement of the third wave (since there was no close below it). However, we should have a second test of the resistance level at ~40,500 within 24h. When this test does not happen we could see a low earlier than predicted.
Next to this, we can see a breakout form a relatively simple rising wedge pattern, the target of this breakdown is around the same region as the spring of Wyckoff in Phase C. However keep in mind that the resistance line (prior support) is not tested and thus not confirmed, this can lead to the fact that the pattern breakdown is uncertain.
As well I want to apologise for the misleading titles of the last two days in which it said that it is a distribution instead of an accumulation. A distribution is entered with an uptrend and an accumulation is entered with a downtrend.

PLTR forecastpossible spring might have formed at $17. If price rally up to $24 in the current bullish trend, support will be formed at $18. If not we will expect price will drop to ~$15
